Tombstone

You think you're pretty tough, don't ya, son?
I never knew a gunslinger yet so tough he lived to celebrate his 35th birthday.
I learned one rule about gunslingers.
There's always a man faster on the draw than you are,
and the more you use a gun, the sooner you're gonna run into that man.

Gunfight at the O.K. Corral, 1957
Dir. John Sturges

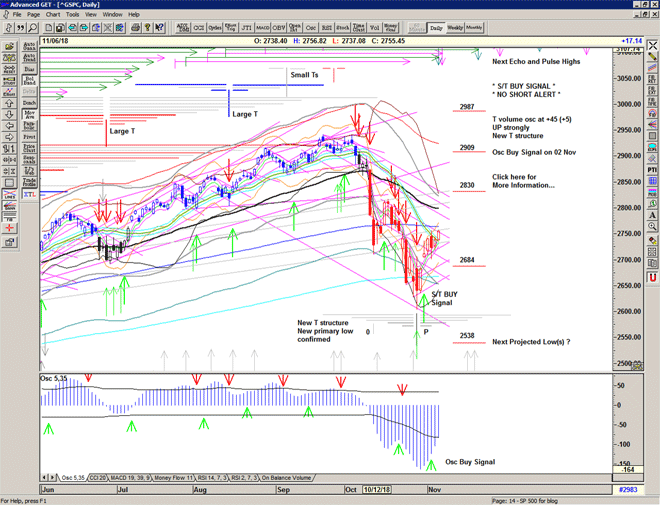
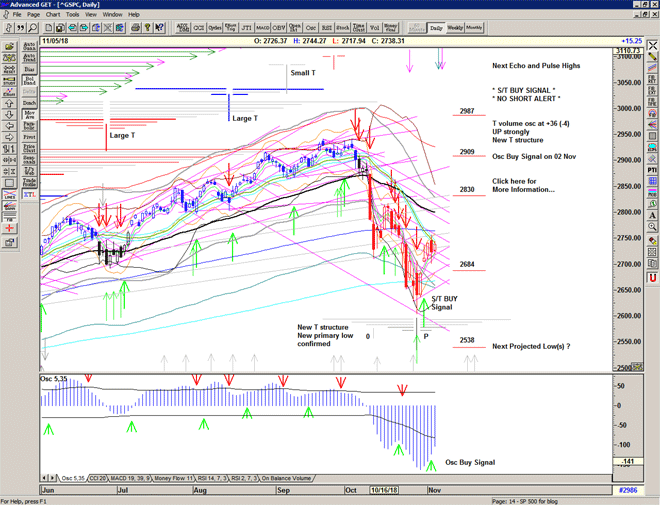
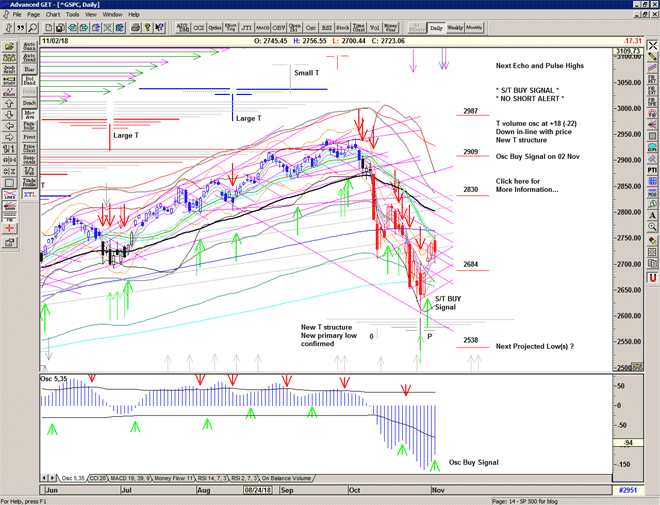
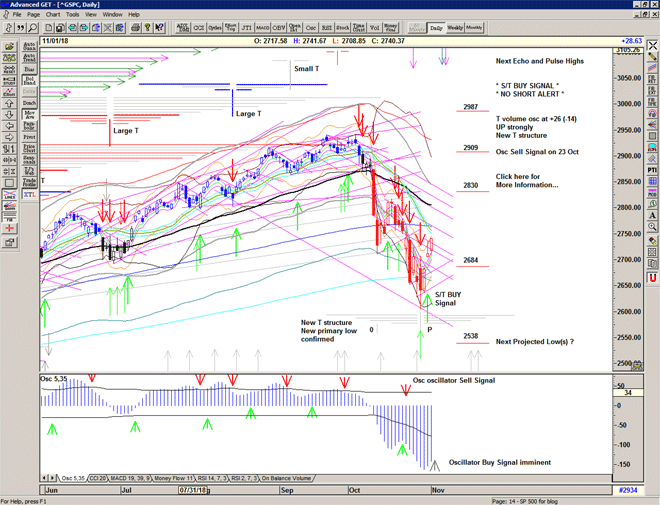
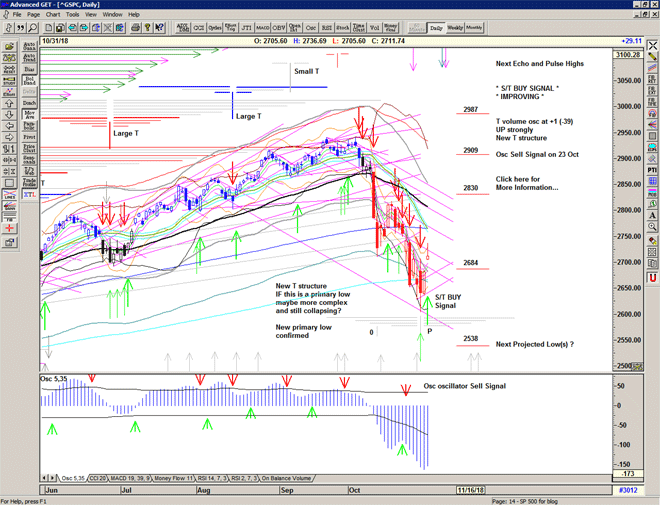
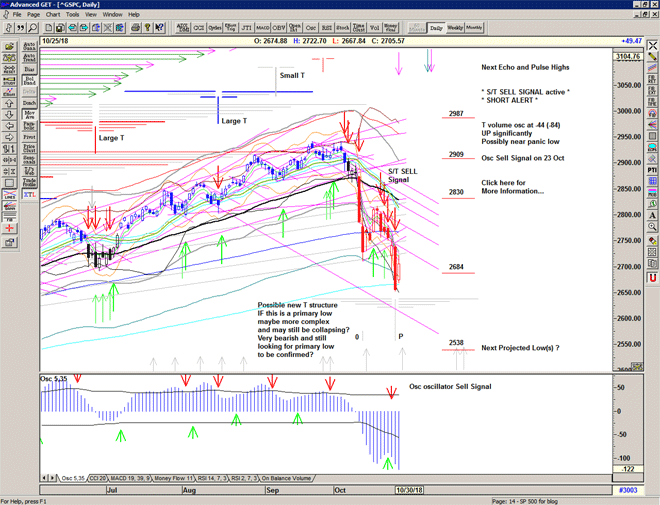
An echo high. The market rallies strongly from a deep low into an afternoon high. Recent characteristic late day selling at 2720 as the market continues to sell into strength.

The selling resumes overnight.

Chart of S&P 500 for 26 October 2018

Be prepared for whatever is coming next, and trade with confidence:

To receive detailed daily analysis, guidance and the updated daily Buy / Sell trigger levels being generated by the Trading the Line system before the market opens, and intraday alerts when appropriate, please become a Member and Sign up for Alerts & Observations – includes access to Members Area and the Explanatory Notes for all of the concepts discussed.

Disclaimer: This is the diary of a personal trading system, its methodology and the signals that it is producing. You are welcome to follow along but please understand that the information presented here is for educational purposes only. No recommendations are being made to buy, or sell stocks, options or futures contracts. Please consult your own financial advisor before making any investment decisions.


Saint Crispin

We few, we happy few, we band of brothers;
For he to-day that sheds his blood with me
Shall be my brother; be he ne'er so vile,
This day shall gentle his condition;
And gentlemen in England now a-bed
Shall think themselves accurs'd they were not here,
And hold their manhoods cheap whiles any speaks
That fought with us upon Saint Crispin's day.

William Shakespeare, Henry V, c. 1600

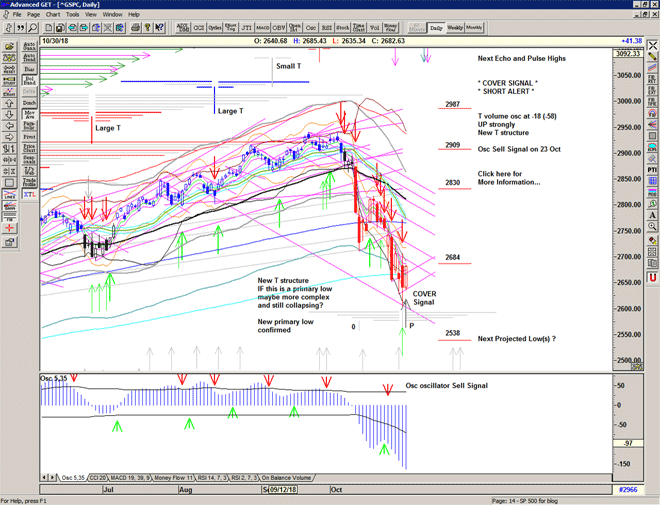
Blood in the street as the market makes a heavy plunge below 2700 to settle below the lower extreme for the first time since 2016.

Are we there yet? Well, maybe… but we will need to see significant stabilisation in price and in the oscillators to be convinced.

Relatively high ARMs and Put / Call ratios, but the VIX remains at levels that do not convey the drama of a 3% decline. Hmm still smelling a rat.

Watch to see if we have some kind of recovery followed by, more of the same.

And today is an echo high, after which we could expect… more selling.

Untitled-1

Be prepared for whatever is coming next, and trade with confidence:

To receive detailed daily analysis, guidance and the updated daily Buy / Sell trigger levels being generated by the Trading the Line system before the market opens, and intraday alerts when appropriate, please become a Member and Sign up for Alerts & Observations – includes access to Members Area and the Explanatory Notes for all of the concepts discussed.

Disclaimer: This is the diary of a personal trading system, its methodology and the signals that it is producing. You are welcome to follow along but please understand that the information presented here is for educational purposes only. No recommendations are being made to buy, or sell stocks, options or futures contracts. Please consult your own financial advisor before making any investment decisions.


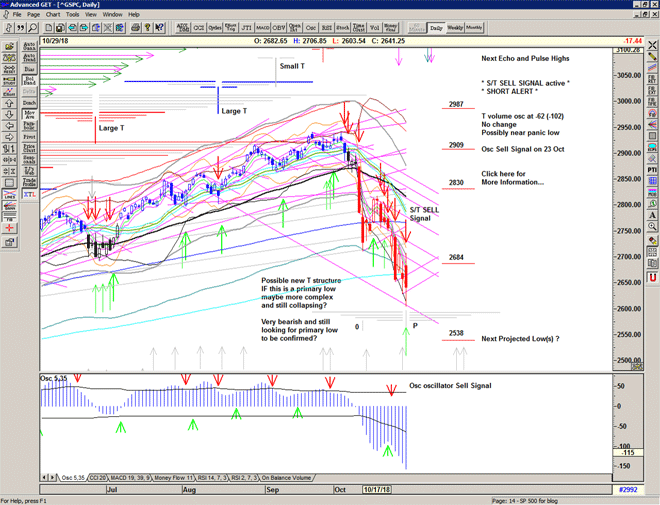
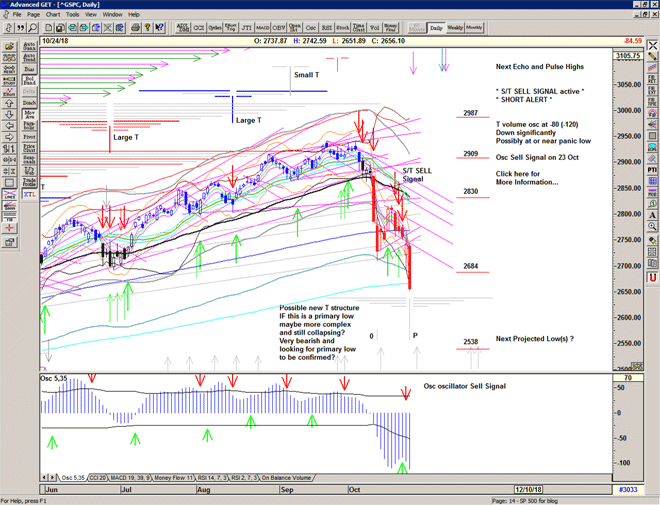
Market closing at 2656

The market continues lower after yesterday's rally with an S/T Sell Signal still active below 2755.

In my pre-market notes I warned of significant downside risk.

For a number of personal reasons I did not issue a specific short entry point today but I did note that the selling was becoming more serious below 2720

The market tried very hard to hold onto the 2700 level but the heavy volatility continued and the last bounce off 2690 collapsed into the close.


Although some bearish targets have now been acheived, the market is now entering levels associated with some kind of potential crash and we should consider this to be a Bear Market for now.


Charter

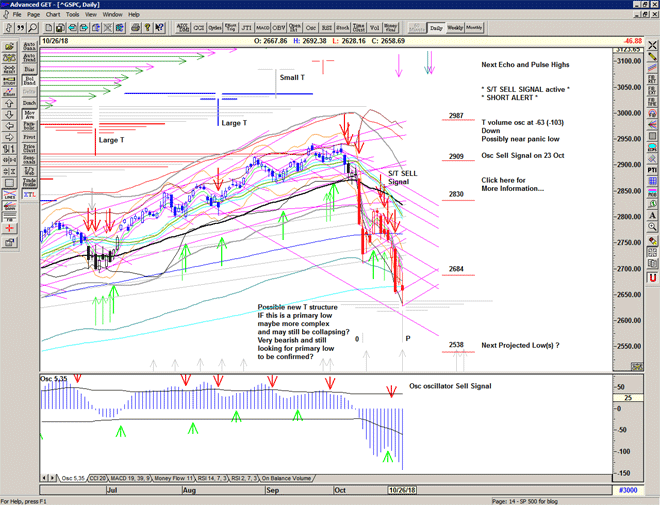
Market opens down huge, breaks lower, tests the lower extreme and initiates a very strong counter trend rally.

IF yesterday's low holds then we have a second low with bullish divergence and a new possible T structure centered on that low. We need to see some follow through above yesterday's high.

IF yesterday was just a reaction to the severely negative opening and the selling continues today (and Futures are indicating that this is likely), then we are still looking for a major low and price will continue lower until the current problem with price is no longer apparent.

Very dangerous market conditions continue. Trade below the 200 day moving average indicates, for now, that the volatility will continue and that we should trade accordingly.

Chart of S&P 500 for 24 October 2018

Be prepared for whatever is coming next, and trade with confidence:

To receive detailed daily analysis, guidance and the updated daily Buy / Sell trigger levels being generated by the Trading the Line system before the market opens, and intraday alerts when appropriate, please become a Member and Sign up for Alerts & Observations – includes access to Members Area and the Explanatory Notes for all of the concepts discussed.

Disclaimer: This is the diary of a personal trading system, its methodology and the signals that it is producing. You are welcome to follow along but please understand that the information presented here is for educational purposes only. No recommendations are being made to buy, or sell stocks, options or futures contracts. Please consult your own financial advisor before making any investment decisions.


Edge Hill

An S/T Sell Signal at 2774 in early trade sees the market down at 2750 before a strong bounce at 'rising support' and a choppy remainder of the day.

Strong bounce and no follow through – Cover at 2760.

An Osc Buy Signal reflecting the 'stabilisation' since the low last week but the severe downtrend remains in place with the market selling into any strength.

Bear Market Warning flashing again, and the weekly trend turns neutral.

The market is currently in trouble and should be treated with extreme caution.

Futures indicate a serious drop at the open and how the market responds will be revealing.

Chart of S&P 500 for 22 October 2018

Be prepared for whatever is coming next, and trade with confidence:

To receive detailed daily analysis, guidance and the updated daily Buy / Sell trigger levels being generated by the Trading the Line system before the market opens, and intraday alerts when appropriate, please become a Member and Sign up for Alerts & Observations – includes access to Members Area and the Explanatory Notes for all of the concepts discussed.

Disclaimer: This is the diary of a personal trading system, its methodology and the signals that it is producing. You are welcome to follow along but please understand that the information presented here is for educational purposes only. No recommendations are being made to buy, or sell stocks, options or futures contracts. Please consult your own financial advisor before making any investment decisions.


Fracture

On Friday, another attempted Buy Signal at 2794 fades quickly and the selling increases, triggering a Sell Signal at 2781. Cover at or prior to the close.

The market continues to be unstable, and bipolar, reversing rapidly and triangulating in the region of the 200 day moving average.

Chart of S&P 500 for 22 October 2018

Be prepared for whatever is coming next, and trade with confidence:

To receive detailed daily analysis, guidance and the updated daily Buy / Sell trigger levels being generated by the Trading the Line system before the market opens, and intraday alerts when appropriate, please become a Member and Sign up for Alerts & Observations – includes access to Members Area and the Explanatory Notes for all of the concepts discussed.

Disclaimer: This is the diary of a personal trading system, its methodology and the signals that it is producing. You are welcome to follow along but please understand that the information presented here is for educational purposes only. No recommendations are being made to buy, or sell stocks, options or futures contracts. Please consult your own financial advisor before making any investment decisions.


Sorrow

Sorrow found me when I was young,
Sorrow waited, sorrow won.
Sorrow that put me on the pills,
It's in my honey it's in my milk.
It's only about half a heart alone
On the water,
Cover me in rag and bones, sympathy.
'Cause I don't wanna get over you.
I don't wanna get over you.

The National, Sorrow, 2010
Songwriters: Aaron B. Dessner / Matthew D. Berninger

The market pulls back to the Buy Signal line at 2790 and makes an attempt to move above 2800.

Strong selling is initiated and the market drops through 2790 triggering a Cover Signal followed quickly by a Sell signal at 2775.

This exemplifies the character of the S/T channel which provided strong support until penetrated and then the market falls away quickly looking for a deeper support level – at the 200 day moving average again.

Yesterday's action also suggests that the current new T structure is more complex and will perhaps morph into a double or triple bottom in due course. This is why we do not simply rely upon projections but allow price action to inform us of what is likely happening next.

Chart of S&P 500 for 19 October 2018

Be prepared for whatever is coming next, and trade with confidence:

To receive detailed daily analysis, guidance and the updated daily Buy / Sell trigger levels being generated by the Trading the Line system before the market opens, and intraday alerts when appropriate, please become a Member and Sign up for Alerts & Observations – includes access to Members Area and the Explanatory Notes for all of the concepts discussed.

Disclaimer: This is the diary of a personal trading system, its methodology and the signals that it is producing. You are welcome to follow along but please understand that the information presented here is for educational purposes only. No recommendations are being made to buy, or sell stocks, options or futures contracts. Please consult your own financial advisor before making any investment decisions.


Lift you up

Oh, when I lift you up
You feel Like a hundred times yourself
I wish everybody knew
What's so great about you
(…)
Jenny, I am in trouble
Can't get these thoughts out of me
Jenny, I'm seeing double
I know this changes everything

The National, This is the Last Time, 2013
Songwriters: Aaron Brooking Dessner / Bryce David Dessner / Matthew D. Berninger

Profit-taking sees the market back at the Buy Signal level for another push at the important 2815 level. The market continues to be volatile and relatively dangerous with rapid reversals and still vulnerable to some strong selling.

Chart of S&P500 for 18 October 2018

Be prepared for whatever is coming next, and trade with confidence:

To receive detailed daily analysis, guidance and the updated daily Buy / Sell trigger levels being generated by the Trading the Line system before the market opens, and intraday alerts when appropriate, please become a Member and Sign up for Alerts & Observations – includes access to Members Area and the Explanatory Notes for all of the concepts discussed.

Disclaimer: This is the diary of a personal trading system, its methodology and the signals that it is producing. You are welcome to follow along but please understand that the information presented here is for educational purposes only. No recommendations are being made to buy, or sell stocks, options or futures contracts. Please consult your own financial advisor before making any investment decisions.


Dominion

The market resolves to the upside with a strong opening at the 200 day moving average, and no looking back, and that, for now, removes the recent Bear Market Warning.

Price moves upwards through 2789 triggering an S/T BUY signal and strength continues into the close in a powerful short covering rally.

The T volume oscillator rises sharply and confirms the prescence of a new T structure centered at the recent low. The oscillator high on 21 September indicates that this structure is likely to be relatively small, and/or that there are further waves down ahead.

Of course, the market is now susceptible to a reaction downwards and may need to re-test the rising lines from the low at some point, as it did in February and March after similar impact lows.

The market is not yet out of the woods, but strength above 2820 would be seen as very positive.

Chart of S&P 500 for 17 October 2018

Be prepared for whatever is coming next, and trade with confidence:

To receive detailed daily analysis, guidance and the updated daily Buy / Sell trigger levels being generated by the Trading the Line system before the market opens, and intraday alerts when appropriate, please become a Member and Sign up for Alerts & Observations – includes access to Members Area and the Explanatory Notes for all of the concepts discussed.

Disclaimer: This is the diary of a personal trading system, its methodology and the signals that it is producing. You are welcome to follow along but please understand that the information presented here is for educational purposes only. No recommendations are being made to buy, or sell stocks, options or futures contracts. Please consult your own financial advisor before making any investment decisions.


Ether

Another choppy volatile day, as the stabilisation at the 200 day moving average continues with strong selling at the highs and into the close.

A dangerous market with a Sell Signal active.

Chart of S&P 500 for 16 October 2018

Be prepared for whatever is coming next, and trade with confidence:

To receive detailed daily analysis, guidance and the updated daily Buy / Sell trigger levels being generated by the Trading the Line system before the market opens, and intraday alerts when appropriate, please become a Member and Sign up for Alerts & Observations – includes access to Members Area and the Explanatory Notes for all of the concepts discussed.

Disclaimer: This is the diary of a personal trading system, its methodology and the signals that it is producing. You are welcome to follow along but please understand that the information presented here is for educational purposes only. No recommendations are being made to buy, or sell stocks, options or futures contracts. Please consult your own financial advisor before making any investment decisions.