Berezina

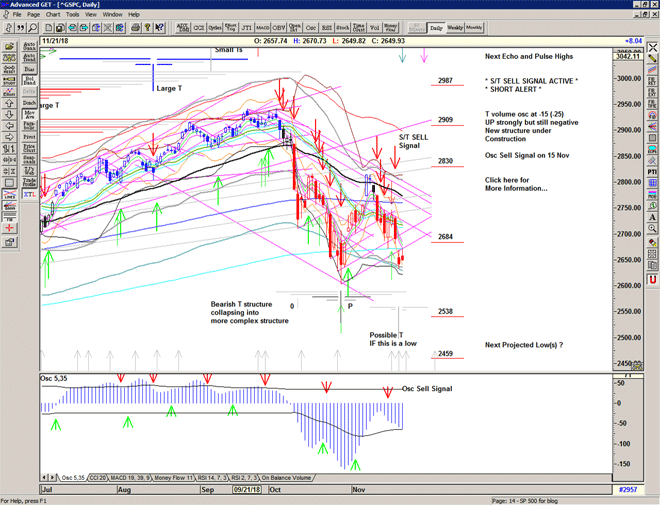
An important week ahead with the market at a critical level.

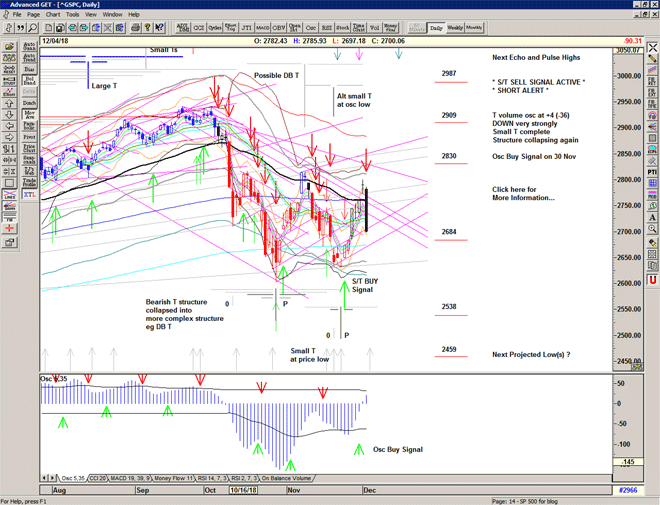
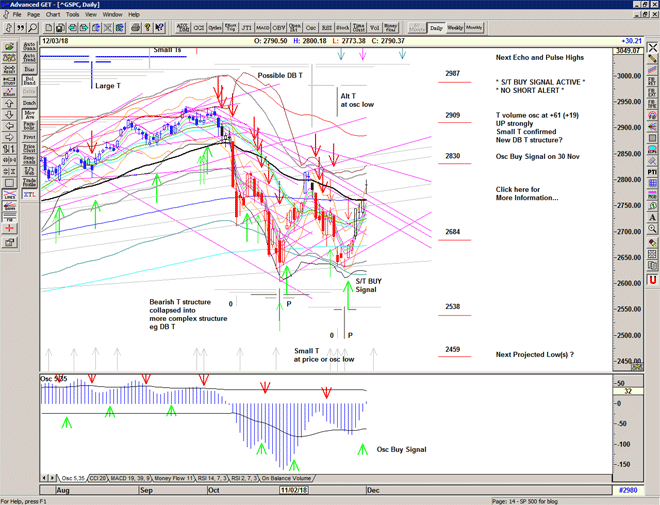
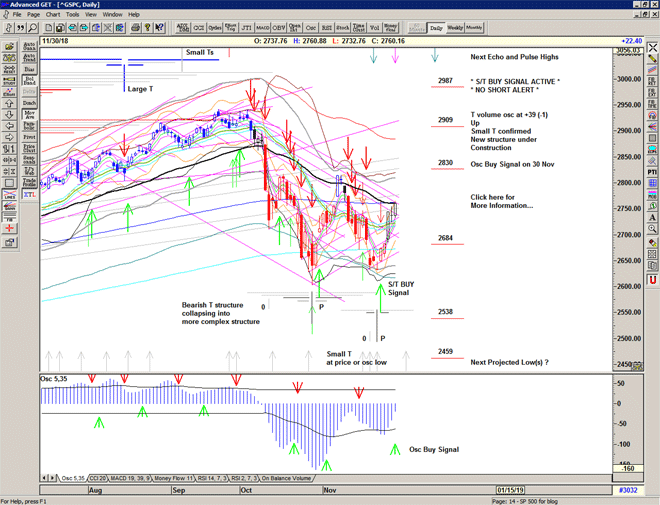
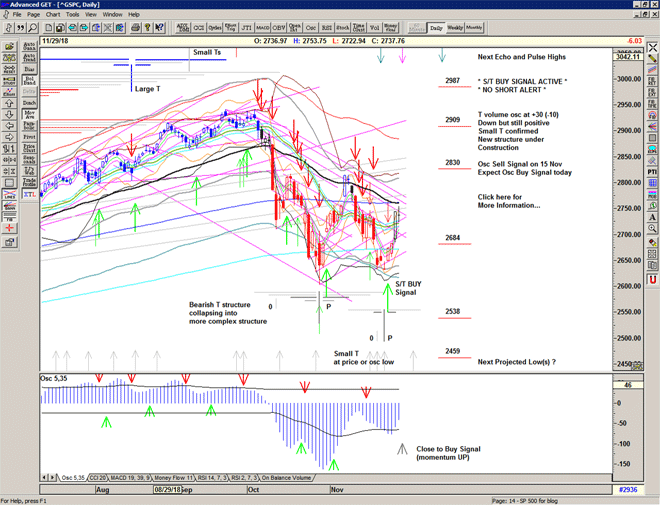
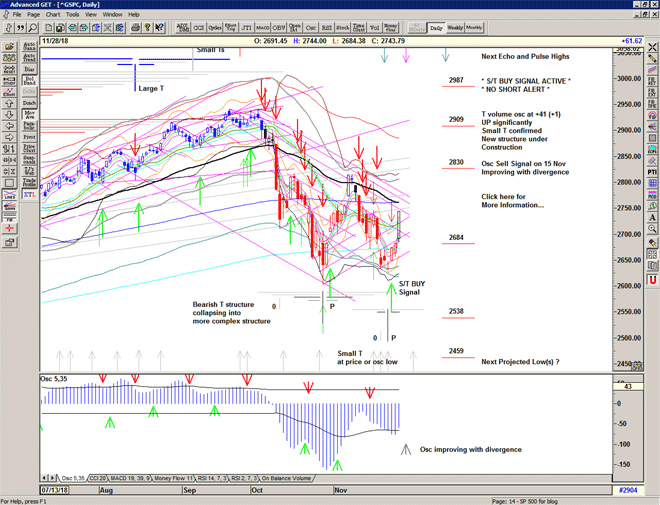
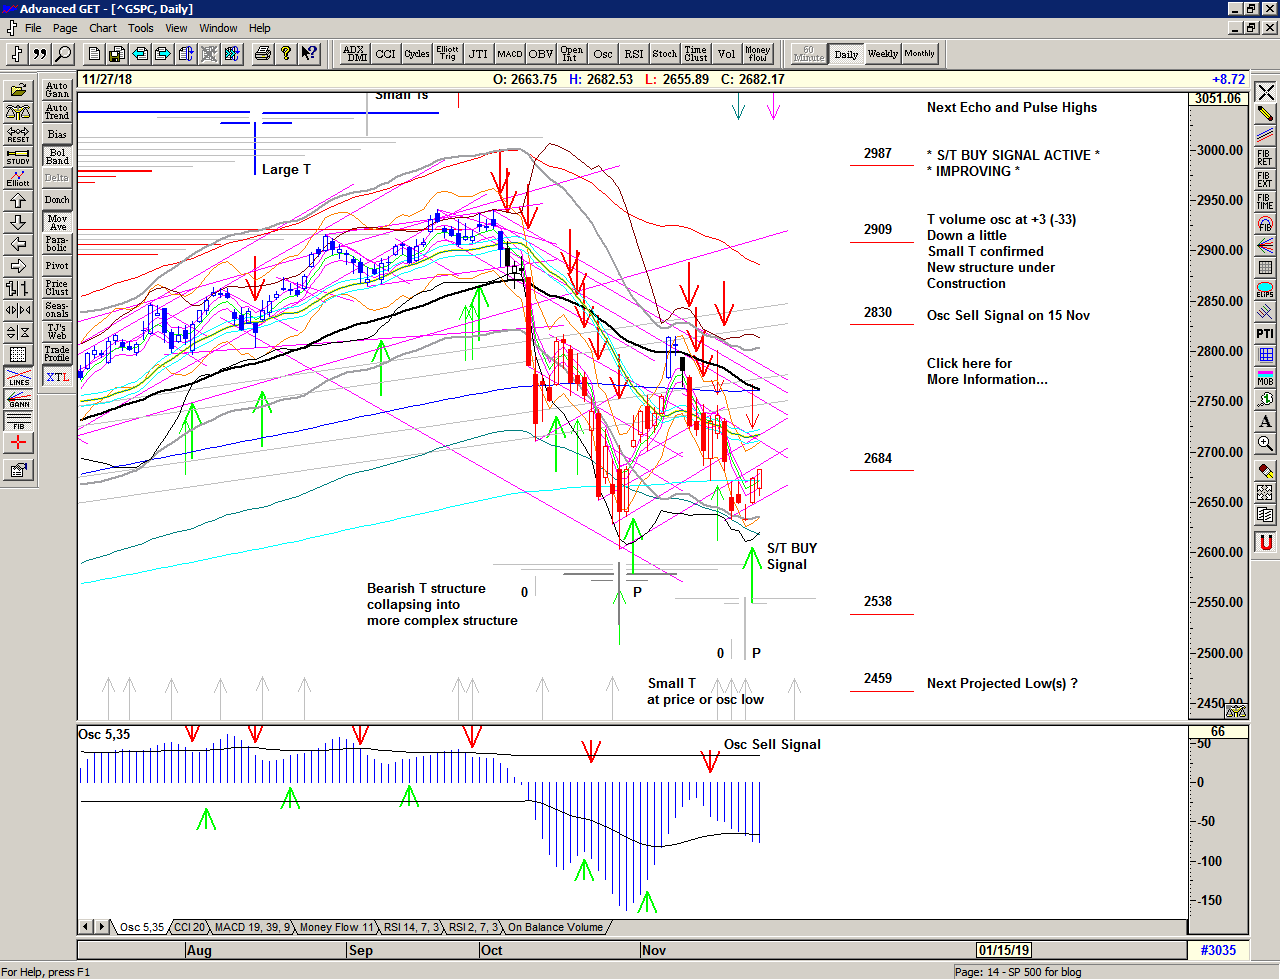
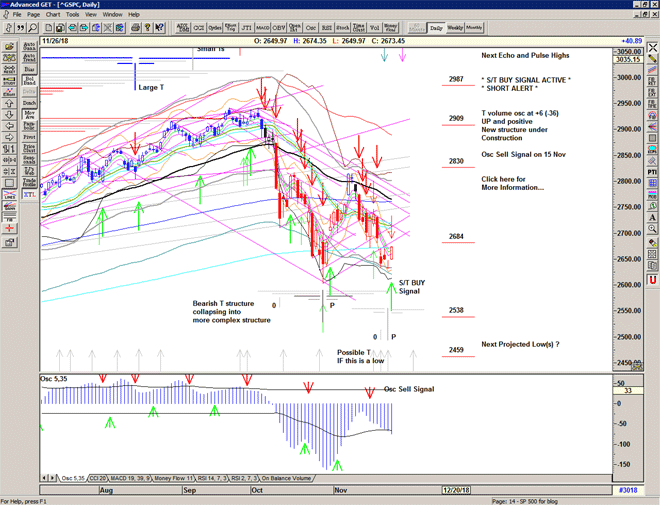
Chart of S&P500 for 26 November 2018

Be prepared for whatever is coming next, and trade with confidence:

To receive detailed daily analysis, guidance and the updated daily Buy / Sell trigger levels being generated by the Trading the Line system before the market opens, and intraday alerts when appropriate, please become a Member and Sign up for Alerts & Observations – includes access to Members Area and the Explanatory Notes for all of the concepts discussed.

Disclaimer: This is the diary of a personal trading system, its methodology and the signals that it is producing. You are welcome to follow along but please understand that the information presented here is for educational purposes only. No recommendations are being made to buy, or sell stocks, options or futures contracts. Please consult your own financial advisor before making any investment decisions.


Turkey Shoot

Some signs of stabilisation as the market re-attempts to climb out of the hole, but succumbing to the late afternoon selling that is now rather characteristic of this market.

Happy Thanksgiving.

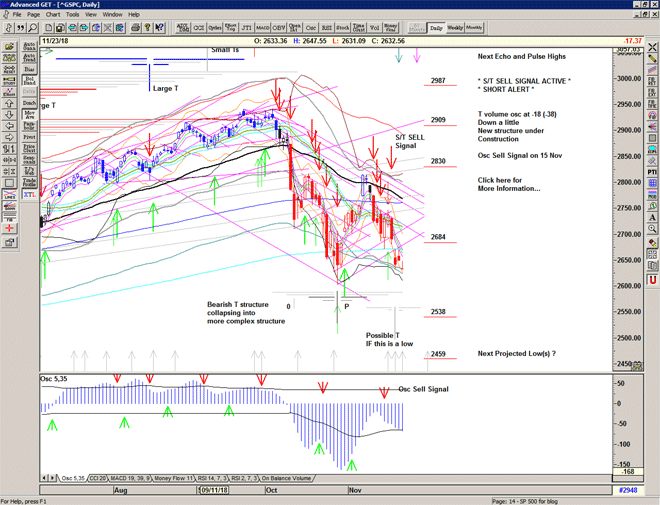
Chart of S&P 500 for 22 November 2018

Be prepared for whatever is coming next, and trade with confidence:

To receive detailed daily analysis, guidance and the updated daily Buy / Sell trigger levels being generated by the Trading the Line system before the market opens, and intraday alerts when appropriate, please become a Member and Sign up for Alerts & Observations – includes access to Members Area and the Explanatory Notes for all of the concepts discussed.

Disclaimer: This is the diary of a personal trading system, its methodology and the signals that it is producing. You are welcome to follow along but please understand that the information presented here is for educational purposes only. No recommendations are being made to buy, or sell stocks, options or futures contracts. Please consult your own financial advisor before making any investment decisions.

Na Fola

And it's true we are immune
When fact is fiction and TV reality
And today the millions cry
We eat and drink while tomorrow they die
the real battle just begun
(Sunday, Bloody Sunday)

U2, Sunday Bloody Sunday, 1983

The market slips, badly, and takes another look at the lower extreme and at levels last seen on 29 October, leaving an ominous large gap.

This area can be considered to be a major pivot and therefore potentially a line in the quick sand as it has provided (very) strong support in the past, BUT with the caveat that once breached opens Pandora's Box to significantly lower prices because it will act as a pivot. As above there is below. The 2015 and 2016 lows were a good example of this pivot in action.

Chart of S&P 500 for 21 November 2018

Be prepared for whatever is coming next, and trade with confidence:

To receive detailed daily analysis, guidance and the updated daily Buy / Sell trigger levels being generated by the Trading the Line system before the market opens, and intraday alerts when appropriate, please become a Member and Sign up for Alerts & Observations – includes access to Members Area and the Explanatory Notes for all of the concepts discussed.

Disclaimer: This is the diary of a personal trading system, its methodology and the signals that it is producing. You are welcome to follow along but please understand that the information presented here is for educational purposes only. No recommendations are being made to buy, or sell stocks, options or futures contracts. Please consult your own financial advisor before making any investment decisions.


Essex

A weak open and the market quickly drops below the Sell Signal level at 2720 with a strong linear move down into the area of recent support around 2684.

Bearish market behaviour continues with selling from a failed Buy Signal.

Chart of S&P 500 for 20 November 2018

Be prepared for whatever is coming next, and trade with confidence:

To receive detailed daily analysis, guidance and the updated daily Buy / Sell trigger levels being generated by the Trading the Line system before the market opens, and intraday alerts when appropriate, please become a Member and Sign up for Alerts & Observations – includes access to Members Area and the Explanatory Notes for all of the concepts discussed.

Disclaimer: This is the diary of a personal trading system, its methodology and the signals that it is producing. You are welcome to follow along but please understand that the information presented here is for educational purposes only. No recommendations are being made to buy, or sell stocks, options or futures contracts. Please consult your own financial advisor before making any investment decisions.

Prestige

A choppy generally bullish day with the market swinging from Sell Signal level to Buy Signal level as it absorbs the recent price recovery from 2675.

Expect more volatile chop as the market looks to recover further and continues to look at declining resistance lines.

T volume oscillator turns positive, just, but the outlook continues to look somewhat bearish.

Chart of S&P 500 for 19 November 2018

Be prepared for whatever is coming next, and trade with confidence:

To receive detailed daily analysis, guidance and the updated daily Buy / Sell trigger levels being generated by the Trading the Line system before the market opens, and intraday alerts when appropriate, please become a Member and Sign up for Alerts & Observations – includes access to Members Area and the Explanatory Notes for all of the concepts discussed.

Disclaimer: This is the diary of a personal trading system, its methodology and the signals that it is producing. You are welcome to follow along but please understand that the information presented here is for educational purposes only. No recommendations are being made to buy, or sell stocks, options or futures contracts. Please consult your own financial advisor before making any investment decisions.


Cajamarca

The market takes a look at 2675 and responds with a very strong recovery rally into the close.

Back in the confluence of support and resistance and above here would indicate a more significant recovery.

T volume oscillator back at zero (an inflection point) and the Osc oscillator makes a Sell Signal (admittedly a lagging indicator).

Support found at the important pivot but the market remains bearish and unstable and further work may be required to turn this thing around.

Chart of S&P 500 for 16 November 2018
 

Be prepared for whatever is coming next, and trade with confidence:

To receive detailed daily analysis, guidance and the updated daily Buy / Sell trigger levels being generated by the Trading the Line system before the market opens, and intraday alerts when appropriate, please become a Member and Sign up for Alerts & Observations – includes access to Members Area and the Explanatory Notes for all of the concepts discussed.

Disclaimer: This is the diary of a personal trading system, its methodology and the signals that it is producing. You are welcome to follow along but please understand that the information presented here is for educational purposes only. No recommendations are being made to buy, or sell stocks, options or futures contracts. Please consult your own financial advisor before making any investment decisions.


Black Cat

The market re-runs the script with a move higher sold heavily through the S/T Sell Signal line at 2729 into another deep low at 2685.

High levels of realised volatility continue to impact as rapid advances are sold back into, in characteristic bear market action.

The current T structure is collapsing into a more complex structure with some potential projections for lows coming into focus in the days ahead.

As with the late October low, the market needs to close at or near to the highs of the day prior to any serious attempt to move higher again.

An unstable and dangerous market that is at a level acheived for the first time just over a year ago. The potential for further downside is still huge.

Chart of S&P 500 for 15 November 2018

Be prepared for whatever is coming next, and trade with confidence:

To receive detailed daily analysis, guidance and the updated daily Buy / Sell trigger levels being generated by the Trading the Line system before the market opens, and intraday alerts when appropriate, please become a Member and Sign up for Alerts & Observations – includes access to Members Area and the Explanatory Notes for all of the concepts discussed.

Disclaimer: This is the diary of a personal trading system, its methodology and the signals that it is producing. You are welcome to follow along but please understand that the information presented here is for educational purposes only. No recommendations are being made to buy, or sell stocks, options or futures contracts. Please consult your own financial advisor before making any investment decisions.


Moby

“There are certain queer times and occasions in this strange mixed affair we call life when a man takes this whole universe for a vast practical joke, though the wit thereof he but dimly discerns, and more than suspects that the joke is at nobody's expense but his own.”

Herman Melville, Moby-Dick, 1851

Continued pressure on price despite an attempt to move higher.

An early Sell Signal is not successful but the selling resumes from the high at 2754 as the market bleeds lower in characteristic bear market action.

Chart of S&P500 for 14 November 2018

Be prepared for whatever is coming next, and trade with confidence:

To receive detailed daily analysis, guidance and the updated daily Buy / Sell trigger levels being generated by the Trading the Line system before the market opens, and intraday alerts when appropriate, please become a Member and Sign up for Alerts & Observations – includes access to Members Area and the Explanatory Notes for all of the concepts discussed.

Disclaimer: This is the diary of a personal trading system, its methodology and the signals that it is producing. You are welcome to follow along but please understand that the information presented here is for educational purposes only. No recommendations are being made to buy, or sell stocks, options or futures contracts. Please consult your own financial advisor before making any investment decisions.


St Brice

No follow through to Friday's recovery and the market drops rapidly triggering a cover signal at 2770.

Heavy selling finds the market looking for support at the Mid-channel, triggering an S/T Sell Signal below 2735 which is initially unsuccessful.

Failure at 2750 in erratic late afternoon action triggers another Sell Signal at 2735 as the market declines into the close. As usual cover short positions overnight.

Failure to recover from 2770 results in another Bear Market Warning.

Chart of S&P 500 for 13 November 2018

Be prepared for whatever is coming next, and trade with confidence:

To receive detailed daily analysis, guidance and the updated daily Buy / Sell trigger levels being generated by the Trading the Line system before the market opens, and intraday alerts when appropriate, please become a Member and Sign up for Alerts & Observations – includes access to Members Area and the Explanatory Notes for all of the concepts discussed.

Disclaimer: This is the diary of a personal trading system, its methodology and the signals that it is producing. You are welcome to follow along but please understand that the information presented here is for educational purposes only. No recommendations are being made to buy, or sell stocks, options or futures contracts. Please consult your own financial advisor before making any investment decisions.


Repeal

Weakness after the echo high and the 08 November projection for a high triggers some heavy selling and a probe below the important 2770 level before a buying surge into the close.

Declining resistance from the high is still active and this will likely produce some triangulisation in price whilst the market absorbs the recent bounce from 2600 and a decision is made for higher prices or a re-test of the primary low.

Chart of S&P 500 for 12 November 2018

Be prepared for whatever is coming next, and trade with confidence:

To receive detailed daily analysis, guidance and the updated daily Buy / Sell trigger levels being generated by the Trading the Line system before the market opens, and intraday alerts when appropriate, please become a Member and Sign up for Alerts & Observations – includes access to Members Area and the Explanatory Notes for all of the concepts discussed.

Disclaimer: This is the diary of a personal trading system, its methodology and the signals that it is producing. You are welcome to follow along but please understand that the information presented here is for educational purposes only. No recommendations are being made to buy, or sell stocks, options or futures contracts. Please consult your own financial advisor before making any investment decisions.