1859

Flatlining most of the day around 1859 – admittedly close to today's 1860 Buy signal level – but really needs to see a strong close 1862+  to commit to the Buy signal.

1. The oscillator will most likely make a sell signal tomorrow
2. Diagonal resistance at 1872 today, 1870 tomorrow needs to be cleared

Mixed signals, understandable given the perceived risk to global markets.

Falling Knives

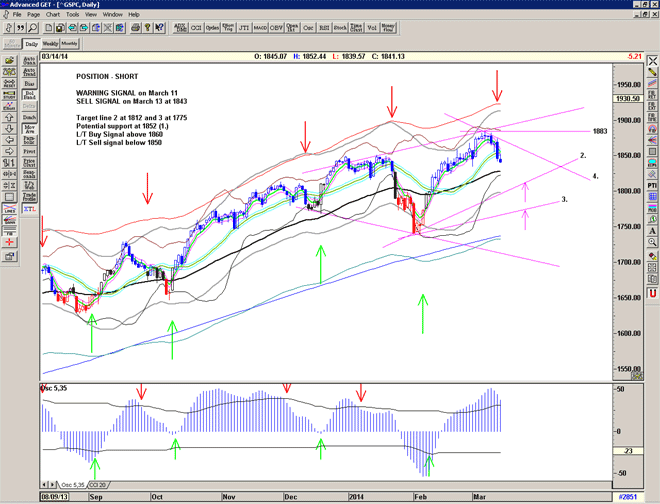
Bounce on friday failed albeit only slightly, confirming the sell signal.

Watch the action at the 55 day ema now at 1828 as this can be a key pivot level.

A close above 1860 on monday would cancel the Sell Signal.

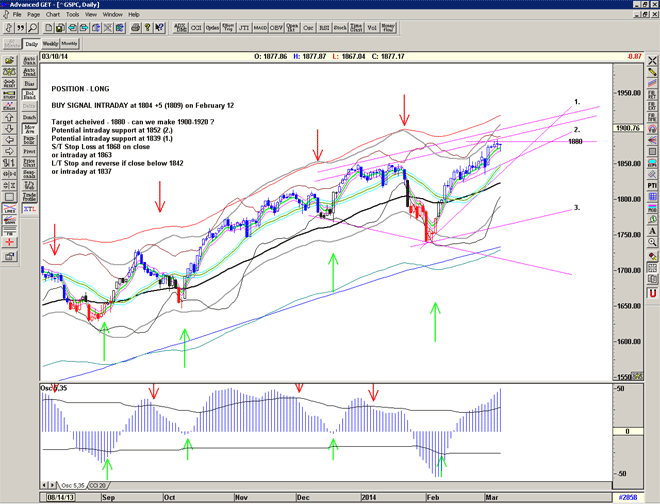
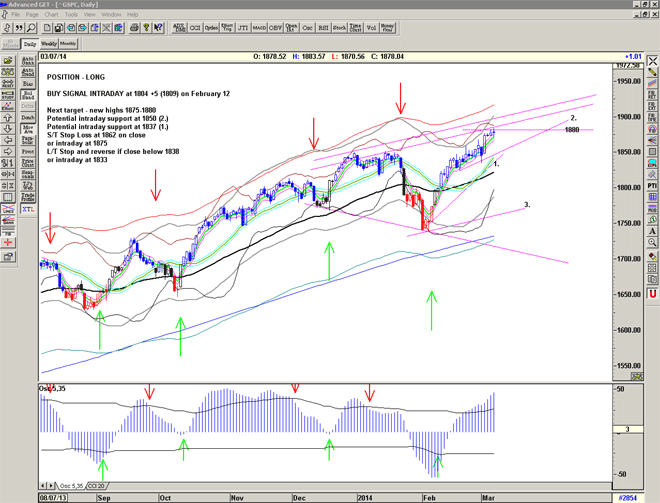
chart for S&P500 for monday 17 March 2014

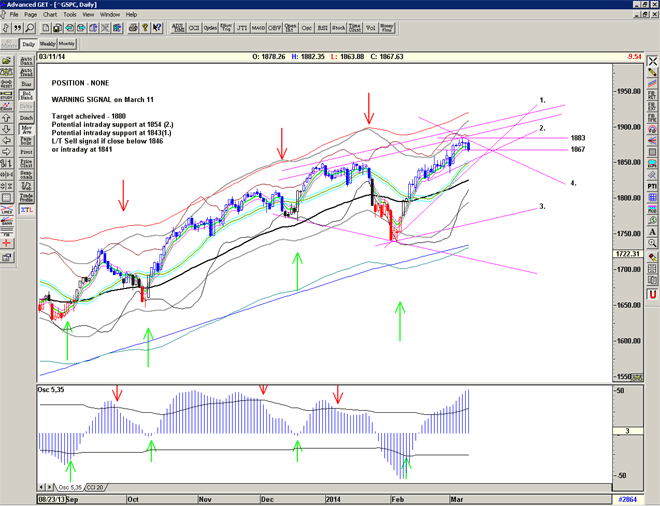
Beware the Ides of March

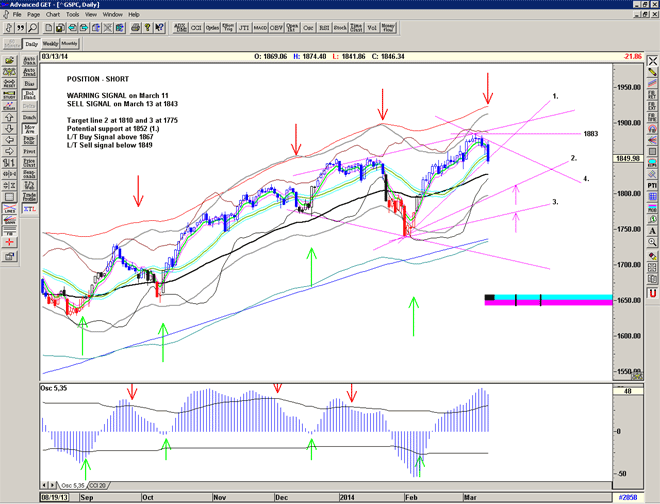
A strong sell signal yesterday creating quite a negative picture. I had expected a few more days of congestion in the 1870-1880 area, so my pre-market call yesterday after the recovery on wednesday was way off.

Unless we see a rapid recovery from here – a move above 1867 is a Buy signal – then we are now set up for a move down to 1810 or even 1775 towards the end of March as indicated by the MOB.

Tomorrow is the Ides of March – watch out for falling knives.

S&P500 chart for 14 march 2014


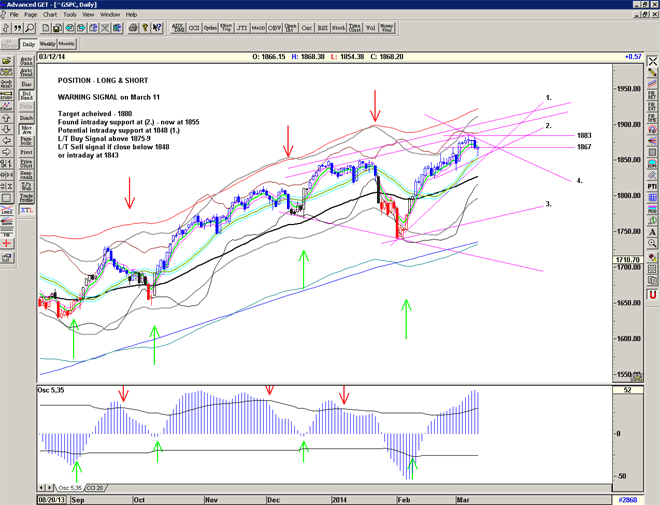
10 point spike down

An interesting probe down and found support in the vicinity of line 2. Potentially a bullish signal.

Stuck between 1855 and 1882 and may need some time to resolve direction.

Changing position to LONG and SHORT at the open unless futures indicate a drop of more than 10 points (currently +3).

S&P500 chart for 13 March 2014