A little bit more Fed

So the Fed did manage to lift the spirits of the market. A little.

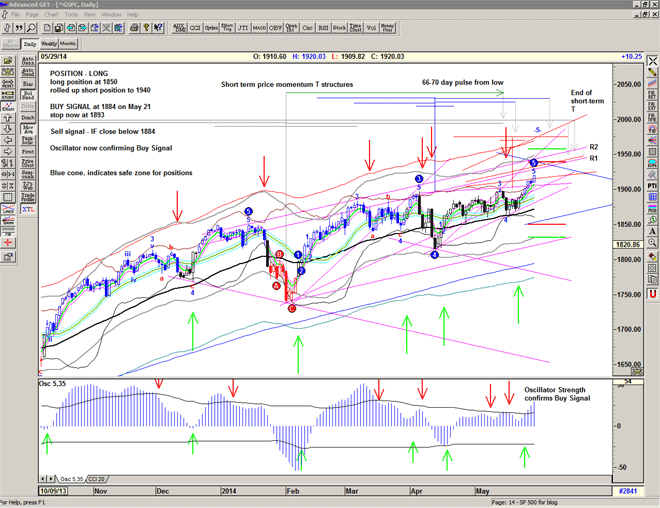
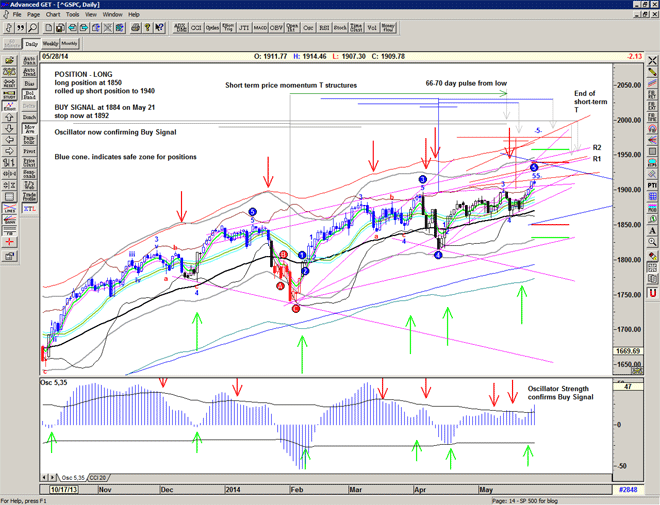
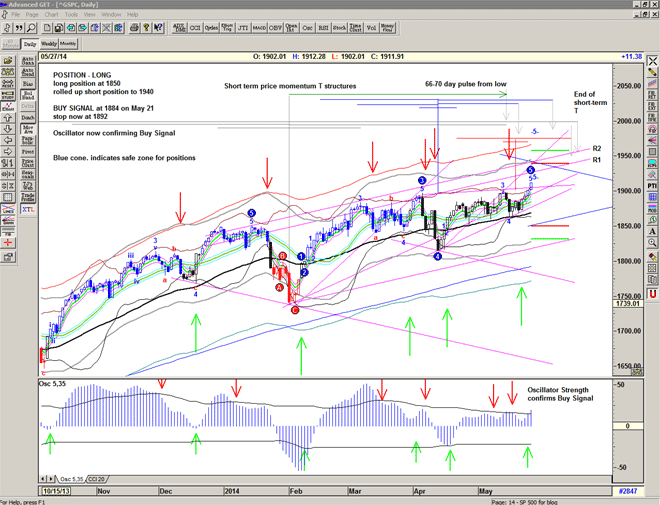
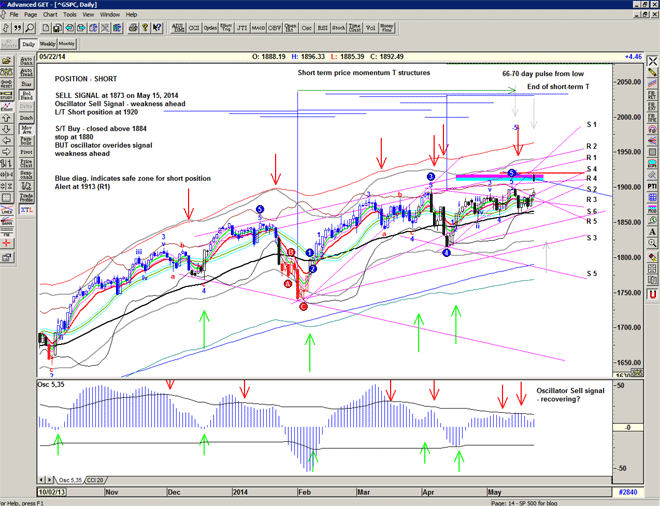
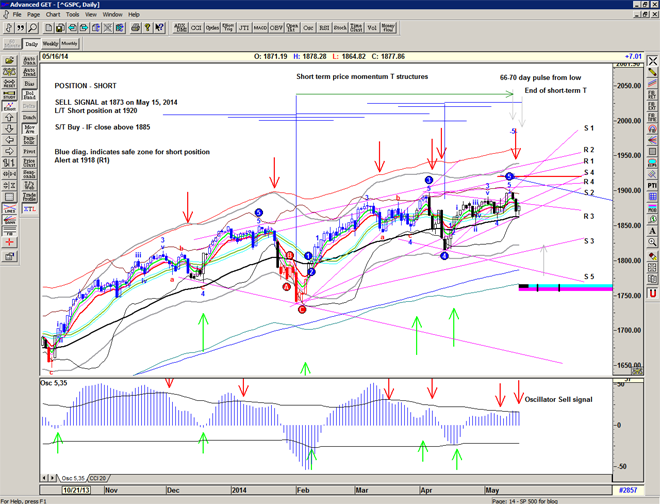
We reached the end of the recent T structure, and we may still struggle getting much beyond 1900

However the oscillator appears to be in recovery mode, and it doesn't seem like anything will knock this market down. A drop is therefore probably imminent.

IF we can get thru 1910 then we will need to hedge the short position.

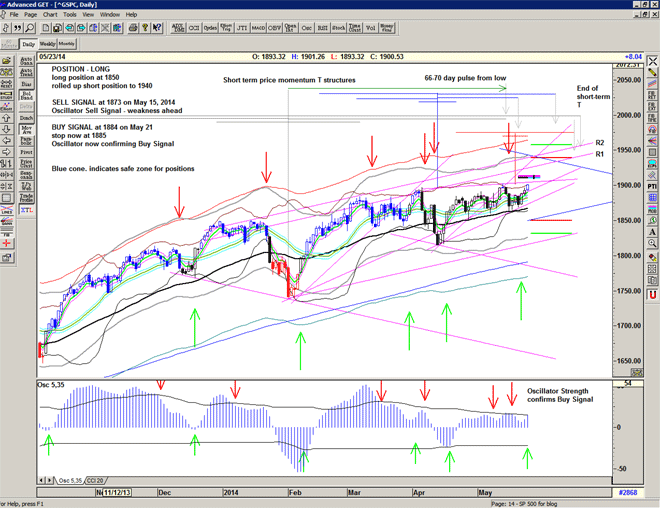
Chart of S&P500 for May 23, 2014

Quantative squeezing ?

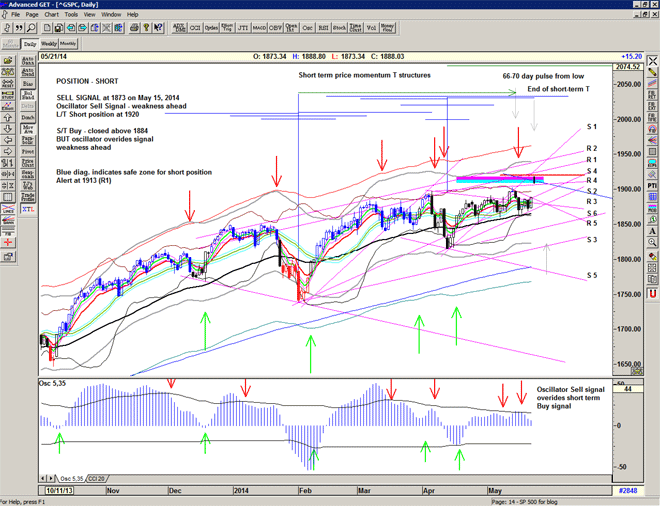
A curious day, and a short term buy signal with a close above 1884. The current oscillator weakness overides this signal but keep a close eye on its development.

I have also revised the short-term price momentum T structure to allow for the peak from 4th March and so that indicates a high today, and it looks like there may be a second high ~6th June from the 14th February momentum peak.

Chart of S&P500 for 22 May 2014

fedspeak or fedsqueak?

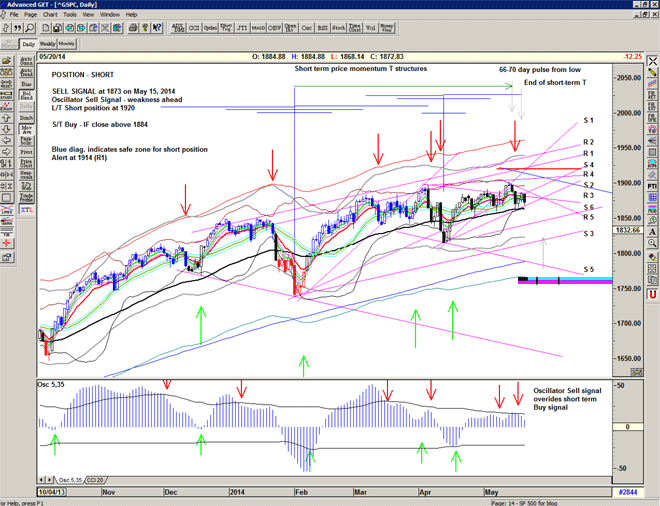
Yesterday's action confirms the Short signal with a close below 1879 and the dropping oscillator.

Today we get to see if the Fed can massage the markets again. The squeeze is on and the signal is Short, but anything can happen in manipulated markets and a 'pop' up to 1910 isn't out of the question.

If we break support line S2, and then the 56 day ema (at 1864), then I would expect a sell off to S3, perhaps even S5.

Chart of S&P500 for 21 May 2014

weakness ahead

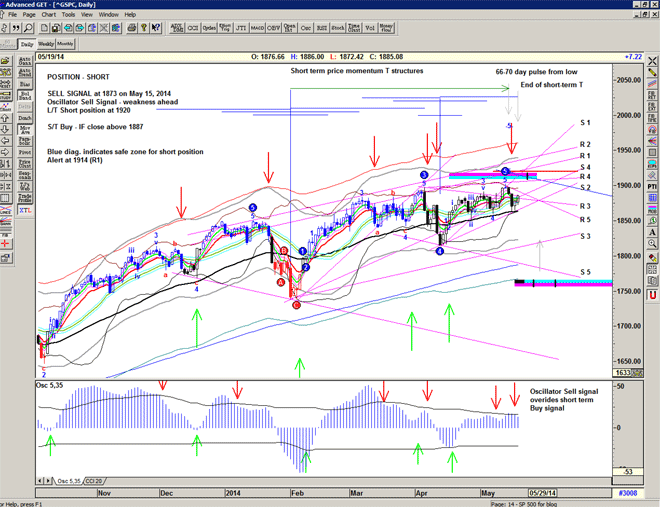
Very close to a Short term Buy Signal yesterday but note that the oscillator is slipping and that this overides the potential Buy Signal. We may still get a 'pop' up to say 1910 but I beleive this is a market ready for a sell off.

The current short term price momentum T structure should end today or next few days depending upon where you start the T from.

Chart of S&P500 for 20 May 2014

time to sell

As we are right at the end of the recent price momentum T structure, and the oscillator is starting to slip back below the breakout band, today or tomorrow should provide a better short entry.

A subsequent move below support line S2 will confirm the Short signal.

If on the other hand we get a burst higher then we have significant resistance in the 1910 area.

Chart of S&P500 for 19 May 2014

squeeze

Price has acheived its short-term target – GET wave 5 low PTI
Squeeze occurring
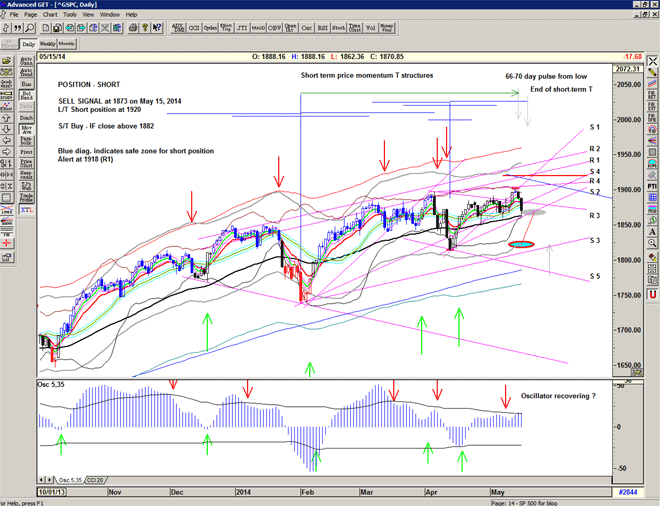
CCI sell signal – confirmation required
Oscillator recovered ? and potentially bullish – watch carefully next days to see if confirms the sell signal

Target for next low 1820 – end of May / first week of June

Chart of S&P500 for 15 May 2014


interesting times

It looks like the recent up move may be over (or nearly over) and we are preparing for a large move as indicated by tightening of the bollinger bands

– double top acheived
– low PTI wave 5 in advanced get – probable double top
– close to end of recent short-term price momentum T structure
– vix at lower bollinger band indicating complacency and cheap put options

Keeping an open mind – wait to see if we get a signal from CCI etc.

Chart of S&P500 for 14 May 2014


New Highs

Short term Buy Signal yesterday with the break upwards. Looks like a move to say 1915-1920. (19 May)

With the oscillator recovering, it is of course possible that this may be the beginning of an extended upwards move. Initially see if we can get thru the long-term resistance angles R1/R2 at 1930-1940.

Chart of the S&P500 for 13 May 2014