labor of love

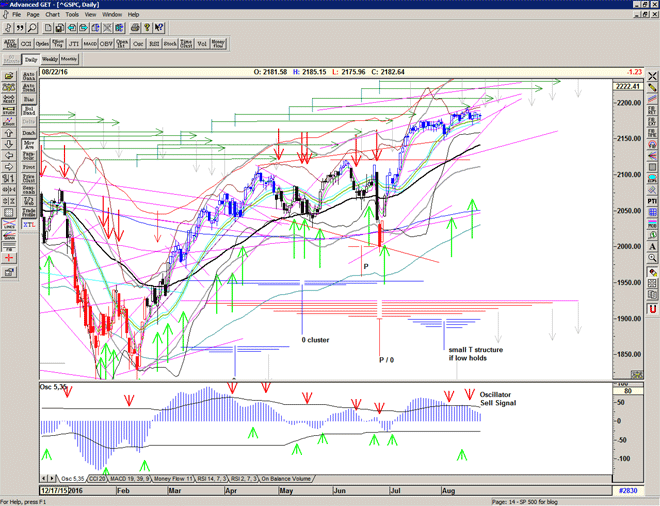
Pop and drop but didn't fail on the day.

Covered Short position at 2182, and potentially back on a Buy Signal with the recovery into the close above 2178.
Just wanted to see a bit more above the descending channel to confirm.

Not completely convincing due to underkiss of rising Gann line at 2084, but a possible small cluster T structure pointing to cycle high on the 8-9 September.

Chart of S&P500 for 05 September 2016

For more detailed analysis, please Sign up for Alerts & Observations

Disclaimer: This is the diary of a personal trading system, its methodology and the signals that it is producing. You are welcome to follow along but please understand that the information presented here is for educational & entertainment purposes only. No recommendations are being made to buy, or sell stocks, options or futures contracts. Please consult your own financial advisor before making any investment decisions.


Without borders or boundaries

Neo: I know you're out there. I can feel you now. I know that you're afraid… you're afraid of us. You're afraid of change. I don't know the future. I didn't come here to tell you how this is going to end. I came here to tell you how it's going to begin. I'm going to hang up this phone, and then I'm going to show these people what you don't want them to see. I'm going to show them a world without you. A world without rules and controls, without borders or boundaries. A world where anything is possible. Where we go from there is a choice I leave to you. (The Matrix – 1999)

Market remains on a Sell Signal, for now, and looks like marking out a descending channel, targetting support at 2145.
Finding support below the tightening bollingers, which are becoming extremely tight.
Strength above that channel would indicate a change in direction.

Chart of S&P500 for 02 September 2016

For more detailed analysis, please Sign up for Alerts & Observations

Disclaimer: This is the diary of a personal trading system, its methodology and the signals that it is producing. You are welcome to follow along but please understand that the information presented here is for educational & entertainment purposes only. No recommendations are being made to buy, or sell stocks, options or futures contracts. Please consult your own financial advisor before making any investment decisions.


Short into September

Yesterday's action produced a cover and short Signal at 2165, as it broke down through the important rising Gann line from the June 27 low. This line will probably become a resistance line for future moves up.

The lower bollinger held the day, and we saw a sort of recovery trying to cling onto the 2171 level.

Starting to build a downward sloping resistance line above the recent highs, so a break above those will change the picture somewhat.

Chart of S&P500 for 1 September 2016

For more detailed analysis, please Sign up for Alerts & Observations

Disclaimer: This is the diary of a personal trading system, its methodology and the signals that it is producing. You are welcome to follow along but please understand that the information presented here is for educational & entertainment purposes only. No recommendations are being made to buy, or sell stocks, options or futures contracts. Please consult your own financial advisor before making any investment decisions.


Waiting

"All things come to those who wait"

Time running out on a major arm of the red T structure – today / tomorrow –

and another tight bollinger squeeze preparing the market for a volatile start to September…

Chart of S&P500 for 31 August 2016

For more detailed analysis, please Sign up for Alerts & Observations

Disclaimer: This is the diary of a personal trading system, its methodology and the signals that it is producing. You are welcome to follow along but please understand that the information presented here is for educational & entertainment purposes only. No recommendations are being made to buy, or sell stocks, options or futures contracts. Please consult your own financial advisor before making any investment decisions.

S/T Buy at 2180

A short-term Buy Signal cancelling out Friday's Sell Signal and the T volume oscillator appears to have made a higher low and set up the possibility of a small T – if price holds up above the recent low at 2160.

Chart of S&P500 for 30 August 2016

For more detailed analysis, please Sign up for Alerts & Observations

Disclaimer: This is the diary of a personal trading system, its methodology and the signals that it is producing. You are welcome to follow along but please understand that the information presented here is for educational & entertainment purposes only. No recommendations are being made to buy, or sell stocks, options or futures contracts. Please consult your own financial advisor before making any investment decisions.


Down the rabbit hole, and back again?

A Buy Signal at 2184, and cancelled out with the drop below 2175.

A Sell Signal at 2165, but found support at the bollinger 2160 yesterday.

Trying to cling onto support… more volatilty ahead…

Chart of S&P500 for 29 August 2016

For more detailed analysis, please Sign up for Alerts & Observations

Disclaimer: This is the diary of a personal trading system, its methodology and the signals that it is producing. You are welcome to follow along but please understand that the information presented here is for educational & entertainment purposes only. No recommendations are being made to buy, or sell stocks, options or futures contracts. Please consult your own financial advisor before making any investment decisions.


Down the rabbit hole

“But I don’t want to go among mad people," Alice remarked.
"Oh, you can’t help that," said the Cat: "we’re all mad here. I’m mad. You’re mad."
"How do you know I’m mad?" said Alice.
"You must be," said the Cat, "or you wouldn’t have come here.”

― Lewis Carroll, Alice in Wonderland

Market holds support at 2169 whilst waiting for Janet's speech at Jackson Hole. I wonder just what 'Alice' will have to say.

Now we will find out whether the market has been correcting internally before pushing on to new highs; or getting ready for a nose-dive.

Chart of S&P500 for 26 August 2016

For more detailed analysis, please Sign up for Alerts & Observations

Disclaimer: This is the diary of a personal trading system, its methodology and the signals that it is producing. You are welcome to follow along but please understand that the information presented here is for educational & entertainment purposes only. No recommendations are being made to buy, or sell stocks, options or futures contracts. Please consult your own financial advisor before making any investment decisions.


Cover at 2175

Cover Signal at 2075 with the failure of the rising wedge and the break down through 2078.
Looks like the market is ready to rollover with perhaps one last try at the high.

Strong initial rising support just below at about 2167 today…

Chart of S&P500 for 25 August 2016

For more detailed analysis, please Sign up for Alerts & Observations

Disclaimer: This is the diary of a personal trading system, its methodology and the signals that it is producing. You are welcome to follow along but please understand that the information presented here is for educational & entertainment purposes only. No recommendations are being made to buy, or sell stocks, options or futures contracts. Please consult your own financial advisor before making any investment decisions.


Still with the groove

Still with the groove.
Small pop to 2193 as the market finds itself near the end of the arm of the red T structure from April 28.

Chart of S&P500 for 24 August 2016


For more detailed analysis, please Sign up for Alerts & Observations

Disclaimer: This is the diary of a personal trading system, its methodology and the signals that it is producing. You are welcome to follow along but please understand that the information presented here is for educational & entertainment purposes only. No recommendations are being made to buy, or sell stocks, options or futures contracts. Please consult your own financial advisor before making any investment decisions.

Waiting for Jackson

Market continues to hold up above the mid-channel in the tight trading range of the rising wedge.

We should expect some choppy days ahead, with perhaps several 'false' signals before a strong directional move.

Chart of S&P500 for 23 August 2016

For more detailed analysis, please Sign up for Alerts & Observations

Disclaimer: This is the diary of a personal trading system, its methodology and the signals that it is producing. You are welcome to follow along but please understand that the information presented here is for educational & entertainment purposes only. No recommendations are being made to buy, or sell stocks, options or futures contracts. Please consult your own financial advisor before making any investment decisions.