Tolerance

"Laws alone can not secure freedom of expression; in order that every man present his views without penalty there must be spirit of tolerance in the entire population." – Albert Einstein

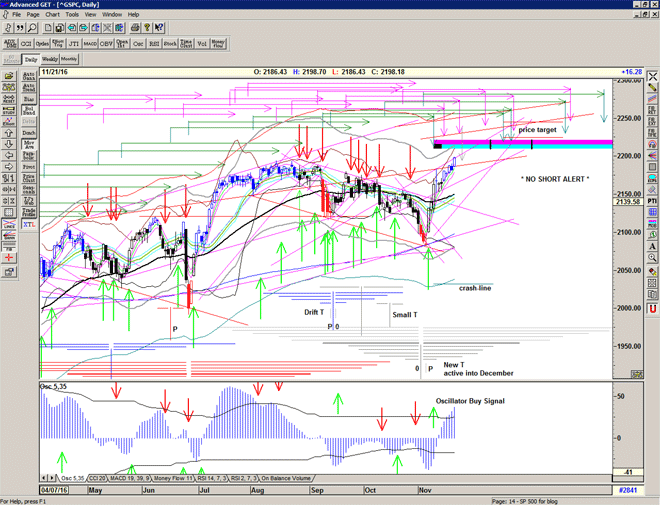
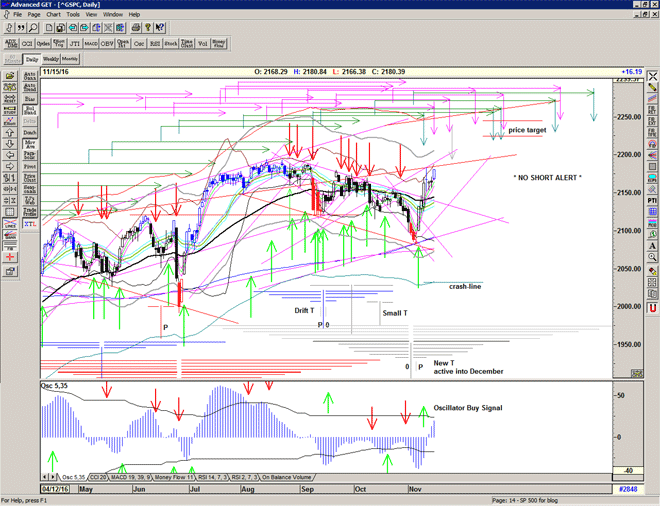
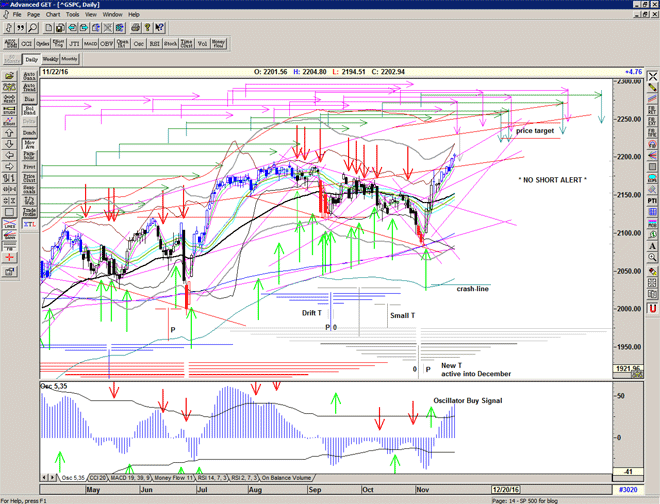
Market continues to look very strong, T volume oscillator at 72, Osc very strong, above all of the important averages and holding the steep angle on a par with the Brexit rally. I have indicated a tentative price target of 2225-2245 for this move, which is a fibonacci projection from the thrust.

Chart of S&P 500 for 16 November 2016

To receive further analysis, more clarity and the updated daily Buy / Sell levels being generated by the system before the market opens, please Sign up for Alerts & Observations

Disclaimer: This is the diary of a personal trading system, its methodology and the signals that it is producing. You are welcome to follow along but please understand that the information presented here is for educational & entertainment purposes only. No recommendations are being made to buy, or sell stocks, options or futures contracts. Please consult your own financial advisor before making any investment decisions.


re-cycling

reduce, re-use and re-cycle

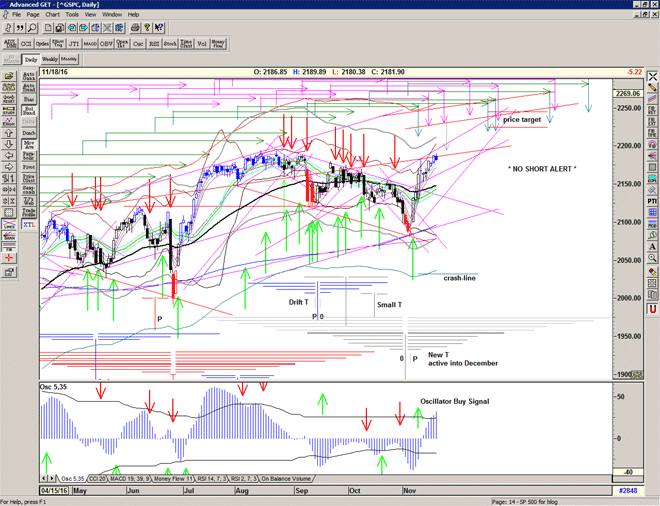
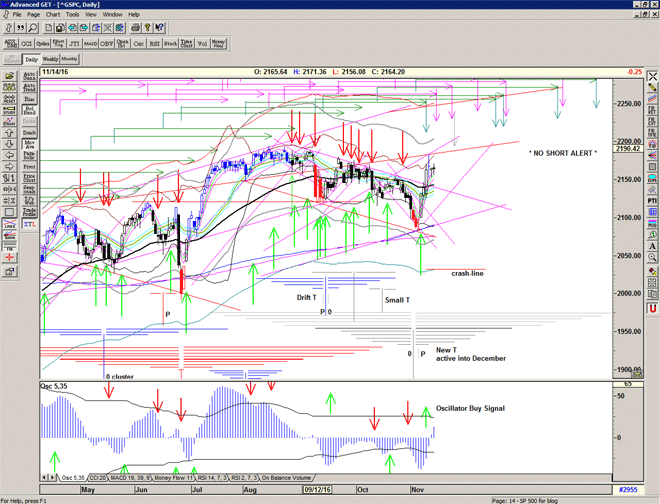
The market starting to coil in anticipation of the next move, presumably into November expiration on Friday.

Just getting through the short-term echo high but holding above all of the averages.

A quick drop down to the 55 ema at 2143 would make sense here, but not guarranteed – just enough to get everyone positioned bearishly prior to expiration. Significant open interest at 2150 could be a magnet and if things get ugly a larger magnet at 2120.

Chart of S&P 500 for 15 November 2016

To receive further analysis, more clarity and the updated daily Buy / Sell levels being generated by the system before the market opens, please Sign up for Alerts & Observations

Disclaimer: This is the diary of a personal trading system, its methodology and the signals that it is producing. You are welcome to follow along but please understand that the information presented here is for educational & entertainment purposes only. No recommendations are being made to buy, or sell stocks, options or futures contracts. Please consult your own financial advisor before making any investment decisions.


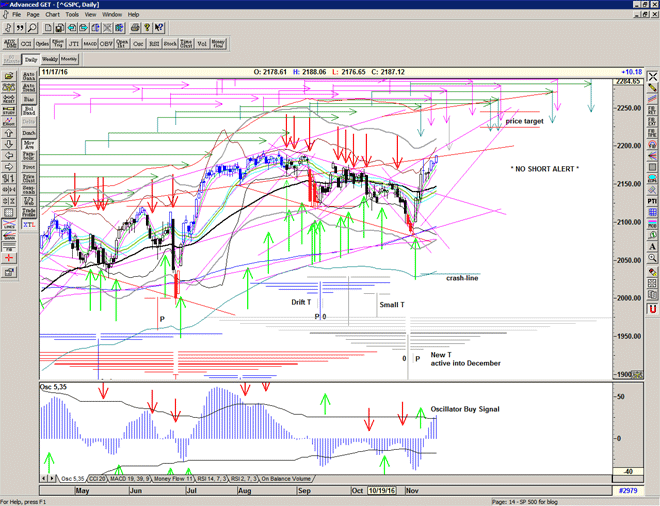
Echo Low and new T Structure

In the last report I discussed the likelihood of an Echo Low associated with the very large double bottom T structure of January-February 2016 to occur prior to or coinciding with the Election, and I think we can now be sure to say that it has occurred.

Chart of S&P500 for 13 November 2016

Double Bottoms and Echo Lows

Terry Laundry suggested that a double bottom resolves into one large T structure with the 2 major lows combining forces. We place the centre-post or vertical line of the T half-way between the 2 lows, and then draw the left-hand side of the T from the price peak to the centre-post, and this projects the end of the T.

We can see this clearly in the first double bottom of late August- September 2015.

Terry Laundry also pointed out that if you draw the T from the second low this will often project a price low instead of a peak – an Echo Low. (Marked in gray).

Echo Low prior to the Election and a Buy Signal

On 2 November I advised my subscribers that we were close to a bounce, and advised very short term bullish below the Buy Signal level.

On 7 November the market gap-opened above the Buy Signal level indicating the confirmed change of direction and long entry above 2104.

On 8 November I advised protecting the long position with a hedge in case of an adverse reaction to the election.

This significant move up has now confirmed the prescence of a new large T Structure with highs projected for Christmas and New Year and additional 'highs' in January and February.

This is why I use price to confirm the signals and not opinion. Price will get you into the market and ensure that you are not trading against it for very long.

Be prepared.

For more detailed analysis and ongoing analysis of the developments in the S&P500 index on a daily basis, please Sign up for daily Alerts & Observations

 

Supermoon

Technically a ‘perigee full moon’, the phenomenon occurs when a full moon coincides with the moon being the closest it gets to the Earth on its orbit – and 13-14 November 2016 full moon will be the biggest and brightest in 60 years.

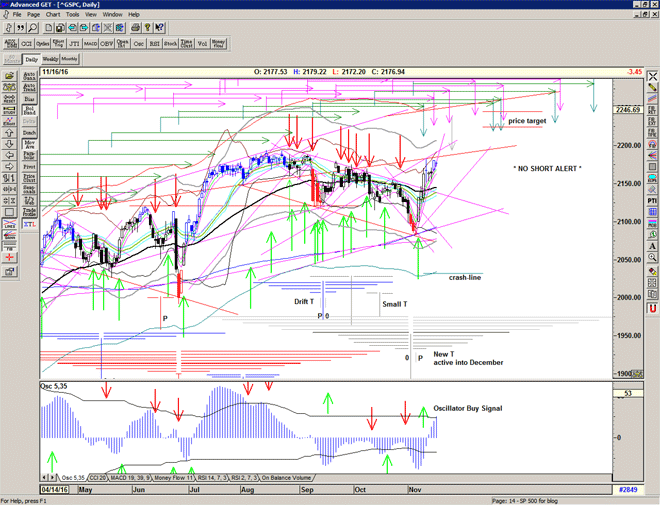
So far the market is holding up and working off its overbought character, with a nice push back up into the weekend.

And looking for an Echo high to occur monday or tuesday.
After that, its possible we need to challenge the 55 ema in a more decisive way.

I have re-drawn the new T structure back one day centre-ing on the oscillator low (0) which was 2 days prior to the price low, and this would explain the sharp selloff from 2182 on thursday.

Chart of S&P500 for 14 November 2016

To receive further analysis and updated daily Buy / Sell levels being generated by the system before the market opens, please Sign up for Alerts & Observations

Disclaimer: This is the diary of a personal trading system, its methodology and the signals that it is producing. You are welcome to follow along but please understand that the information presented here is for educational & entertainment purposes only. No recommendations are being made to buy, or sell stocks, options or futures contracts. Please consult your own financial advisor before making any investment decisions.


Veterans

“Never give in — never, never, never, never, in nothing great or small, large or petty, never give in except to convictions of honor and good sense. Never yield to force; never yield to the apparently overwhelming might of the enemy.” – Winston Churchill

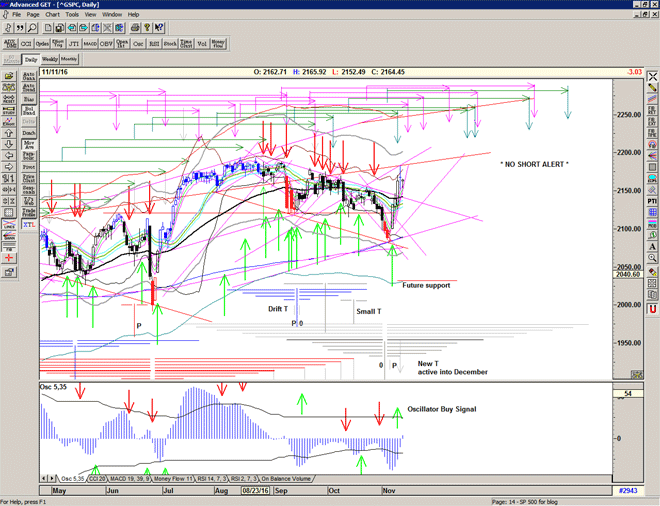
Something for everyone yesterday.

It would seem that above the upper bollinger was too much for the market and it quickly sold off from the very short term target of 2180 at the rising Gann line – previous support / now resistance.

Still room for the market to move higher

I have moved the new T structure back one day as the oscillator low was 2 days prior to the price low and this projects the first major target for monday coincidentally just prior to a scheduled Echo peak high. A similar situation occurred after Brexit when the market tested the averages briefly and then resolved to the upside.

Chart of S&P500 for 11 November 2016

To receive further analysis and updated daily Buy / Sell levels being generated by the system before the market opens, please Sign up for Alerts & Observations

Disclaimer: This is the diary of a personal trading system, its methodology and the signals that it is producing. You are welcome to follow along but please understand that the information presented here is for educational & entertainment purposes only. No recommendations are being made to buy, or sell stocks, options or futures contracts. Please consult your own financial advisor before making any investment decisions.


Yes Sir, please Sir!

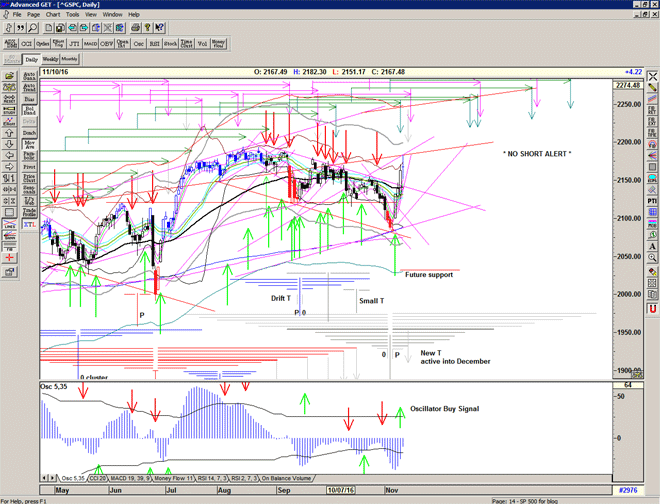
The market makes a very significant move up as a huge amount of out of the money puts are urgently cashed in, showing that in contrast to the Brexit vote the Trump challenge was well hedged by the major players.

It also shows that the uncertainty of the Election was what was holding the market back. It is after all, a BULL market and will continue to be so until further notice.

A new and very powerful looking T structure emerges with the major projection for the next major peaks from at least the 9 September collapse, and possibly the all time high.

Risk On.

Chart of S&P500 for 10 November 2016

To receive further analysis and updated daily Buy / Sell levels being generated by the system before the market opens, please Sign up for Alerts & Observations

Disclaimer: This is the diary of a personal trading system, its methodology and the signals that it is producing. You are welcome to follow along but please understand that the information presented here is for educational & entertainment purposes only. No recommendations are being made to buy, or sell stocks, options or futures contracts. Please consult your own financial advisor before making any investment decisions.


No Panic, Sir!

As I advised this morning prior to the open:

Panic – what panic?

At the moment it is starting to look like the Futures may have seriously over-cooked the panic, and it looks like we will open above 2100.

The Sell trigger level yesterday was 2114, but if we take into account the overnight plunge we can lower that level to 2112.

Afterall we now have some clarity on the future. Looks like no reason to panic.

Fantastic move today. I can't imagine that anyone really expected to see the market 20 points up, especially after seeing the market about 70 points down when Hillary conceeded to Donald, as I had breakfast this morning.

Coming up to the upper Bollinger and that seems to be holding us back at the moment and needs pushing up, but importantly we broke through that dreadful descending line, with tremendous force.

The Osc 5,35 makes a Buy Signal and the T volume oscillator in the 30s looking very strong and activating larger sections of the new T structure.

We may need to re-test the important 55 ema but it does look like further gains into mid November for starters followed by a rally into Christmas.

Enjoy your slice of Trump pie!


Trump Tower

On Election day the market noses into the resistance line at 2144, and stops to wait for the result.

We had a short term cycle/pulse high scheduled for 8-9 November which suggested that the market might sell the news at least temporarily.

Oops, futures down very hard on the news of Donald Trump's successful night, triggering a SELL Signal, but have recovered significantly showing that the market was well protected. Initially E-minis bounced at 2028 which corresponds to about 2032 on the S&P500 index – the lower extreme boundary – fine green line on my charts. Keep an eye on that level for future reference as it is now major support and the market may need to go have a look-see at some point.

Watch to see if the previous low at 2083 holds, or not, as the market digests the news and traders re-position. Very large open option positions at 2050 and 2000 may be initial magnets and strong support but the unloading of these positions could also be the tail-wind for a strong recovery. (ie Sell the News and Buy the recovery)

Chart of S&P500 for 09 November 2016

To receive further analysis and updated daily Buy / Sell levels being generated by the system before the market opens, please Sign up for Alerts & Observations

Disclaimer: This is the diary of a personal trading system, its methodology and the signals that it is producing. You are welcome to follow along but please understand that the information presented here is for educational & entertainment purposes only. No recommendations are being made to buy, or sell stocks, options or futures contracts. Please consult your own financial advisor before making any investment decisions.


Just politics

Putting aside the fact that America goes to the polls today.
It is what it is and it doesn't really matter who wins, not in the long run. Sadly, not really.

The market makes a BUY Signal and activates a new small T projecting a first peak on the 16th.
At the moment it looks like a thrust, and if we compare it with BrExit we could be looking at a rally into 2250 (a future long term target).

First we have a short term cycle/pulse high scheduled for 9 November and a another high scheduled for 15 November.

If we can break through the obvious descending resistance line, further arms of the new T will become activated projecting a series of highs in December and even January.

In the meantime we have an election to navigate through and of course it is entirely possible that the market is unhappy with the result.
Take care and hedge accordingly because there will be a lot of orders to fill below the market.

Chart of S&P500 for 08 November 2016

To receive further analysis and updated daily Buy / Sell levels being generated by the system before the market opens, please Sign up for Alerts & Observations

Disclaimer: This is the diary of a personal trading system, its methodology and the signals that it is producing. You are welcome to follow along but please understand that the information presented here is for educational & entertainment purposes only. No recommendations are being made to buy, or sell stocks, options or futures contracts. Please consult your own financial advisor before making any investment decisions.


S/T BUY Signal at the open

Sometimes the market bounces and fails and then the real bounce starts the next day, with avengeance.

The market roars its approval of Hillary and breezes through resistance and up into the mid-channel area.

A new small T is activated, and we can see that if this breaks through the downward sloping resistance, we have the possibility for a larger T structure and a rally into Christmas and the New Year.

Its just politics, stupid