Methven

Another gap down finds buyers at 2762 and the market holds up above the Buy Signal line into the close.

Still marking out the upper range.

Futures are down significantly this morning indicating another challenge to the current Buy Signal with the market now looking for support at the Mid-channel.

Chart of S&P 500 for 19 June 2018

Be prepared for whatever is coming next, and trade with confidence:

To receive detailed daily analysis, guidance and the updated daily Buy / Sell trigger levels being generated by the Trading the Line system before the market opens, and intraday alerts when appropriate, please become a Member and Sign up for Alerts & Observations – includes access to Members Area and the Explanatory Notes for all of the concepts discussed.

Disclaimer: This is the diary of a personal trading system, its methodology and the signals that it is producing. You are welcome to follow along but please understand that the information presented here is for educational purposes only. No recommendations are being made to buy, or sell stocks, options or futures contracts. Please consult your own financial advisor before making any investment decisions.


Civitate

A gap down and challenge to the recent rise is contained at 2762, and the Buy Signal remains active with a strong bounce off rising trend-lines.

The T volume oscillator turns negative in response to the weakness as the market continues to back away from the recent high revealing some declining resistance to be overcome.

Chart of S&P 500 for 18 June 2018

Be prepared for whatever is coming next, and trade with confidence:

To receive detailed daily analysis, guidance and the updated daily Buy / Sell trigger levels being generated by the Trading the Line system before the market opens, and intraday alerts when appropriate, please become a Member and Sign up for Alerts & Observations – includes access to Members Area and the Explanatory Notes for all of the concepts discussed.

Disclaimer: This is the diary of a personal trading system, its methodology and the signals that it is producing. You are welcome to follow along but please understand that the information presented here is for educational purposes only. No recommendations are being made to buy, or sell stocks, options or futures contracts. Please consult your own financial advisor before making any investment decisions.

Vulcan

The market continues to grind below the recent highs and oscillators turn neutral.

A move upwards through the recent highs would signal a continuation of the advance in-line with the next series of projections. A break below rising support would signal further probes to the downside.

Still establishing an upper range, and profit-taking since the projection for the recent highs.

Chart of S&P 500 for 15 June 2018

Be prepared for whatever is coming next, and trade with confidence:

To receive detailed daily analysis, guidance and the updated daily Buy / Sell trigger levels being generated by the Trading the Line system before the market opens, and intraday alerts when appropriate, please become a Member and Sign up for Alerts & Observations – includes access to Members Area and the Explanatory Notes for all of the concepts discussed.

Disclaimer: This is the diary of a personal trading system, its methodology and the signals that it is producing. You are welcome to follow along but please understand that the information presented here is for educational purposes only. No recommendations are being made to buy, or sell stocks, options or futures contracts. Please consult your own financial advisor before making any investment decisions.


Marengo

Another visit to 2790 is sold into and further selling related to the FED announcement sees an initial strong bounce at 2780 which is also sold into.

Still above the Buy Signal line but the T volume oscillator turns neutral.

Chart of S&P 500 for 14 June 2018

Be prepared for whatever is coming next, and trade with confidence:

To receive detailed daily analysis, guidance and the updated daily Buy / Sell trigger levels being generated by the Trading the Line system before the market opens, and intraday alerts when appropriate, please become a Member and Sign up for Alerts & Observations – includes access to Members Area and the Explanatory Notes for all of the concepts discussed.

Disclaimer: This is the diary of a personal trading system, its methodology and the signals that it is producing. You are welcome to follow along but please understand that the information presented here is for educational purposes only. No recommendations are being made to buy, or sell stocks, options or futures contracts. Please consult your own financial advisor before making any investment decisions.


Milan

Another attempt at 2790 as the market begins to define its new range.

Some warning signs flashing.

Chart of S&P 500 for 13 June 2018

Be prepared for whatever is coming next, and trade with confidence:

To receive detailed daily analysis, guidance and the updated daily Buy / Sell trigger levels being generated by the Trading the Line system before the market opens, and intraday alerts when appropriate, please become a Member and Sign up for Alerts & Observations – includes access to Members Area and the Explanatory Notes for all of the concepts discussed.

Disclaimer: This is the diary of a personal trading system, its methodology and the signals that it is producing. You are welcome to follow along but please understand that the information presented here is for educational purposes only. No recommendations are being made to buy, or sell stocks, options or futures contracts. Please consult your own financial advisor before making any investment decisions.


Namorados

Nor from mine own weak merits will I draw
The smallest fear or doubt of her revolt,
For she had eyes and chose me. No, Iago,
I’ll see before I doubt, when I doubt, prove,
And on the proof there is no more but this:
Away at once with love or jealousy!

William Shakespeare, Othello, c. 1603

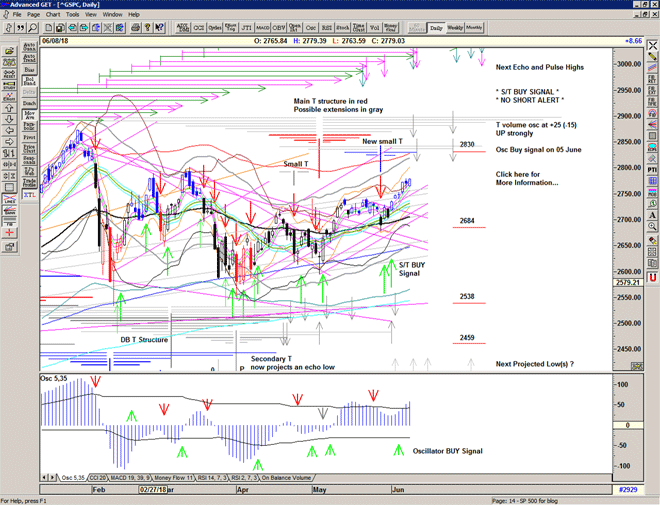
A push up into 2790 is rejected as traders look back at the March high.

Yesterday was a pulse high and today we have an echo high and a projection for a high from the new small T structure.

Momentum and breadth continue to look strong.

Chart of S&P 500 for 12 June 2018

Be prepared for whatever is coming next, and trade with confidence:

To receive detailed daily analysis, guidance and the updated daily Buy / Sell trigger levels being generated by the Trading the Line system before the market opens, and intraday alerts when appropriate, please become a Member and Sign up for Alerts & Observations – includes access to Members Area and the Explanatory Notes for all of the concepts discussed.

Disclaimer: This is the diary of a personal trading system, its methodology and the signals that it is producing. You are welcome to follow along but please understand that the information presented here is for educational purposes only. No recommendations are being made to buy, or sell stocks, options or futures contracts. Please consult your own financial advisor before making any investment decisions.


Aragon

The market shrugs off the early morning weakness and closes the week at the recent highs.

Still on a Buy Signal and moving into the next series of projected highs.

Chart of S&P 500 for 10 June 2018

Be prepared for whatever is coming next, and trade with confidence:

To receive detailed daily analysis, guidance and the updated daily Buy / Sell trigger levels being generated by the Trading the Line system before the market opens, and intraday alerts when appropriate, please become a Member and Sign up for Alerts & Observations – includes access to Members Area and the Explanatory Notes for all of the concepts discussed.

Disclaimer: This is the diary of a personal trading system, its methodology and the signals that it is producing. You are welcome to follow along but please understand that the information presented here is for educational purposes only. No recommendations are being made to buy, or sell stocks, options or futures contracts. Please consult your own financial advisor before making any investment decisions.


Oceans

Another gap higher and a probe to 2760 is held near the highs.

The market may now need to establish itself within the new higher range, testing the break upwards from 2740 prior to establishing whether it can indeed proceed higher.

Chart of S&P 500 for 08 June 2018

Be prepared for whatever is coming next, and trade with confidence:

To receive detailed daily analysis, guidance and the updated daily Buy / Sell trigger levels being generated by the Trading the Line system before the market opens, and intraday alerts when appropriate, please become a Member and Sign up for Alerts & Observations – includes access to Members Area and the Explanatory Notes for all of the concepts discussed.

Disclaimer: This is the diary of a personal trading system, its methodology and the signals that it is producing. You are welcome to follow along but please understand that the information presented here is for educational purposes only. No recommendations are being made to buy, or sell stocks, options or futures contracts. Please consult your own financial advisor before making any investment decisions.


Resolution

Another gap up, a pullback to 2750 and the market rips higher, breaking out above its recent range.

The T volume oscillator finally turns positive and now fully supports the new small T activating additional projections.

Chart of S&P 500 for 07 June 2018

Be prepared for whatever is coming next, and trade with confidence:

To receive detailed daily analysis, guidance and the updated daily Buy / Sell trigger levels being generated by the Trading the Line system before the market opens, and intraday alerts when appropriate, please become a Member and Sign up for Alerts & Observations – includes access to Members Area and the Explanatory Notes for all of the concepts discussed.

Disclaimer: This is the diary of a personal trading system, its methodology and the signals that it is producing. You are welcome to follow along but please understand that the information presented here is for educational purposes only. No recommendations are being made to buy, or sell stocks, options or futures contracts. Please consult your own financial advisor before making any investment decisions.