Perpetua

Esto Perpetua
(May she live forever)

Paolo Sarpi, 1623

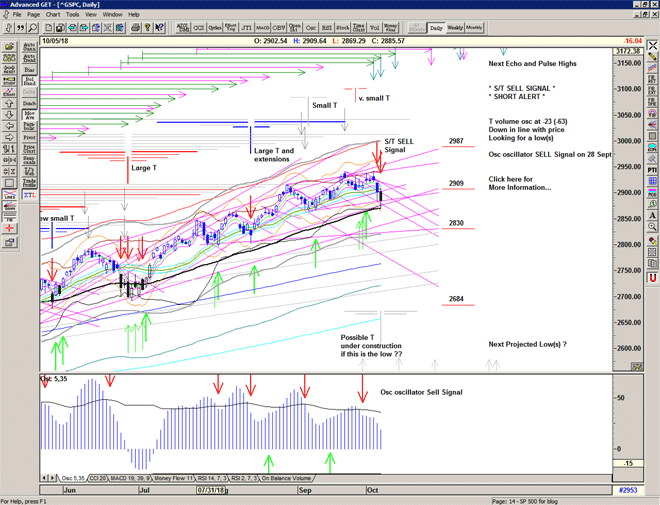
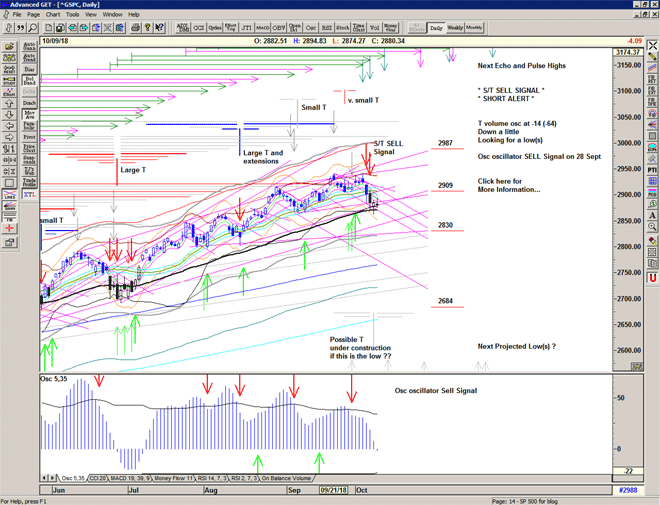
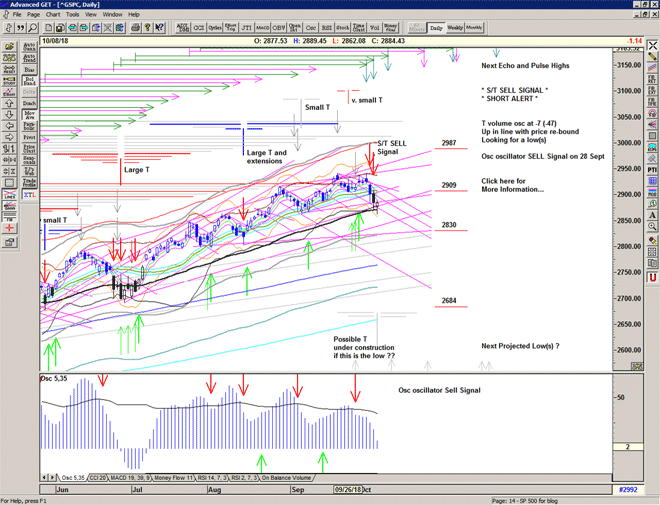
Selling initiated at the high on Wednesday continues triggering a cover signal at 2914 and an S/T SELL signal at 2900.

Strong buying at 2885 initiated a recovery to 2900 and in effect cancelling the Sell Signal, for now. The Mid-channel (pale blue band) providing strong initial support.

Two possibilities:

Either, yesterday was a one-day sell off and the market will now resume its grind higher. In which case we should see a close back above the S/T channel. (eg 15 August)

Or, yesterday is the beginning of a period of weakness as the market probes lower and builds a support platform. In which case the S/T channel continues to decline and provides ongoing resistance to advances until a low is in place. (eg 25 June)

Of course we cannot know for sure, and this is why we allow price to show us which scenario is most likely developing.

Chart of S&P 500 for 05 October 2018

Be prepared for whatever is coming next, and trade with confidence:

To receive detailed daily analysis, guidance and the updated daily Buy / Sell trigger levels being generated by the Trading the Line system before the market opens, and intraday alerts when appropriate, please become a Member and Sign up for Alerts & Observations – includes access to Members Area and the Explanatory Notes for all of the concepts discussed.

Disclaimer: This is the diary of a personal trading system, its methodology and the signals that it is producing. You are welcome to follow along but please understand that the information presented here is for educational purposes only. No recommendations are being made to buy, or sell stocks, options or futures contracts. Please consult your own financial advisor before making any investment decisions.

 

St Francis

We were called to the forest… when we went down.
A wind blew warm and eloquent
We were searching for the secrets of the universe…
And we rounded up demons and forced them to tell us what it all meant
We tied 'em to trees and broke them down one by one
And on a scrap of paper, they wrote these words…
And as we read them, the sun broke through the trees…
"Dread the passage of Jesus, for he will not return."

Nick Cave & The Dirty Three, Time Jesum Transeuntum Et Non Riverentum, 1996

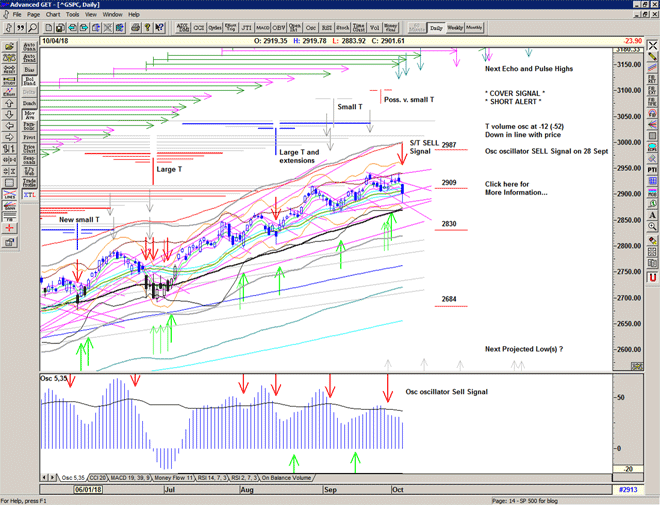
Another look-see at the 2940 high and again the market backs-off with selling accelerating into the close.

A pulse high.

Technically still above the Buy Signal line but the market continues to display declining resistance from the high(s).

Futures are significantly lower this morning and threatening the current Buy Signal.

Chart of S&P 500 for 04 October 2018

Be prepared for whatever is coming next, and trade with confidence:

To receive detailed daily analysis, guidance and the updated daily Buy / Sell trigger levels being generated by the Trading the Line system before the market opens, and intraday alerts when appropriate, please become a Member and Sign up for Alerts & Observations – includes access to Members Area and the Explanatory Notes for all of the concepts discussed.

Disclaimer: This is the diary of a personal trading system, its methodology and the signals that it is producing. You are welcome to follow along but please understand that the information presented here is for educational purposes only. No recommendations are being made to buy, or sell stocks, options or futures contracts. Please consult your own financial advisor before making any investment decisions.


Unit

Zooropa… better by design
Zooropa… fly the friendly skies
Through appliance of science
We've got that ring of confidence…

And I have no compass
And I have no map
And I have no reasons
No reasons to get back

U2, Zooropa, 1993

Another attempt to move higher is sold into in the afternoon, but the market remains above the Buy signal level and close to all time highs.

Untitled-1

Be prepared for whatever is coming next, and trade with confidence:

To receive detailed daily analysis, guidance and the updated daily Buy / Sell trigger levels being generated by the Trading the Line system before the market opens, and intraday alerts when appropriate, please become a Member and Sign up for Alerts & Observations – includes access to Members Area and the Explanatory Notes for all of the concepts discussed.

Disclaimer: This is the diary of a personal trading system, its methodology and the signals that it is producing. You are welcome to follow along but please understand that the information presented here is for educational purposes only. No recommendations are being made to buy, or sell stocks, options or futures contracts. Please consult your own financial advisor before making any investment decisions.

Twilight

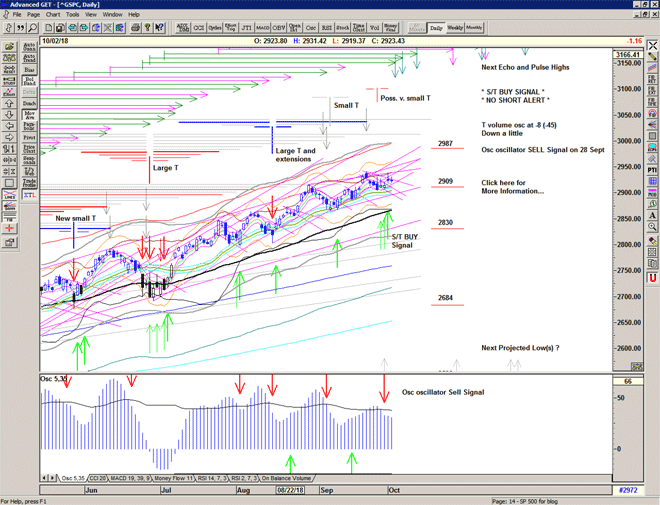
A gap up above the Buy Signal level and head for the recent highs triggers another Buy signal at the open. The market continues to follow the recent script and having taken a look-see at 2937 finds profit-taking again, intensifying in afternoon action.

The market closed just above the Buy Signal line but it seems that we still have significant downward pressure from the recent price high.

Chart of S&P500 for 02 October 2018

Be prepared for whatever is coming next, and trade with confidence:

To receive detailed daily analysis, guidance and the updated daily Buy / Sell trigger levels being generated by the Trading the Line system before the market opens, and intraday alerts when appropriate, please become a Member and Sign up for Alerts & Observations – includes access to Members Area and the Explanatory Notes for all of the concepts discussed.

Disclaimer: This is the diary of a personal trading system, its methodology and the signals that it is producing. You are welcome to follow along but please understand that the information presented here is for educational purposes only. No recommendations are being made to buy, or sell stocks, options or futures contracts. Please consult your own financial advisor before making any investment decisions.


Oktober

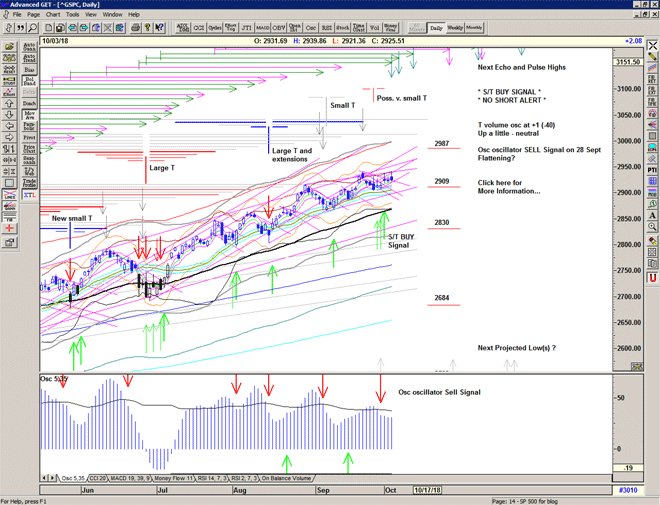
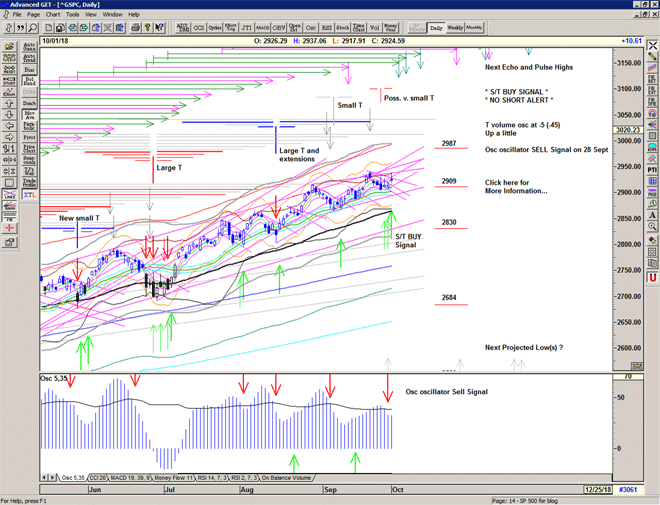
Another reconnaissance, an attempt at the Buy Signal level and just touched before backing off.

We need to see a close above the Buy Signal level to initiate a move beyond the all time high.

Still, the market is holding up above key price levels, for now.

Osc oscillator confirms a sell signal and this either suggests that the next move will not be significantly higher or that there is downward pressure developing.

Chart of S&P 500 for 01 October 2018

Be prepared for whatever is coming next, and trade with confidence:

To receive detailed daily analysis, guidance and the updated daily Buy / Sell trigger levels being generated by the Trading the Line system before the market opens, and intraday alerts when appropriate, please become a Member and Sign up for Alerts & Observations – includes access to Members Area and the Explanatory Notes for all of the concepts discussed.

Disclaimer: This is the diary of a personal trading system, its methodology and the signals that it is producing. You are welcome to follow along but please understand that the information presented here is for educational purposes only. No recommendations are being made to buy, or sell stocks, options or futures contracts. Please consult your own financial advisor before making any investment decisions.


Reconnaissance

And I follow, follow, follow,
The Gypsy Faerie Queen,
We exist, exist, exist, exist,
in the twilight in-between.

Marianne Faithfull, The Gypsy Faerie Queen feat. Nick Cave, 2018

A tale of two halves with the market heading higher in morning trade to trigger an S/T Buy Signal at 2920, but finding declining resistance in afternoon trade and backing right off, cancelling the signal for the time being.

Still very much within the declining environment since last Friday's reversal at 2940, but holding up above key levels, for now.

Cover signal continues.

Chart of S&P 500 for 28 September 2018

Be prepared for whatever is coming next, and trade with confidence:

To receive detailed daily analysis, guidance and the updated daily Buy / Sell trigger levels being generated by the Trading the Line system before the market opens, and intraday alerts when appropriate, please become a Member and Sign up for Alerts & Observations – includes access to Members Area and the Explanatory Notes for all of the concepts discussed.

Disclaimer: This is the diary of a personal trading system, its methodology and the signals that it is producing. You are welcome to follow along but please understand that the information presented here is for educational purposes only. No recommendations are being made to buy, or sell stocks, options or futures contracts. Please consult your own financial advisor before making any investment decisions.


Banana

There she goes
There she goes again
Racing through' my brain
And I just can't contain
This feelin' that remains

The Velvet Underground, There She Goes Again, 1967
Songwriter: Lou Reed

Well, the Fed speaks and the market reacts providing traders with the brief opportunity to sell in the vicinity of the recent all time high, followed by a rapid descent which triggered a 'cover' signal at 2909.

At the very least we should now expect some kind of stabilisation phase as the market looks to find support, with the possibility of further selling.

Yesterday's action suggests to me that the current T structures may be complete, and that a corrective phase may now be necessary.

The rapid drop in the T volume oscillator since the high on Friday morning is flashing a warning as one would normally expect to see some follow through from a thrust in the oscillator, and so, for now, last week looks like distribution at the high.

Watch the declining angles from the high, rising support lines and averages, and the oscillators for signs of stabilisation as we wait for the next signal.

Chart of S&P 500 for 27 September 2018

Be prepared for whatever is coming next, and trade with confidence:

To receive detailed daily analysis, guidance and the updated daily Buy / Sell trigger levels being generated by the Trading the Line system before the market opens, and intraday alerts when appropriate, please become a Member and Sign up for Alerts & Observations – includes access to Members Area and the Explanatory Notes for all of the concepts discussed.

Disclaimer: This is the diary of a personal trading system, its methodology and the signals that it is producing. You are welcome to follow along but please understand that the information presented here is for educational purposes only. No recommendations are being made to buy, or sell stocks, options or futures contracts. Please consult your own financial advisor before making any investment decisions.


Spindrift

The market continues to grind and drift lower within the channel, waiting for the catalyst from the Fed, perhaps for some further justification for higher prices, or a reason to sell.

Chart of S&P 500 for 26 September 2018

Be prepared for whatever is coming next, and trade with confidence:

To receive detailed daily analysis, guidance and the updated daily Buy / Sell trigger levels being generated by the Trading the Line system before the market opens, and intraday alerts when appropriate, please become a Member and Sign up for Alerts & Observations – includes access to Members Area and the Explanatory Notes for all of the concepts discussed.

Disclaimer: This is the diary of a personal trading system, its methodology and the signals that it is producing. You are welcome to follow along but please understand that the information presented here is for educational purposes only. No recommendations are being made to buy, or sell stocks, options or futures contracts. Please consult your own financial advisor before making any investment decisions.