Firgun

Firgun is an informal modern Hebrew term and concept in Israeli culture, which describes genuine, unselfish delight or pride in the accomplishment of the other.

The market takes a pause for breathe at 2800 in-line with the recent projection for a high.

A pullback of course is a possibility, or perhaps a marking out of an upper range.

Some signs of deceleration as the T volume oscillator drops towards the important zero level.

Today is another scheduled pulse high with perhaps a more important echo high on Friday.

Chart of S&P500 for 17 July 2018

Be prepared for whatever is coming next, and trade with confidence:

To receive detailed daily analysis, guidance and the updated daily Buy / Sell trigger levels being generated by the Trading the Line system before the market opens, and intraday alerts when appropriate, please become a Member and Sign up for Alerts & Observations – includes access to Members Area and the Explanatory Notes for all of the concepts discussed.

Disclaimer: This is the diary of a personal trading system, its methodology and the signals that it is producing. You are welcome to follow along but please understand that the information presented here is for educational purposes only. No recommendations are being made to buy, or sell stocks, options or futures contracts. Please consult your own financial advisor before making any investment decisions.


Dog days

I do apologise, it has been rather a long time since my last free report.

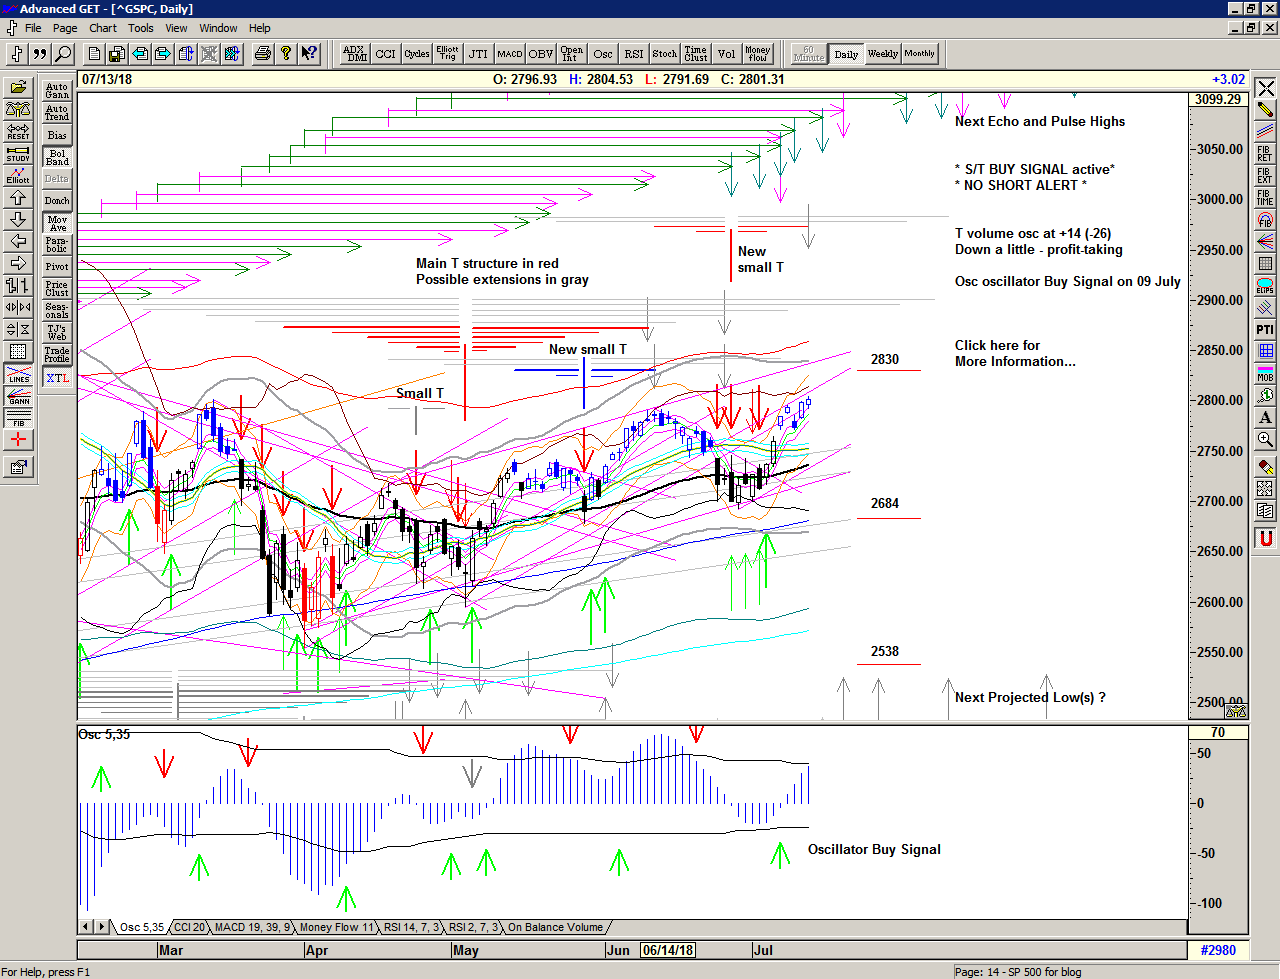
The market rises into the dog days of summer out of a volatile consolidation at the important 2700 level with 2018's gappy and choppy character continuing into the summer months with the May recovery superceeded by the June recovery and the more recent advance to 2800 in July.

Each of the declines has projected highs with small T structures reinforcing and overlapping each other. Weakness brings renewed strength as value buyers soak up the relative cheapness of price and this stimulates renewed buying.

As you can see the recent advance is now at a critical juncture with an important initial projection from the recent T structure projecting the current high. We may see some weakness and consolidation here, perhaps even a pull-back. It is entirely possible that the current structure is larger and that there are further highs ahead, and the relative strength of the market hints at this, but we should be prepared for both scenarios.

Chart of S&P 500 for 16 July 2018

Save the image to your desktop to view a larger version

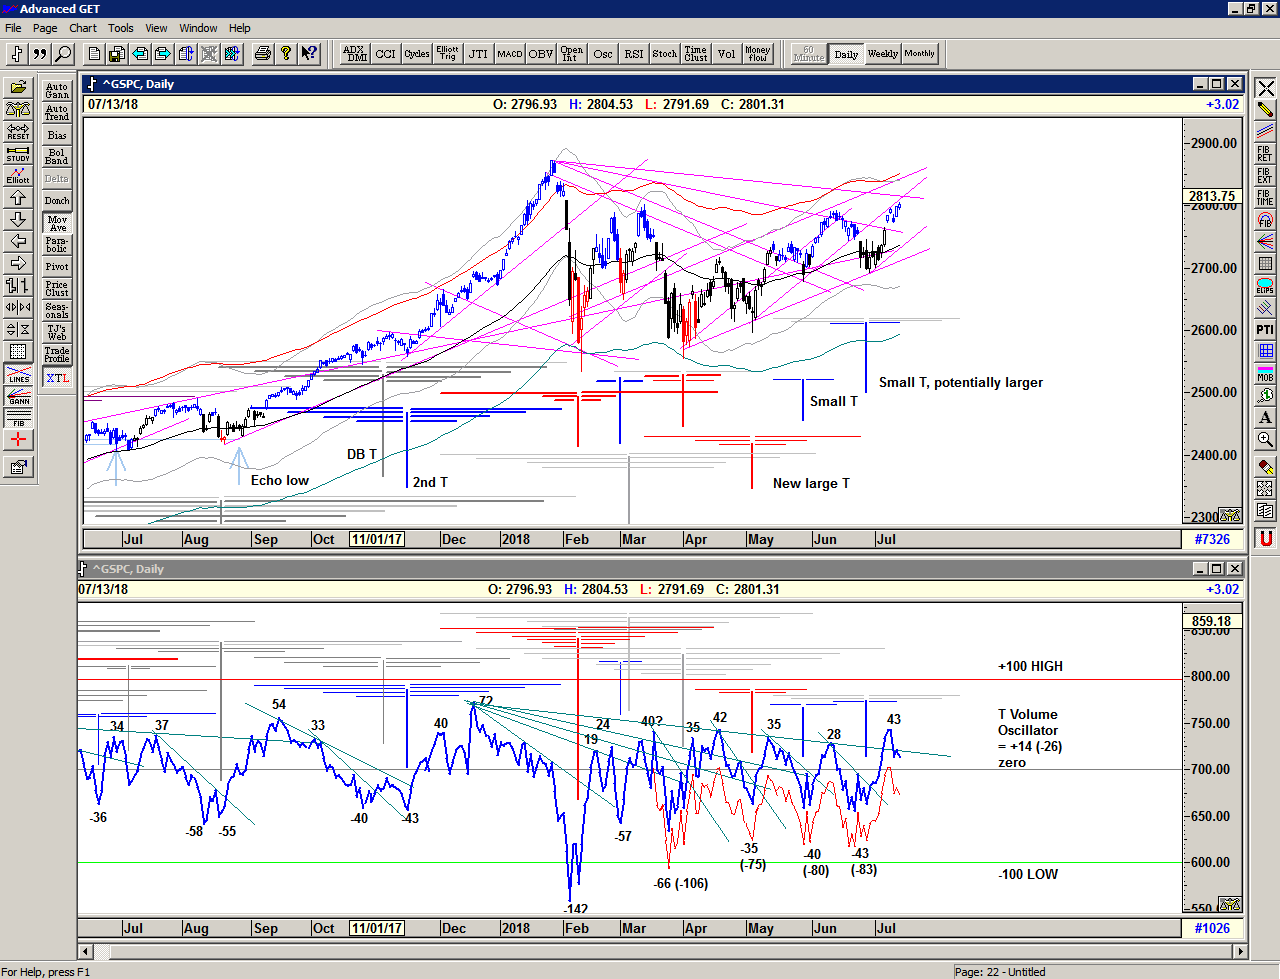
Zooming out to a one year chart, below, we can see that the market seems to be in a trajectory that should see it return to the all time high, and beyond, and that the January high and subsequent collapse could now be viewed as an anomaly – as the market moved up too far out of its trend and then dramatically lower to re-set its course.

So, the market is back on course, chopping and grinding higher, each decline providing fuel for the next advance.

Note also that the T volume oscillator in the chart below has recently displayed greater strength, in efffect breaking upwards from the range-bound oscillation and suggesting the possibility of future out-performance and further recovery in due course.

Chart of S&P 500 for 16 July 2018

Save the image to your desktop to view a larger version

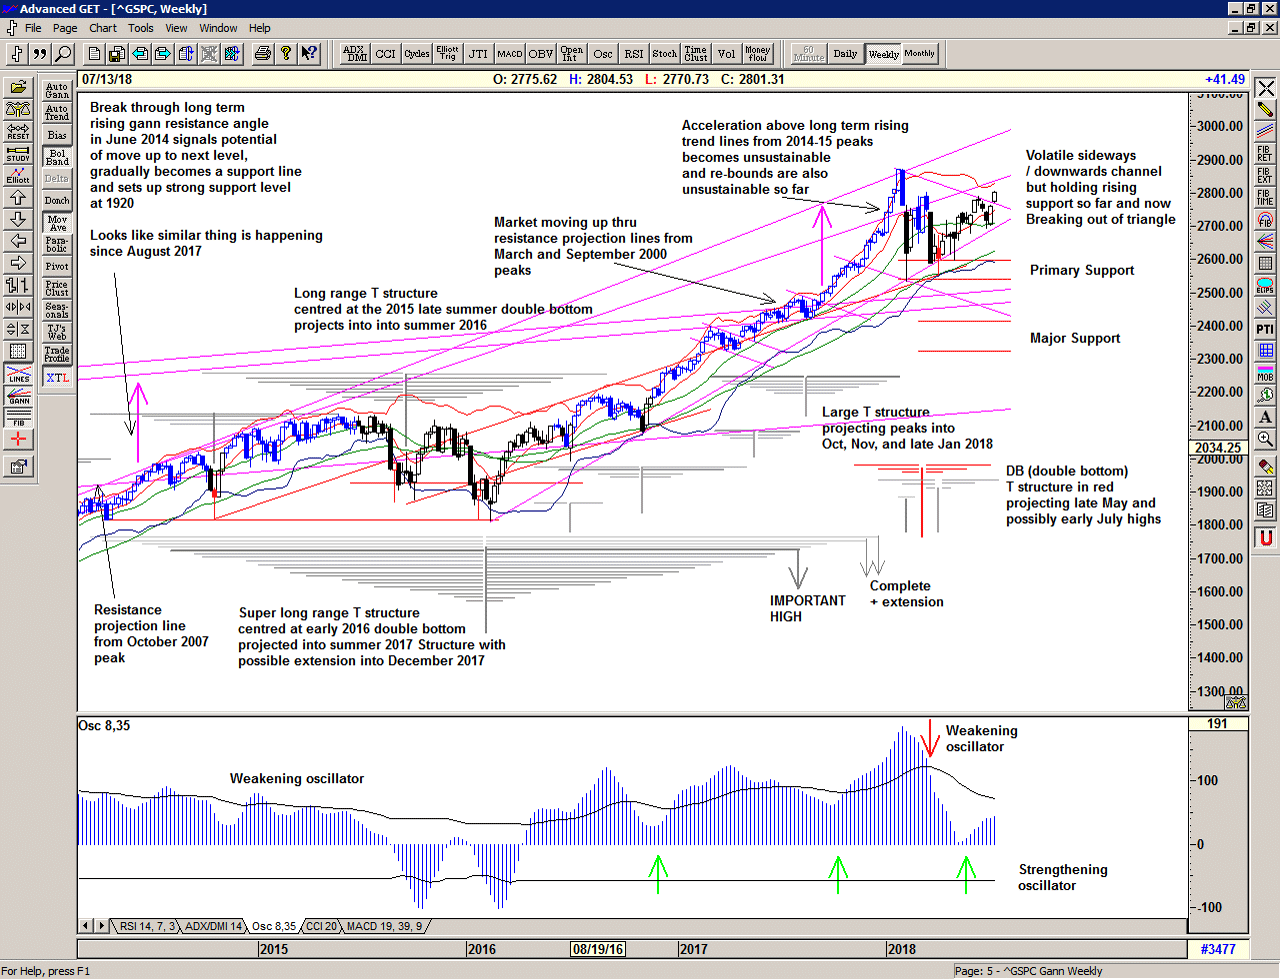
In the weekly chart we can see that the volatile range-bound action is improving with a weekly move up out of the recent triangulation.

Weekly chart of S&P 500 for 16 July 2018

Save the image to your desktop to view a larger version

All in all, an exciting year so far as 2018 continues to bring with it some excellent opportunity and a range that is far beyond the experience of recent years. We should expect it to continue and trade accordingly. This is a Brave New World.

Regardless of whether the market can sustain its current advance or whether another, perhaps deeper, low is ahead of us, the simplicity of the proprietary price based S/T Signalling System continues to keep us on the correct side of the market, providing a timely Buy signal and a green light, for now.

If you would like to learn more about using the S/T Signalling System please get in touch.

Be prepared for whatever is coming next, and trade with confidence:

To receive detailed daily analysis, guidance and the updated daily Buy / Sell trigger levels being generated by the Trading the Line system before the market opens, and intraday alerts when appropriate, please become a Member and Sign up for Alerts & Observations – includes access to Members Area and the Explanatory Notes for all of the concepts discussed.

Disclaimer: This is the diary of a personal trading system, its methodology and the signals that it is producing. You are welcome to follow along but please understand that the information presented here is for educational purposes only. No recommendations are being made to buy, or sell stocks, options or futures contracts. Please consult your own financial advisor before making any investment decisions.


Trinity

On July 16, 1945 the world witnessed the first atomic bomb test codenamed Trinity by the lead physicist J. Robert Oppenheimer, in a conflicted homage to John Donne’s poem:

Batter my heart, three-person'd God, for you
As yet but knock, breathe, shine, and seek to mend;
That I may rise and stand, o'erthrow me, and bend
Your force to break, blow, burn, and make me new.
I, like an usurp'd town to another due,
Labor to admit you, but oh, to no end;
Reason, your viceroy in me, me should defend,
But is captiv'd, and proves weak or untrue.
Yet dearly I love you, and would be lov'd fain,
But am betroth'd unto your enemy;
Divorce me, untie or break that knot again,
Take me to you, imprison me, for I,
Except you enthrall me, never shall be free,
Nor ever chaste, except you ravish me.

John Donne, Holy Sonnets: Batter my heart, three-person'd God, c. 1620

The market peeps above 2800 for a look-see at a high projected by the new small T structure with the possibility of some kind of pullback or consolidation now.

Whether there is more remains to be seen as this T could certainly be larger and could draw strength from the May declines. If that is the case we have projections into August.

For now, the market is well above the current Buy Signal level. Watch out for weakness developing in the oscillators for hints of further downside.

Chart of S&P500 for 15 July 2018

Be prepared for whatever is coming next, and trade with confidence:

To receive detailed daily analysis, guidance and the updated daily Buy / Sell trigger levels being generated by the Trading the Line system before the market opens, and intraday alerts when appropriate, please become a Member and Sign up for Alerts & Observations – includes access to Members Area and the Explanatory Notes for all of the concepts discussed.

Disclaimer: This is the diary of a personal trading system, its methodology and the signals that it is producing. You are welcome to follow along but please understand that the information presented here is for educational purposes only. No recommendations are being made to buy, or sell stocks, options or futures contracts. Please consult your own financial advisor before making any investment decisions.


Touch

Just tell me what you're feeling
I'm feeling with you
You touch my mind in special places
My heart races with you

UNKLE feat. Liela Moss, Touch Me, 2015

A gap up and go day as the market recovers from its midweek blues and heads for 2800.

Today we have a projection for a high from the new T structure, and then we shall see if it is larger…

Chart of S&P500 for 13 July 2018

Be prepared for whatever is coming next, and trade with confidence:

To receive detailed daily analysis, guidance and the updated daily Buy / Sell trigger levels being generated by the Trading the Line system before the market opens, and intraday alerts when appropriate, please become a Member and Sign up for Alerts & Observations – includes access to Members Area and the Explanatory Notes for all of the concepts discussed.

Disclaimer: This is the diary of a personal trading system, its methodology and the signals that it is producing. You are welcome to follow along but please understand that the information presented here is for educational purposes only. No recommendations are being made to buy, or sell stocks, options or futures contracts. Please consult your own financial advisor before making any investment decisions.


Bisbee

A gap down and grind sideways as the market absorbs the news and suggests a marking out of a new upper range.

Still above the Buy Signal level with strong momentum.

Chart of S&P500 for 12 July 2018

Be prepared for whatever is coming next, and trade with confidence:

To receive detailed daily analysis, guidance and the updated daily Buy / Sell trigger levels being generated by the Trading the Line system before the market opens, and intraday alerts when appropriate, please become a Member and Sign up for Alerts & Observations – includes access to Members Area and the Explanatory Notes for all of the concepts discussed.

Disclaimer: This is the diary of a personal trading system, its methodology and the signals that it is producing. You are welcome to follow along but please understand that the information presented here is for educational purposes only. No recommendations are being made to buy, or sell stocks, options or futures contracts. Please consult your own financial advisor before making any investment decisions.

Mockingbird

Real courage is when you know you're licked before you begin,
but you begin anyway and see it through no matter what.

Harper Lee, To Kill a Mockingbird, 1960

Another gap higher as the market reaches up towards 2800, finding some resistance to price at the rising line from the 04 and 29 May lows.

Chart of S&P500 for 11 July 2018

Be prepared for whatever is coming next, and trade with confidence:

To receive detailed daily analysis, guidance and the updated daily Buy / Sell trigger levels being generated by the Trading the Line system before the market opens, and intraday alerts when appropriate, please become a Member and Sign up for Alerts & Observations – includes access to Members Area and the Explanatory Notes for all of the concepts discussed.

Disclaimer: This is the diary of a personal trading system, its methodology and the signals that it is producing. You are welcome to follow along but please understand that the information presented here is for educational purposes only. No recommendations are being made to buy, or sell stocks, options or futures contracts. Please consult your own financial advisor before making any investment decisions.


Silencio

[At the club Silencio]

No hay banda! There is no band! Il n'est pas de orquestra!
This is all… a tape-recording. No hay banda!
And yet we hear a band. If we want to hear a clarinette… listen.

From Mulholland Drive, 2001, Dir. David Lynch

A pop, and the market continues to move higher, playing catch up quick.

The Osc oscillator makes a Buy Signal.

Chart of S&P 500 for 10 July 2018

Be prepared for whatever is coming next, and trade with confidence:

To receive detailed daily analysis, guidance and the updated daily Buy / Sell trigger levels being generated by the Trading the Line system before the market opens, and intraday alerts when appropriate, please become a Member and Sign up for Alerts & Observations – includes access to Members Area and the Explanatory Notes for all of the concepts discussed.

Disclaimer: This is the diary of a personal trading system, its methodology and the signals that it is producing. You are welcome to follow along but please understand that the information presented here is for educational purposes only. No recommendations are being made to buy, or sell stocks, options or futures contracts. Please consult your own financial advisor before making any investment decisions.


Nunavut

Follow through from Thursday's Buy Signal as the market breaks away from the 'holding' above 2700 with a strong squeeze upwards.

Technically a significant improvement in-line with the projection from the new small T structure which projects next major highs for mid July and perhaps an re-test of the previous high, or more.

Today is a combined echo high and pulse high and so we should be prepared for some kind of disruption to the advance or pull-back in the days to come.

Momentum has turned positive and the Osc oscillator should make a Buy Signal today.

Chart of S&P 500 for 09 July 2018

Be prepared for whatever is coming next, and trade with confidence:

To receive detailed daily analysis, guidance and the updated daily Buy / Sell trigger levels being generated by the Trading the Line system before the market opens, and intraday alerts when appropriate, please become a Member and Sign up for Alerts & Observations – includes access to Members Area and the Explanatory Notes for all of the concepts discussed.

Disclaimer: This is the diary of a personal trading system, its methodology and the signals that it is producing. You are welcome to follow along but please understand that the information presented here is for educational purposes only. No recommendations are being made to buy, or sell stocks, options or futures contracts. Please consult your own financial advisor before making any investment decisions.


San Fermin

Another gap and another S/T Buy Signal at 2726. This time with follow through into the close and with improvement that confirms the new small T centered on the 27 June price and oscillator low.

Starting to move above the declining resistance – perhaps another attempt at the recent high.

Next negotiation is the combination of a pulse and echo high scheduled for monday.

Chart of S&P 500 for 06 July 2018

Be prepared for whatever is coming next, and trade with confidence:

To receive detailed daily analysis, guidance and the updated daily Buy / Sell trigger levels being generated by the Trading the Line system before the market opens, and intraday alerts when appropriate, please become a Member and Sign up for Alerts & Observations – includes access to Members Area and the Explanatory Notes for all of the concepts discussed.

Disclaimer: This is the diary of a personal trading system, its methodology and the signals that it is producing. You are welcome to follow along but please understand that the information presented here is for educational purposes only. No recommendations are being made to buy, or sell stocks, options or futures contracts. Please consult your own financial advisor before making any investment decisions.


Independence

A gap up open above the S/T Buy Signal level at the declining resistance angle finds little interest and the subsequent drift lower accelerates into the close triggering a Cover and a Sell Signal at 2716.

So, no follow through to the upside, yet, as the market seems trapped in a range, building strength for the next move, direction undecided.

Cover at the close pending either a continuation Sell Signal or another Buy signal.

Some improvement in both oscillators suggest a possible small T centered on the 27 June low projecting strength into mid July.

Chart of S&P 500 for 04 July 2018

Be prepared for whatever is coming next, and trade with confidence:

To receive detailed daily analysis, guidance and the updated daily Buy / Sell trigger levels being generated by the Trading the Line system before the market opens, and intraday alerts when appropriate, please become a Member and Sign up for Alerts & Observations – includes access to Members Area and the Explanatory Notes for all of the concepts discussed.

Disclaimer: This is the diary of a personal trading system, its methodology and the signals that it is producing. You are welcome to follow along but please understand that the information presented here is for educational purposes only. No recommendations are being made to buy, or sell stocks, options or futures contracts. Please consult your own financial advisor before making any investment decisions.