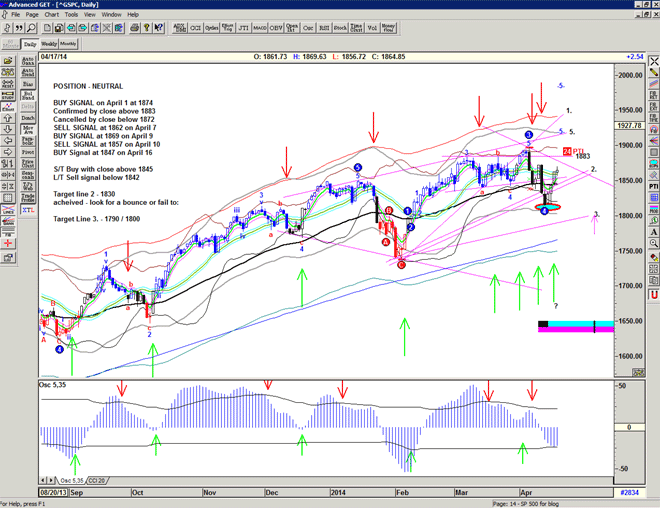
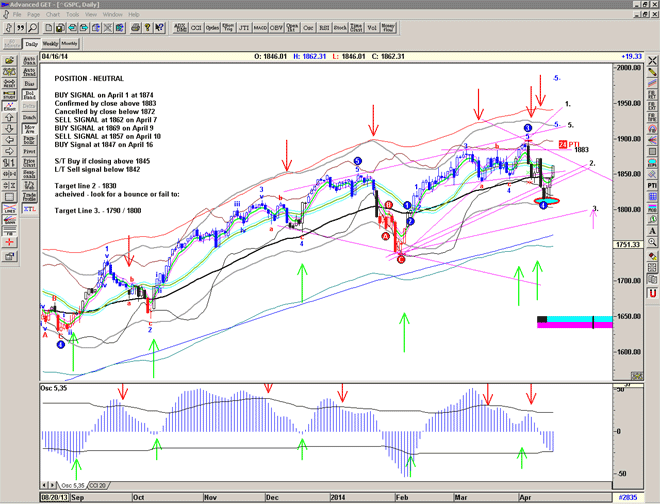
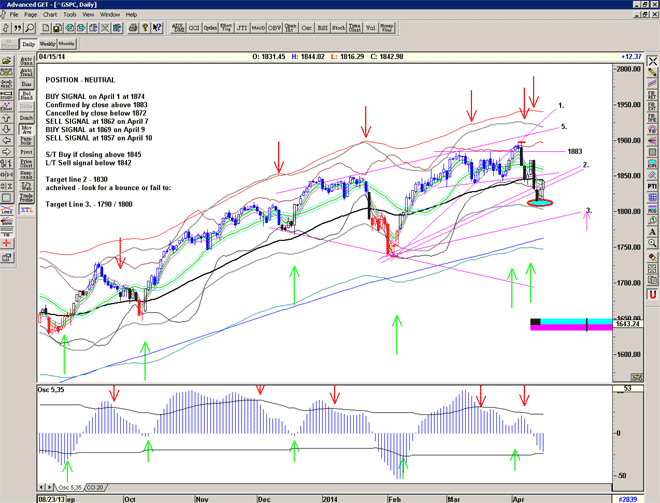
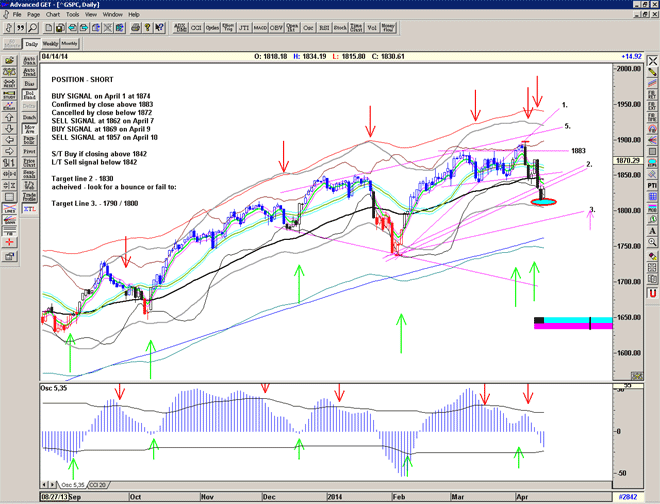
back at the 50

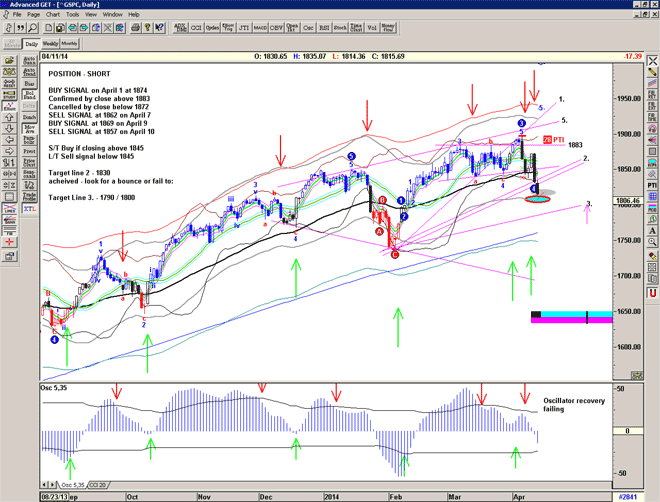
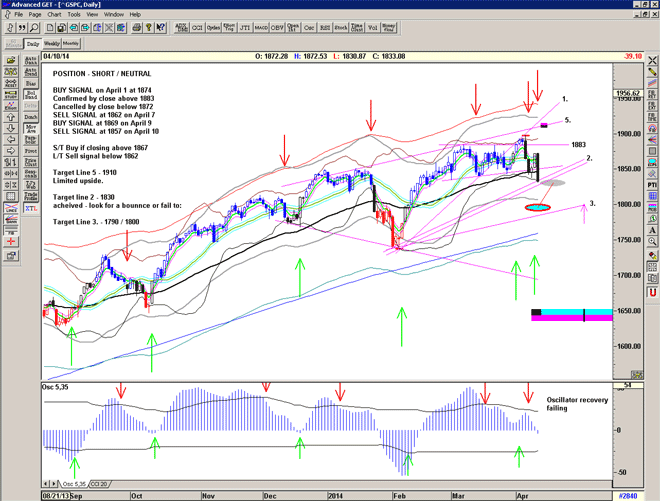
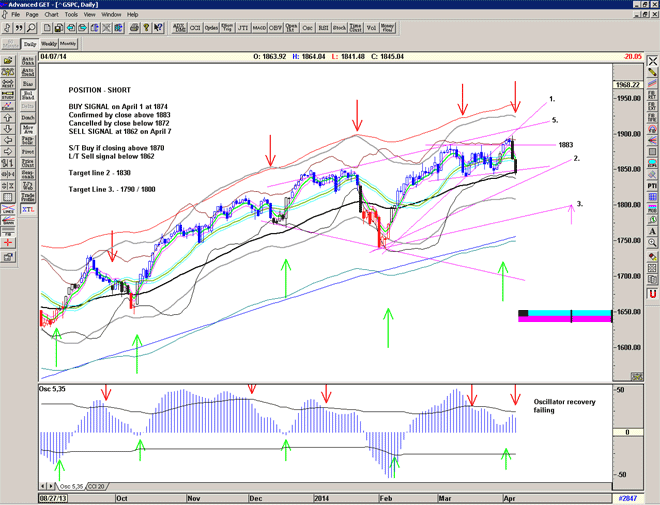
With the sharp move down the last 2 days the first major line of support (line 2.) comes into easy reach and I would expect to see some consolidation of the down move, a pause or even a bounce in this area. If we break that line then as with the line 1 break, then line 3 becomes the target.

The oscillator is showing weakness again and this is a reminder that when the oscillator is weak (but not oversold) that further weakness can be expected and not to trust any buy signals.

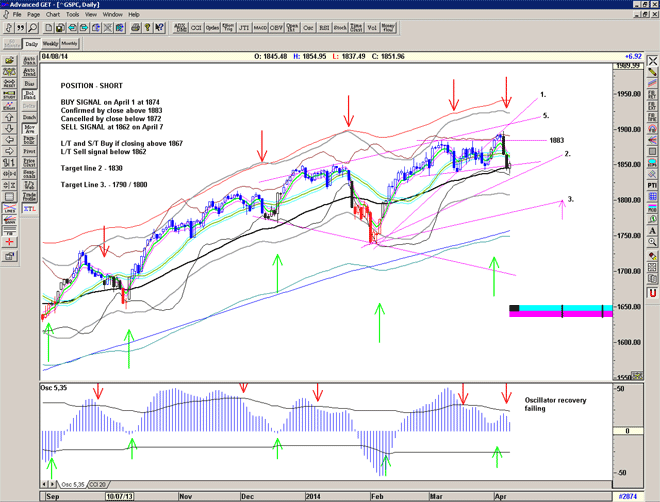
Chart of S&P500 for April 8 2014

no fear – just higher highs ?

So far so good. A bounce from lower bollinger to upper bollinger. A pause and first test of the breakout.

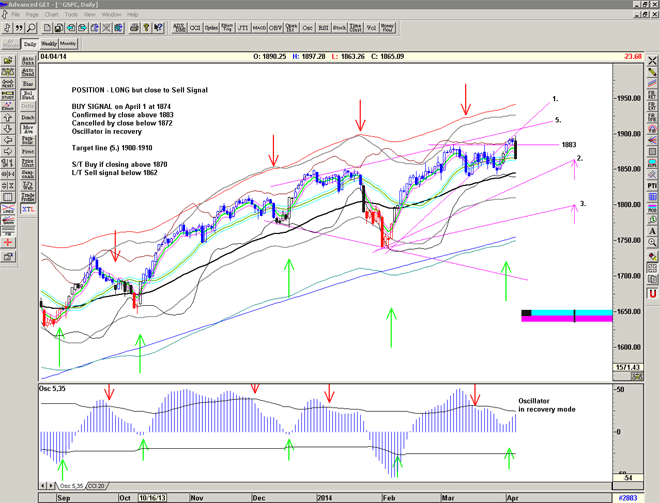
Long term I am now looking for a move towards trend line 2, or 3. at some point in the future (May 1st), perhaps after a series of tests of the upper trend line 5.

Chart of S&P500 for 4 April 2014


crapshoot ?

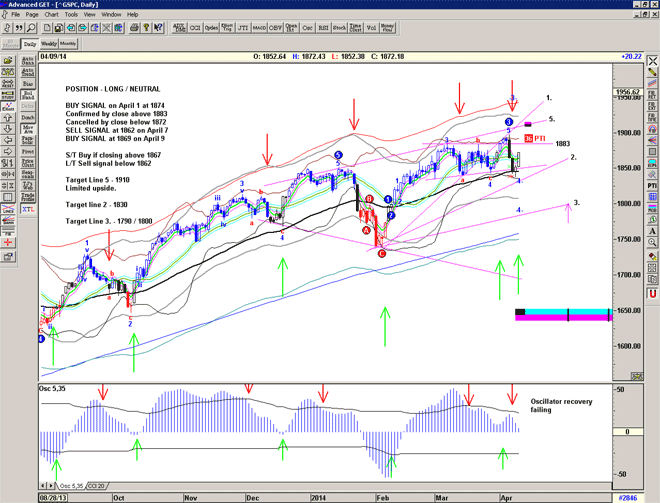
Mixed signals. Wait for the oscillator to confirm the move, and/or wait for a closing price above or below the current congestion.

The upside would appear to be rather limited, and so I am inclined to favour the downside. However recent action is a reminder of how bullish the market is/has been.

The recent increase in daily volatility since beginning of 2014 is also suggesting that I will need to increase the intraday stops for the signals, hence 2 recent sell signals at the low of the day.

Chart of the S&P500 for March 26 2014