
Fall Equinox
[Neo sees a black cat walk by them, and then a similar black cat walk by them just like the first one]
Neo: Whoa. Déjà vu.
[Everyone freezes right in their tracks]
Trinity: What did you just say?
Neo: Nothing. Just had a little déjà vu.
Trinity: What did you see?
Cypher: What happened?
Neo: A black cat went past us, and then another that looked just like it.
Trinity: How much like it? Was it the same cat?
Neo: It might have been. I'm not sure.
Morpheus: Switch! Apoc!
Neo: What is it?
Trinity: A déjà vu is usually a glitch in the Matrix. It happens when they change something.
– The Matrix (1999)
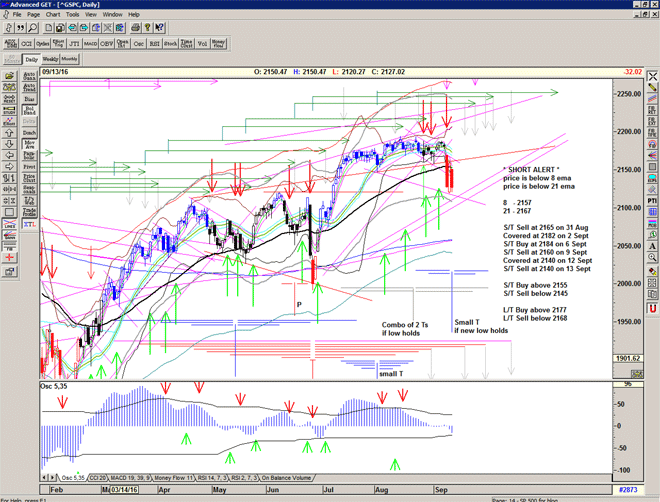
A Déjà vu day whilst waiting for the central bankers to juice the system.
Not quite hitting a Sell Signal but still on a 'Short Alert'.
OSC recovering and potentially making a Buy Signal.

For more detailed analysis, please Sign up for Alerts & Observations
Disclaimer: This is the diary of a personal trading system, its methodology and the signals that it is producing. You are welcome to follow along but please understand that the information presented here is for educational & entertainment purposes only. No recommendations are being made to buy, or sell stocks, options or futures contracts. Please consult your own financial advisor before making any investment decisions.


