Milos

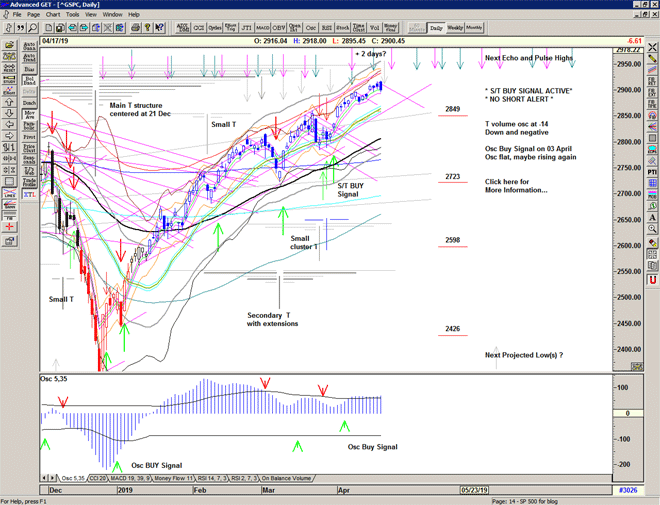
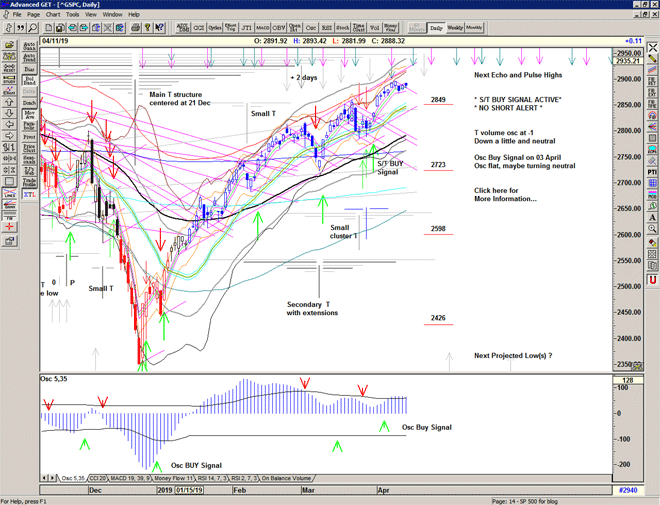
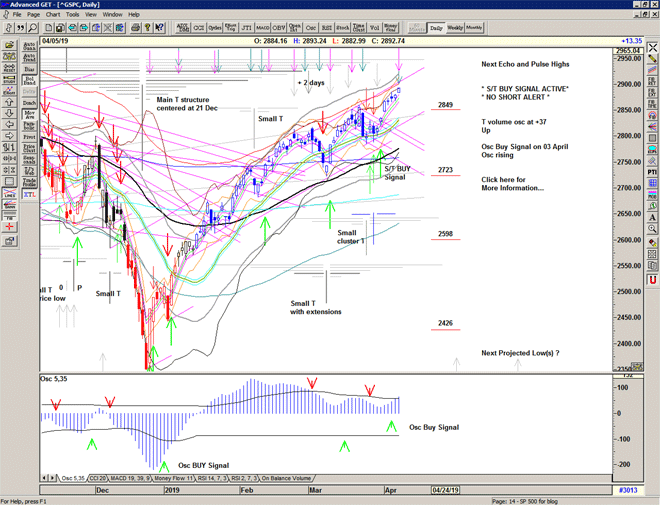
The market thrusts higher on the echo and pulse high to close just below the important 2900 level and not far from the upper extreme of the channel.

Although we should be prepared for some kind of pull-back or weakness after the echo and pulse highs, the market continues to look strong with both oscillators displaying relative strength.

Chart of S&P 500 for 08 April 2019

Be prepared for whatever is coming next, and trade with confidence:

To receive detailed daily analysis, guidance and the updated daily Buy / Sell trigger levels being generated by the Trading the Line system before the market opens, and intraday alerts when appropriate, please become a Member and Sign up for Alerts & Observations – includes access to Members Area and the Explanatory Notes for all of the concepts discussed.

Disclaimer: This is the diary of a personal trading system, its methodology and the signals that it is producing. You are welcome to follow along but please understand that the information presented here is for educational purposes only. No recommendations are being made to buy, or sell stocks, options or futures contracts. Please consult your own financial advisor before making any investment decisions.


Touch

You touch my mind in special places
My heart races with you

Unkle, Touch Me, 2019

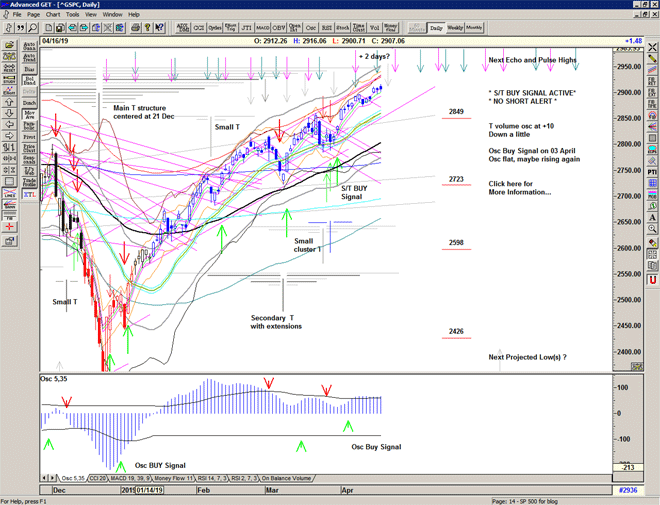
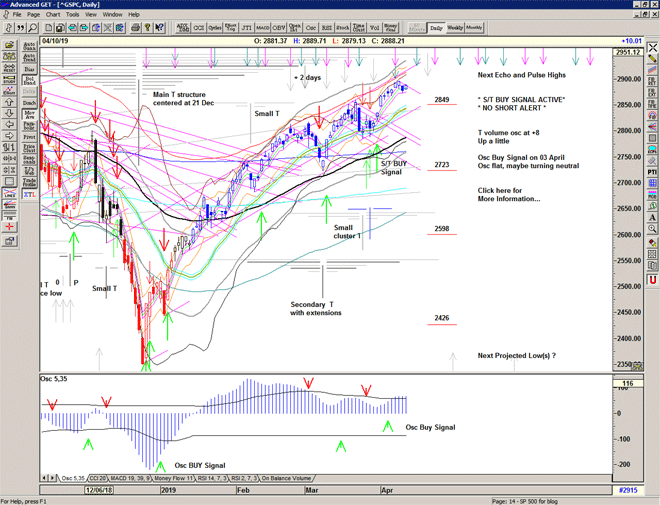
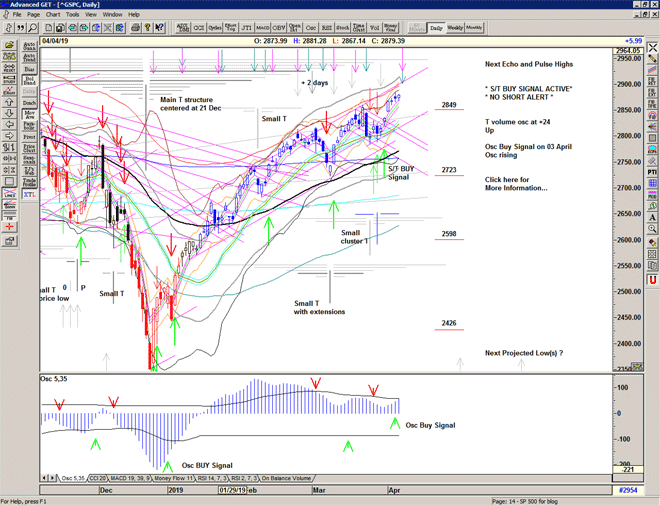
The market continues to chop and grind just below the recent highs as the current Buy Signal continues.

Today is a scheduled echo and pulse high.

Chart of S&P 500 for 05 April 2019

Be prepared for whatever is coming next, and trade with confidence:

To receive detailed daily analysis, guidance and the updated daily Buy / Sell trigger levels being generated by the Trading the Line system before the market opens, and intraday alerts when appropriate, please become a Member and Sign up for Alerts & Observations – includes access to Members Area and the Explanatory Notes for all of the concepts discussed.

Disclaimer: This is the diary of a personal trading system, its methodology and the signals that it is producing. You are welcome to follow along but please understand that the information presented here is for educational purposes only. No recommendations are being made to buy, or sell stocks, options or futures contracts. Please consult your own financial advisor before making any investment decisions.

Feel More

How do you know
This feeling when I'm awake
How do you know that
Yeah how do you know
Confidence on the floor
How do you know that

I feel more with less

Unkle, Feel More / With Less, 2019

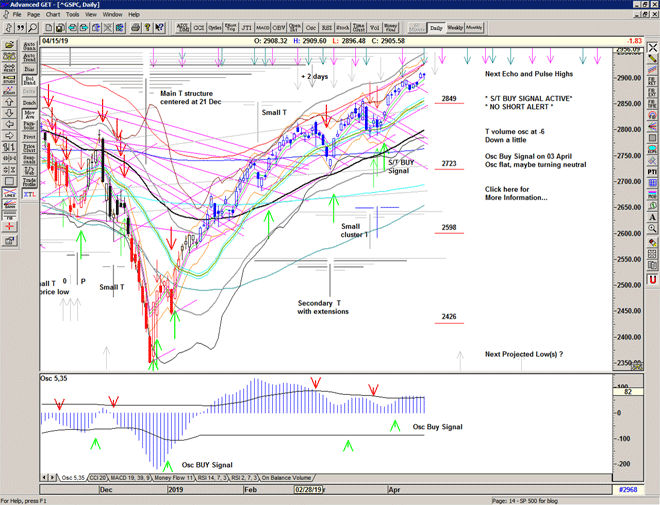
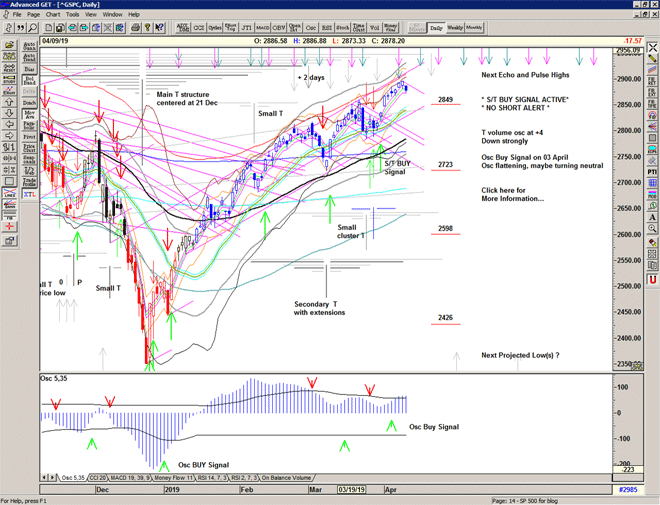
The market pops higher and takes a look at 2885 – just a few points from the upper extreme of the channel (the faint red line on my charts) – before embarking on a roller coaster ride for the remainder of the day.

As the market moves closer to the upper extreme of the channel the risk of profit-taking initiating strong selling is raised as participants re-cycle positions and fear of missing out provides the additional liquidity for major players to distribute.

The T volume oscillator moves a little lower, perhaps the canary signal, and the equity Put/Call ratios flashes a warning – that the market may be becoming vulnerable to a decline again. Not to mention that the market was 100 points off the recent lows yesterday.

Momentum ticks up and the Osc oscillator makes a Buy Signal, and volatility ticks up too suggesting an increased range ahead.

Chart of S&P 500 for 04 April 2019

Be prepared for whatever is coming next, and trade with confidence:

To receive detailed daily analysis, guidance and the updated daily Buy / Sell trigger levels being generated by the Trading the Line system before the market opens, and intraday alerts when appropriate, please become a Member and Sign up for Alerts & Observations – includes access to Members Area and the Explanatory Notes for all of the concepts discussed.

Disclaimer: This is the diary of a personal trading system, its methodology and the signals that it is producing. You are welcome to follow along but please understand that the information presented here is for educational purposes only. No recommendations are being made to buy, or sell stocks, options or futures contracts. Please consult your own financial advisor before making any investment decisions.


Without a sigh

Some kill their love when they are young,
And some when they are old;
Some strangle with the hands of Lust,
Some with the hands of Gold:
The kindest use a knife, because
The dead so soon grow cold.

Some love too little, some too long,
Some sell, and others buy;
Some do the deed with many tears,
And some without a sigh:
For each man kills the thing he loves,
Yet each man does not die.

Oscar Wilde, Ballad of Reading Gaol, 1898

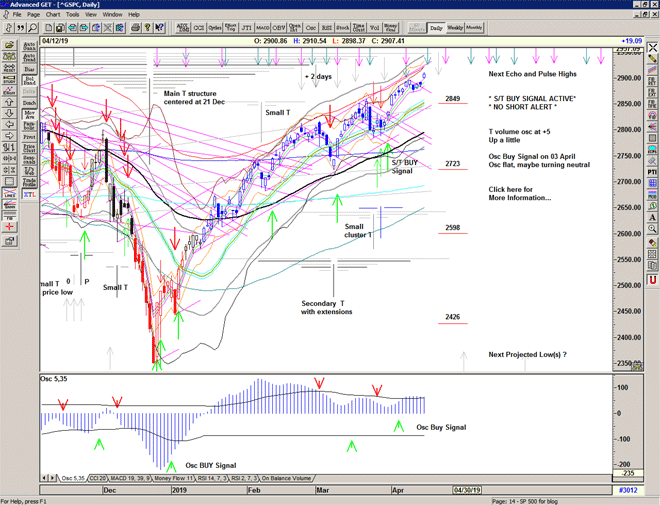
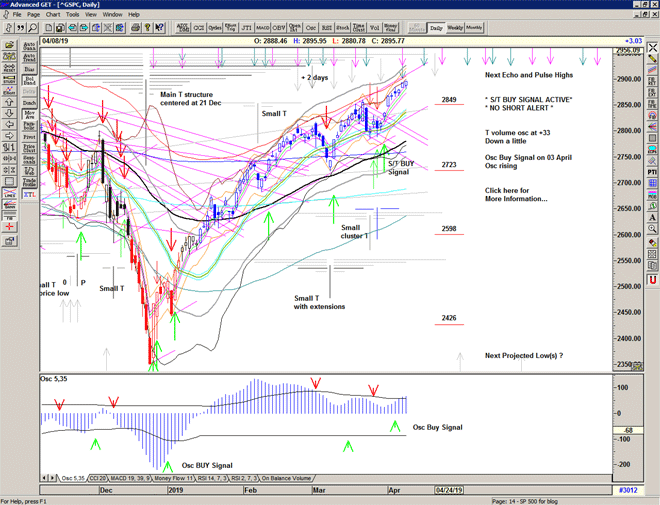
A grind just below the recent highs as the market takes a pause… higher or lower?

Chart of S&P 500 for 03 April 2019

Be prepared for whatever is coming next, and trade with confidence:

To receive detailed daily analysis, guidance and the updated daily Buy / Sell trigger levels being generated by the Trading the Line system before the market opens, and intraday alerts when appropriate, please become a Member and Sign up for Alerts & Observations – includes access to Members Area and the Explanatory Notes for all of the concepts discussed.

Disclaimer: This is the diary of a personal trading system, its methodology and the signals that it is producing. You are welcome to follow along but please understand that the information presented here is for educational purposes only. No recommendations are being made to buy, or sell stocks, options or futures contracts. Please consult your own financial advisor before making any investment decisions.


Spectrum

A gap up and grind higher with a close near the high of the day as the market shrugs off the recent weakness and leaves 2800 behind.

Buy Signal continues.

Chart of S&p 500 for 02 April 2019

Be prepared for whatever is coming next, and trade with confidence:

To receive detailed daily analysis, guidance and the updated daily Buy / Sell trigger levels being generated by the Trading the Line system before the market opens, and intraday alerts when appropriate, please become a Member and Sign up for Alerts & Observations – includes access to Members Area and the Explanatory Notes for all of the concepts discussed.

Disclaimer: This is the diary of a personal trading system, its methodology and the signals that it is producing. You are welcome to follow along but please understand that the information presented here is for educational purposes only. No recommendations are being made to buy, or sell stocks, options or futures contracts. Please consult your own financial advisor before making any investment decisions.


Prima Aprilis

The market gaps up above the recent holding pattern above 2820 triggering an S/T Buy Signal at 2827.

Finally some movement out of last week's congestion or holding pattern which, for now, looks like strong support at and just below 2800 has been thoroughly tested.

The numerous reversals of direction last week, although frustrating, is a phenomenon that occurs from time to time. The last occasion was late June / early July 2018 as the market consolidated around 2700. This process builds significant energy for a strong directional move, and so the ejection on Friday upwards is a very positive development.

Chart of S&P 500 for 01 April 2019

Be prepared for whatever is coming next, and trade with confidence:

To receive detailed daily analysis, guidance and the updated daily Buy / Sell trigger levels being generated by the Trading the Line system before the market opens, and intraday alerts when appropriate, please become a Member and Sign up for Alerts & Observations – includes access to Members Area and the Explanatory Notes for all of the concepts discussed.

Disclaimer: This is the diary of a personal trading system, its methodology and the signals that it is producing. You are welcome to follow along but please understand that the information presented here is for educational purposes only. No recommendations are being made to buy, or sell stocks, options or futures contracts. Please consult your own financial advisor before making any investment decisions.


Drive

A man's attitude… a man's attitude goes some ways. The way his life will be. Is that somethin' you agree with?

Mulholland Drive, Dir. David Lynch, 2001

The market still held within its recent choppy range as the two channels merge, but seemingly improving with another day resolving back towards the upper level of the recent range and near to a Buy Signal.

Mindful of the declining nature of the momentum oscillator and recent drop in the T volume oscillator indicating negative breadth, and of course with one eye on the exhaustion high on 21 March, the gradual but choppy improvement in price is hinting at higher prices in due course. If that is correct, then the large T structure is larger with another extension in mid April.

Chart of S&P 500 for 29 March 2019

Be prepared for whatever is coming next, and trade with confidence:

To receive detailed daily analysis, guidance and the updated daily Buy / Sell trigger levels being generated by the Trading the Line system before the market opens, and intraday alerts when appropriate, please become a Member and Sign up for Alerts & Observations – includes access to Members Area and the Explanatory Notes for all of the concepts discussed.

Disclaimer: This is the diary of a personal trading system, its methodology and the signals that it is producing. You are welcome to follow along but please understand that the information presented here is for educational purposes only. No recommendations are being made to buy, or sell stocks, options or futures contracts. Please consult your own financial advisor before making any investment decisions.


Rikyu

Another turbulent day with a touch of the Buy Signal level at 2822 and a sell off through the Sell Signal level at 2794 before recovery back above 2800.

The market is currently trapped within the channels and chopping about violently making holding a position extremely difficult, and is in effect preparing for the next big move, direction uncertain.

Chart of S&P 500 for 28 March 2019

Be prepared for whatever is coming next, and trade with confidence:

To receive detailed daily analysis, guidance and the updated daily Buy / Sell trigger levels being generated by the Trading the Line system before the market opens, and intraday alerts when appropriate, please become a Member and Sign up for Alerts & Observations – includes access to Members Area and the Explanatory Notes for all of the concepts discussed.

Disclaimer: This is the diary of a personal trading system, its methodology and the signals that it is producing. You are welcome to follow along but please understand that the information presented here is for educational purposes only. No recommendations are being made to buy, or sell stocks, options or futures contracts. Please consult your own financial advisor before making any investment decisions.


Menaechmi

Teach me, dear creature, how to think and speak;
Lay open to my earthy-gross conceit,
Smother'd in errors, feeble, shallow, weak,
The folded meaning of your words' deceit.

William Shakespeare, The Comedy of Errors, c. 1594

A Buy Signal at 2821, as the market gaps up to have a look-see at 2829 before selling off hard and descending back to 2804, triggering a cover signal. Finally finding strong support and recovering into the close.

An unstable and confusing market.

Chart of S&P 500 for 27 March 2019

Be prepared for whatever is coming next, and trade with confidence:

To receive detailed daily analysis, guidance and the updated daily Buy / Sell trigger levels being generated by the Trading the Line system before the market opens, and intraday alerts when appropriate, please become a Member and Sign up for Alerts & Observations – includes access to Members Area and the Explanatory Notes for all of the concepts discussed.

Disclaimer: This is the diary of a personal trading system, its methodology and the signals that it is producing. You are welcome to follow along but please understand that the information presented here is for educational purposes only. No recommendations are being made to buy, or sell stocks, options or futures contracts. Please consult your own financial advisor before making any investment decisions.


Mighty Mountain

I'm in so deep
Baby, I can't sleep
Floating above me, the armies of the captain
Marching towards the mountain, the mighty mountain
In the car window I saw you smile
The screams of traffic
Flying through the streets, I saw it again
You and the captain
His armies surround you
Leading me off the edge
Of the mighty mountain

The mountain's falling

David Lynch & John Neff, Mountains Falling, 2001

A choppy day of stabilization after the harsh drop on Friday.

Sell Signals triggered below 2793 but not much follow through on either occasion.

Price remains above the Sell Signal level and below the Buy Signal level.

Chart of S&P 500 for 26 March 2019

Be prepared for whatever is coming next, and trade with confidence:

To receive detailed daily analysis, guidance and the updated daily Buy / Sell trigger levels being generated by the Trading the Line system before the market opens, and intraday alerts when appropriate, please become a Member and Sign up for Alerts & Observations – includes access to Members Area and the Explanatory Notes for all of the concepts discussed.

Disclaimer: This is the diary of a personal trading system, its methodology and the signals that it is producing. You are welcome to follow along but please understand that the information presented here is for educational purposes only. No recommendations are being made to buy, or sell stocks, options or futures contracts. Please consult your own financial advisor before making any investment decisions.