Twenty Eighteen
Welcome to the Trading the Line Free Report.
–
Ooh, stop
With your feet in the air and your head on the ground
Try this trick and spin it, yeah
Your head will collapse
But there's nothing in it
And you'll ask yourself
Where is my mind
Where is my mind
Where is my mind
Way out in the water
See it swimmin'
– Pixies, Where is my mind, 1988
–
And so, Where is My Mind..? – as we take on another year, let's see – welcome to Twenty Eighteen everyone.
Let's run through the short term and longer term viewpoints and see if we can interrogate them and see if there is any clarity emerging.
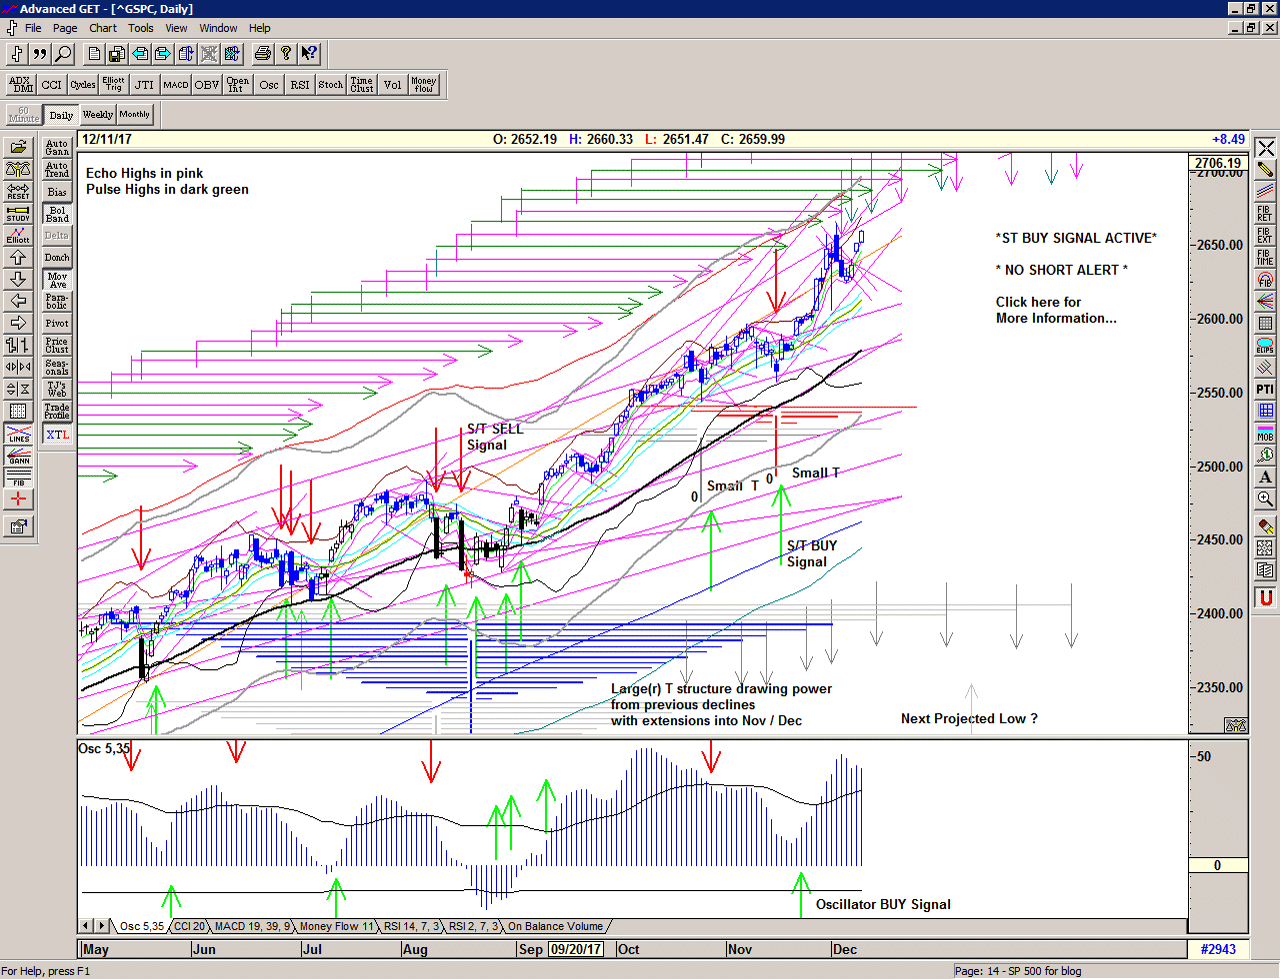
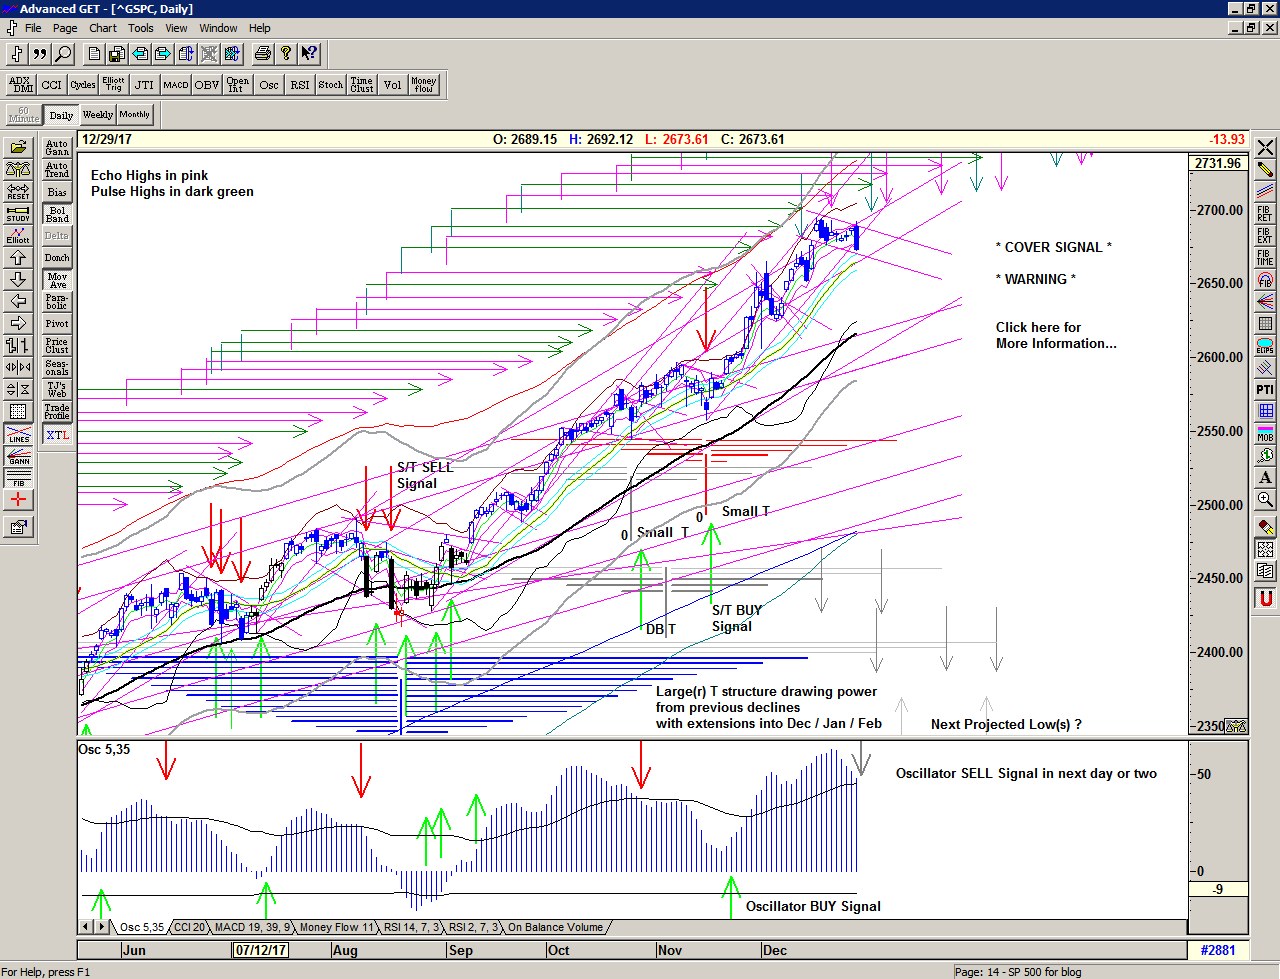
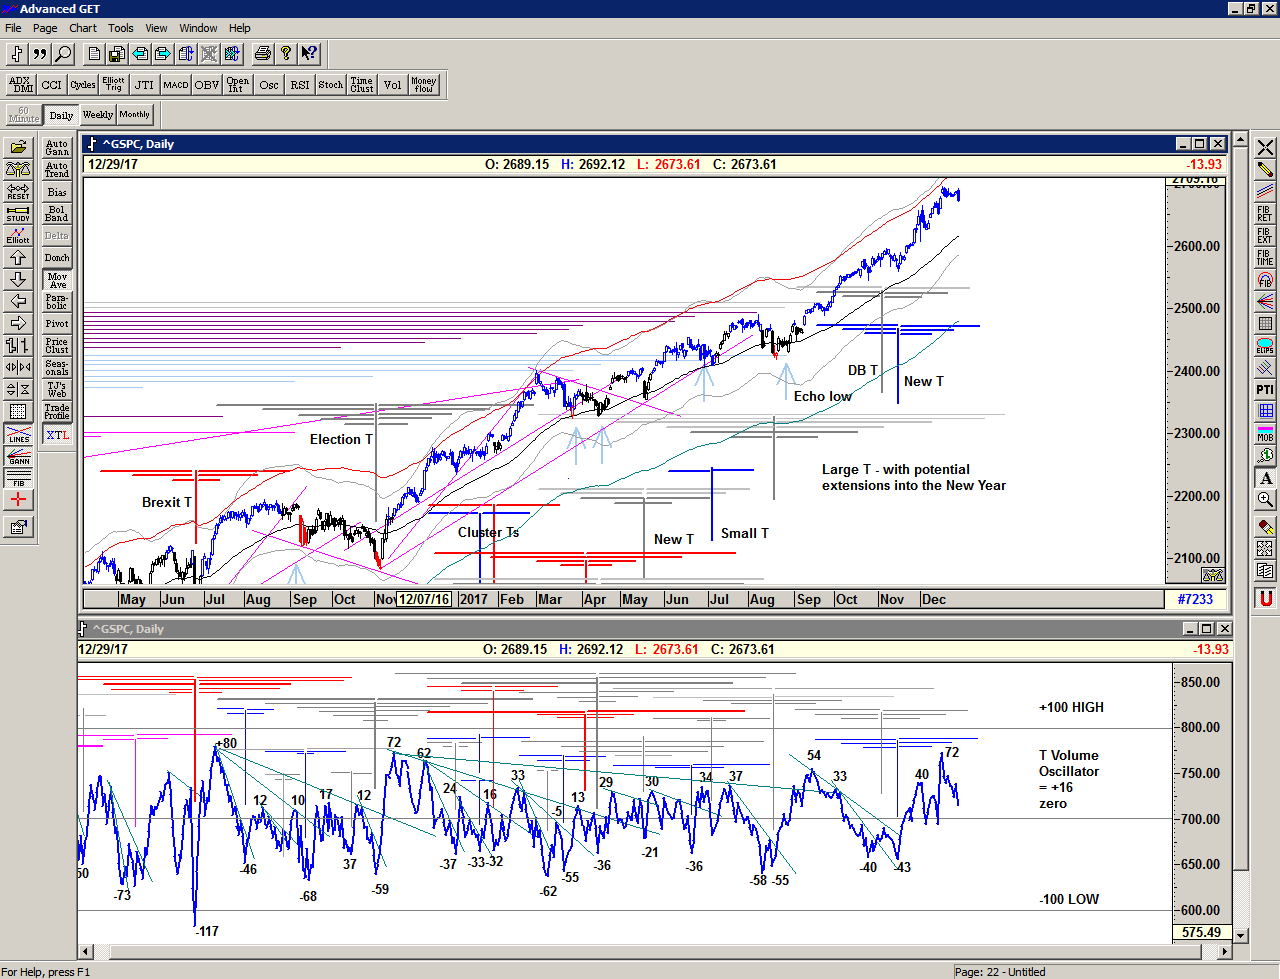
Firstly, in the last few minutes of trading in 2017 the market signalled a closure, a cover of the Buy Signal and neatly wrapped up the year with a very healthy 346 point gain.
Save the image to your desktop to view a larger version
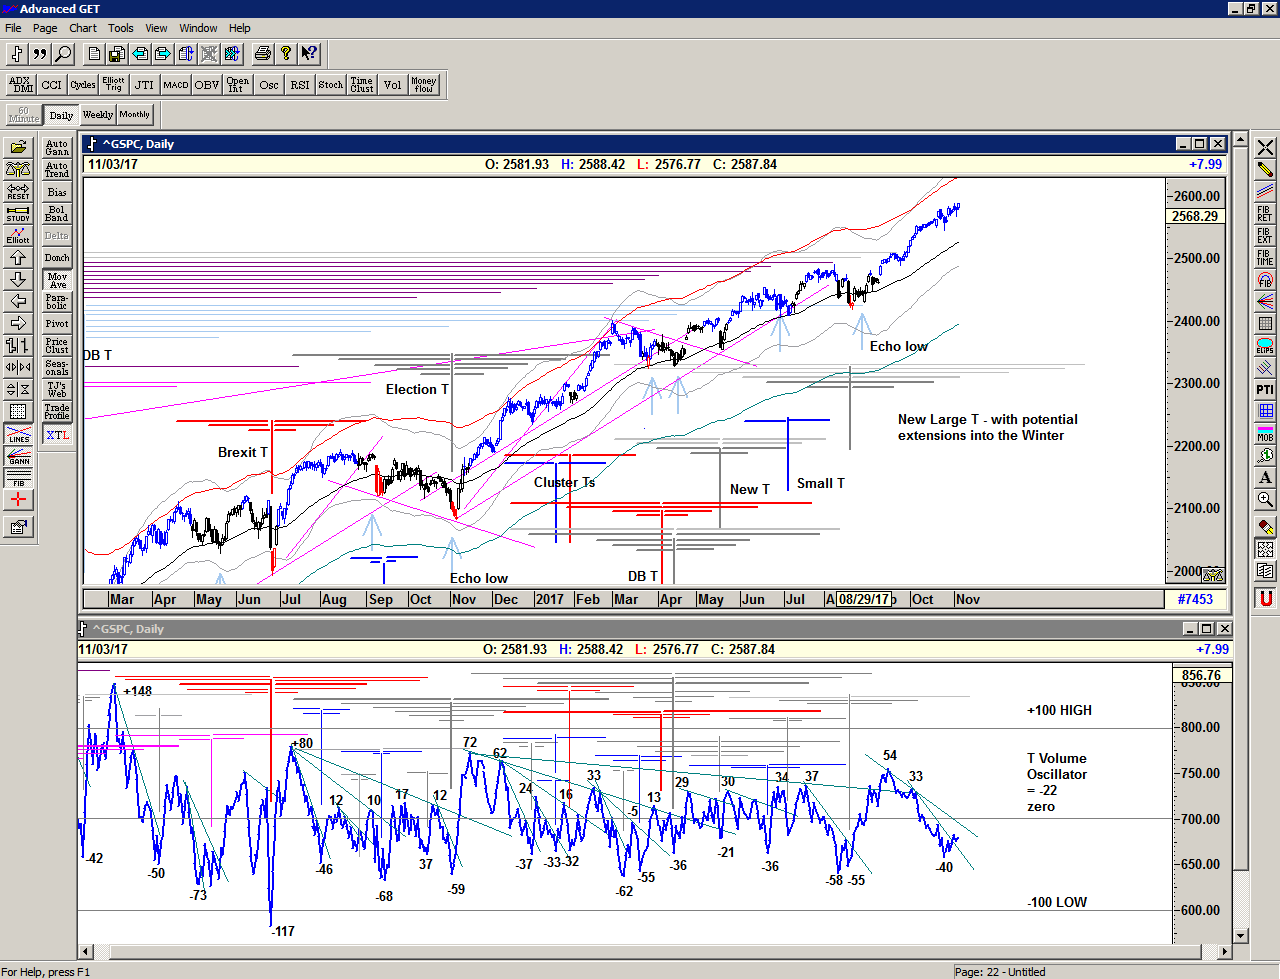
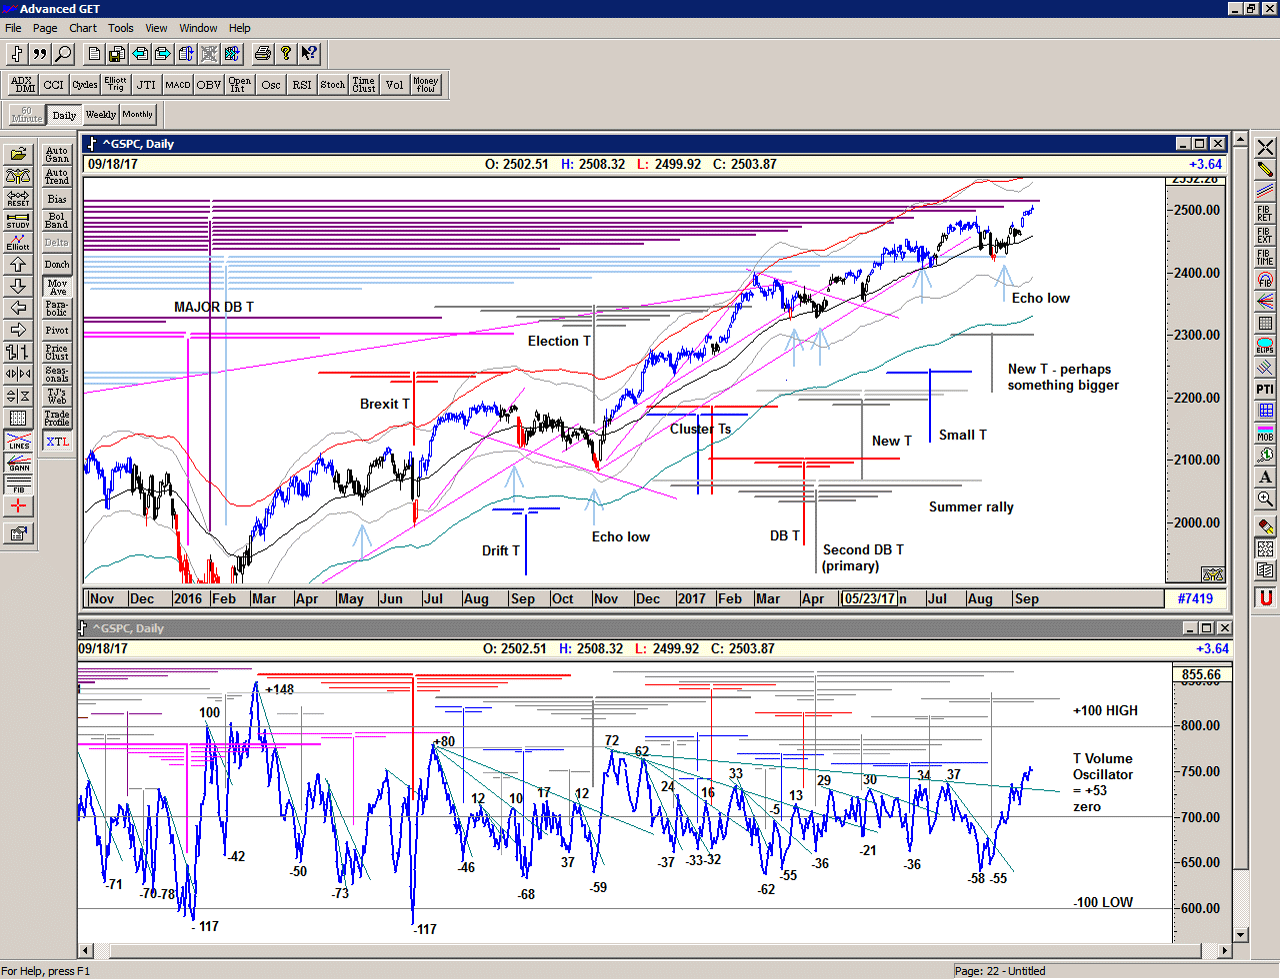
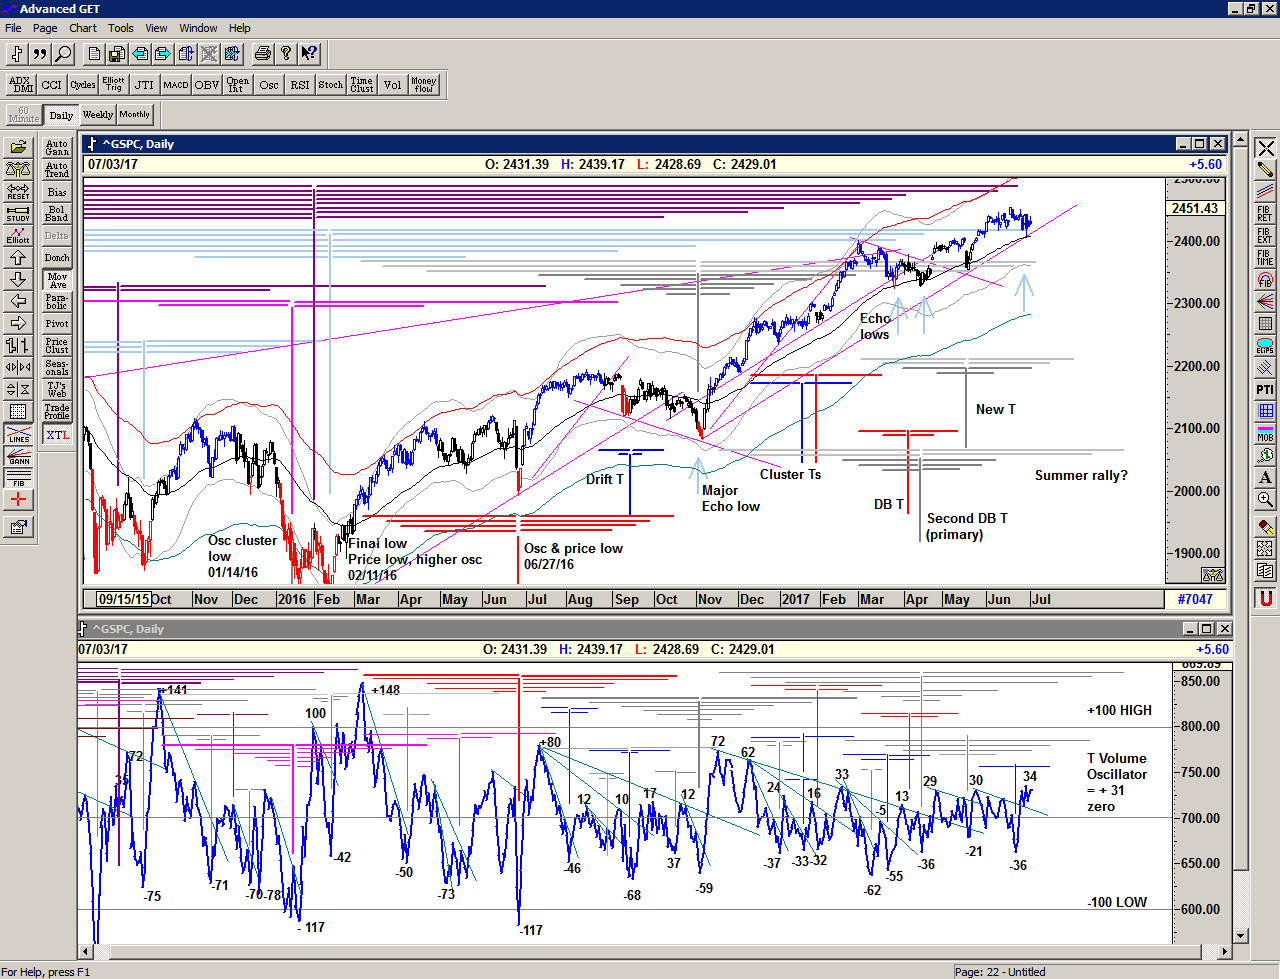
As we can see, the market has been pushing the boundaries (repeatedly) and it would seem that we may have hit some important target(s) in December.
The small T structures that developed towards the end of the Large(r) structure have been accelerating the momentum higher, and interestingly the combination of the smaller structures centred inbetween the 2 most recent oscillator lows (DB T) seems to have most accurately projected the 18-19 December peak, and projects another at the end of this week.
Although there are additional projections for upcoming highs, it would seem likely that we are now entering a sideways consolidation phase to absorb the current higher prices, and this is also backed up by the declining momentum of the OSc oscillator which is now close to Sell Signal. Although OSc sell signals may sometimes occur before price drops, they more accurately suggest that price will not move significantly higher, and that selling into strength or profit-taking may start occuring. However, the T volume oscillator remains relatively strong, for now.
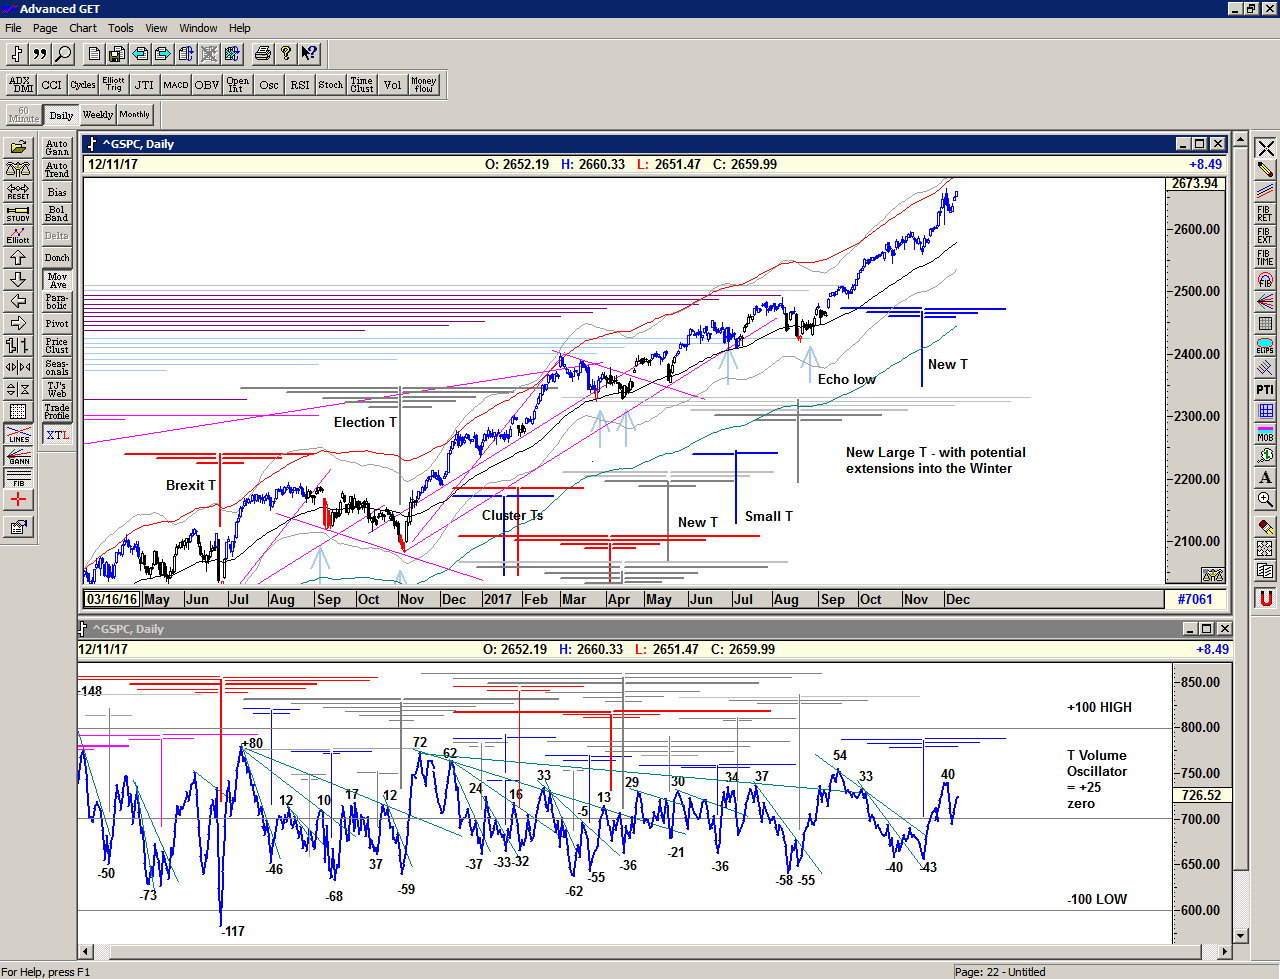
Save the image to your desktop to view a larger version
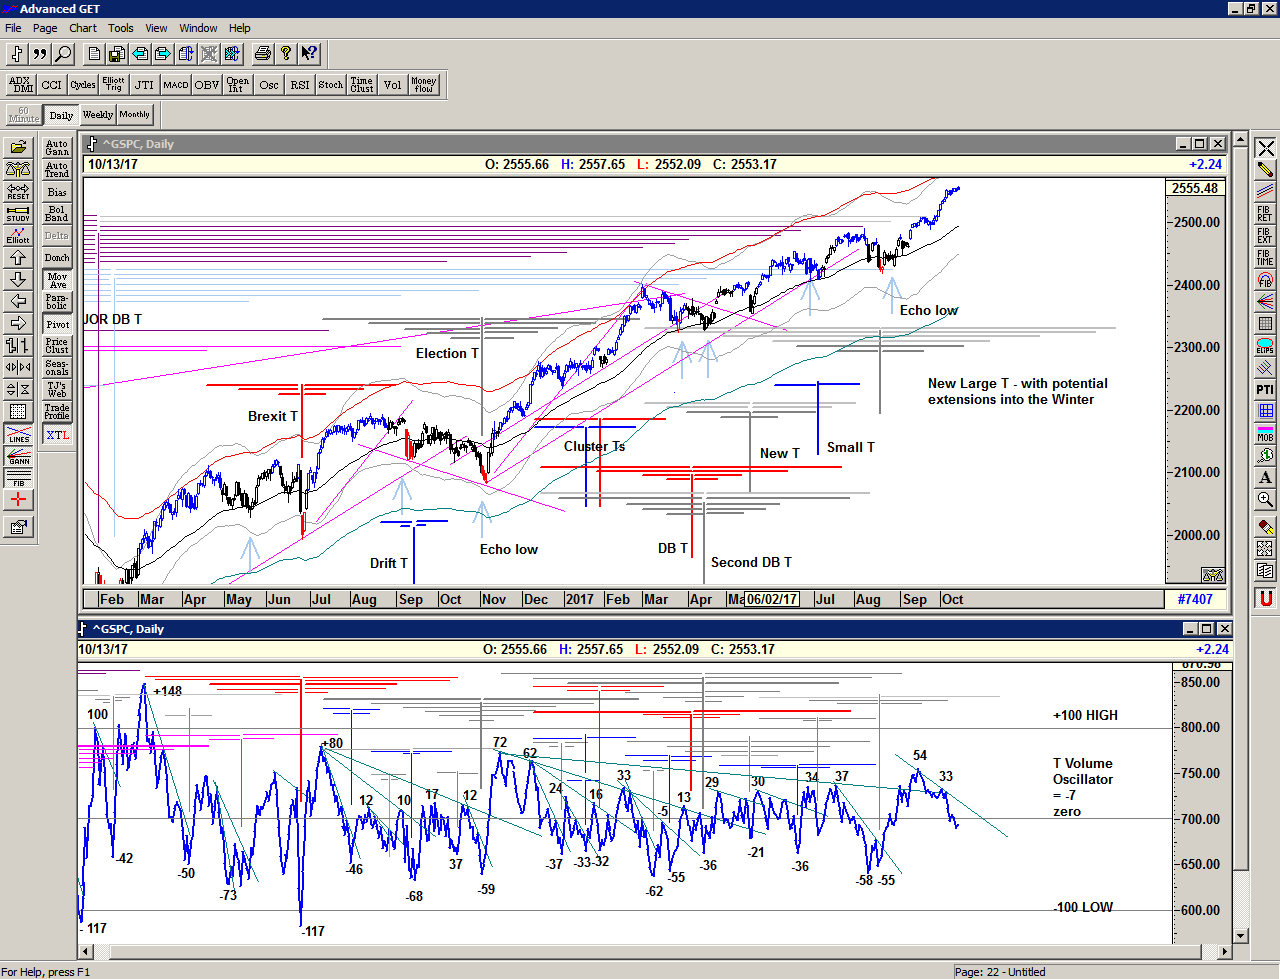
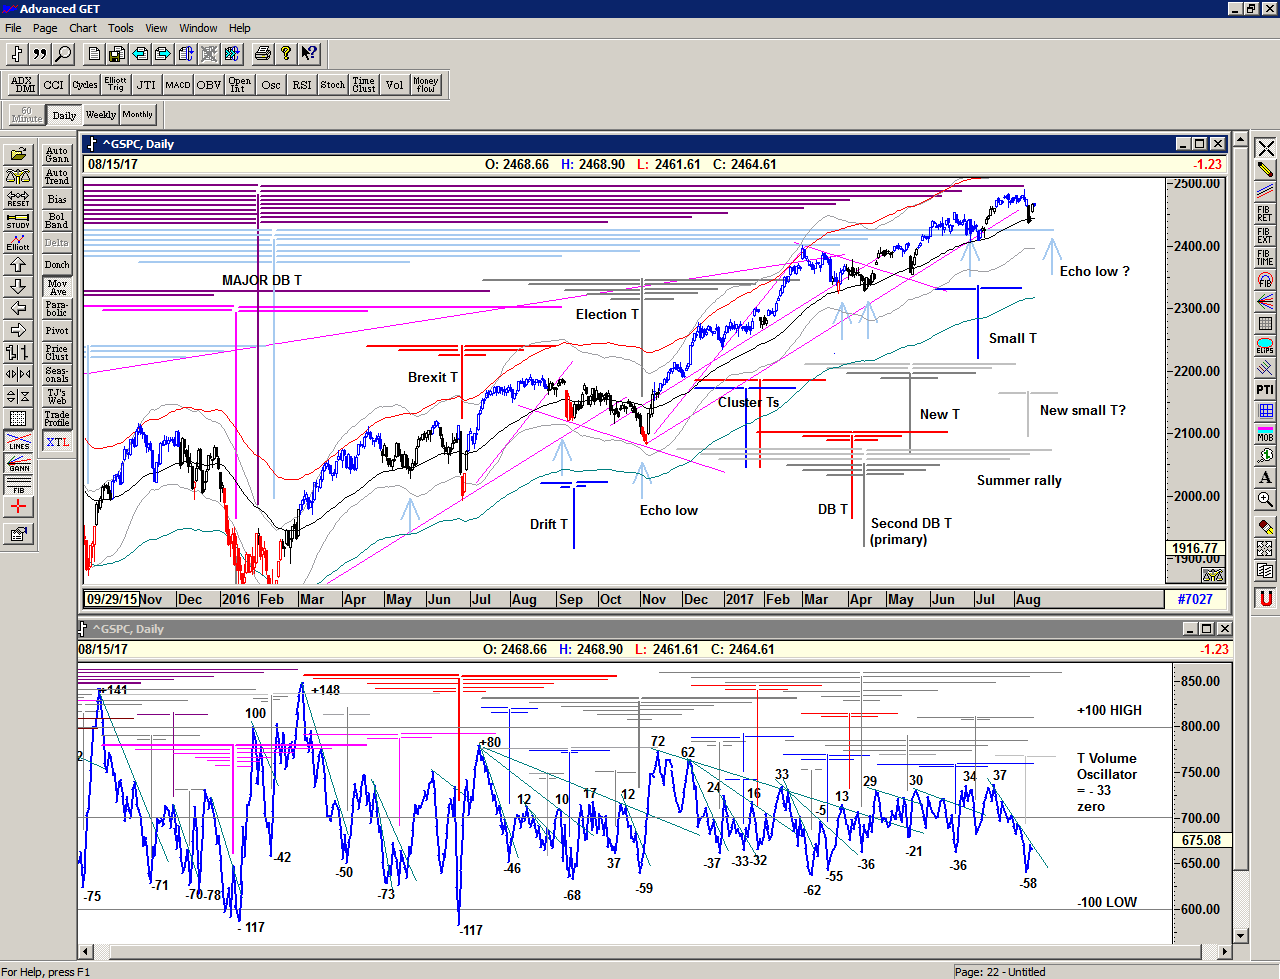
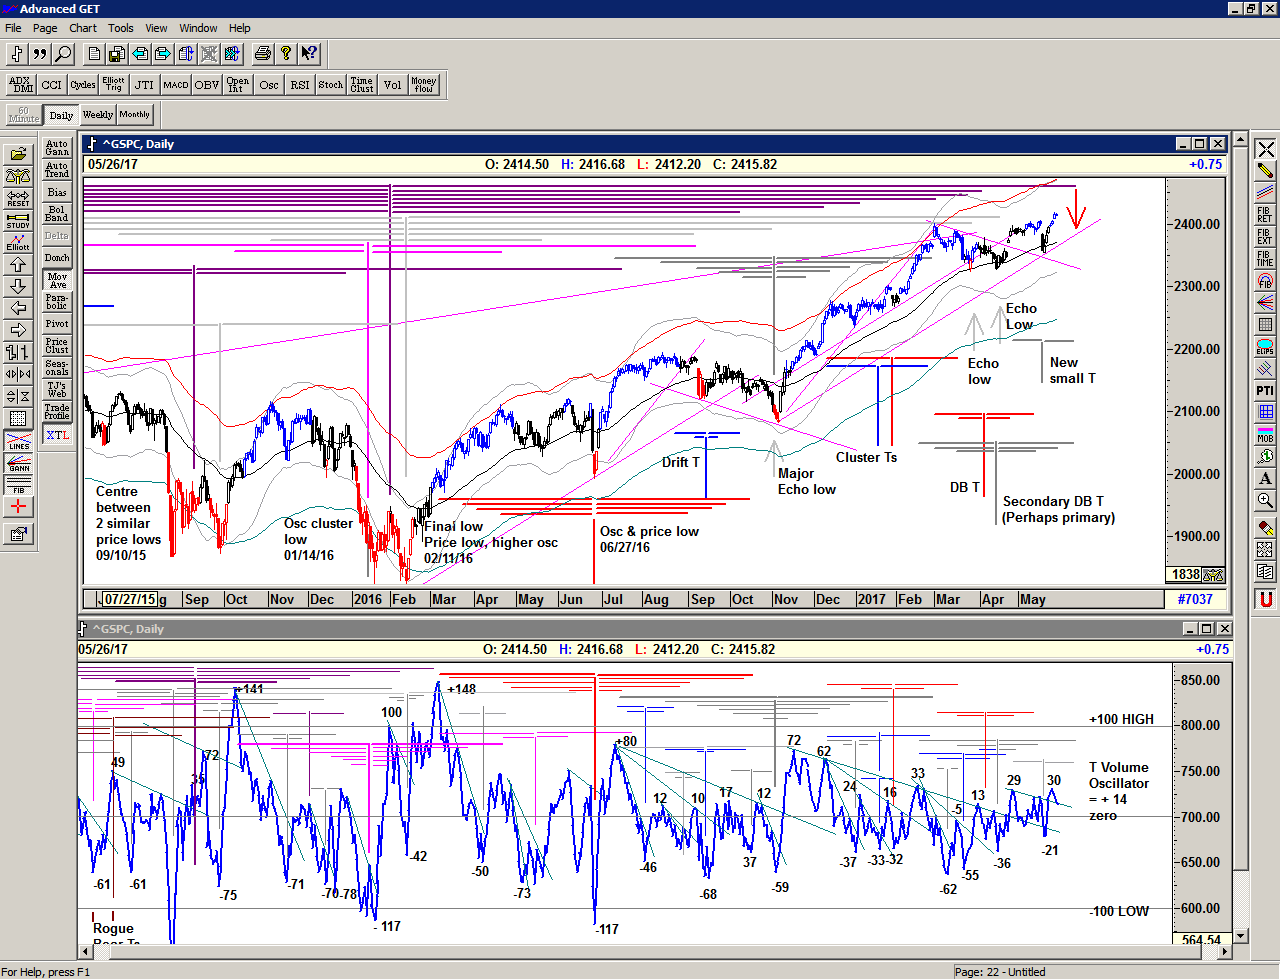
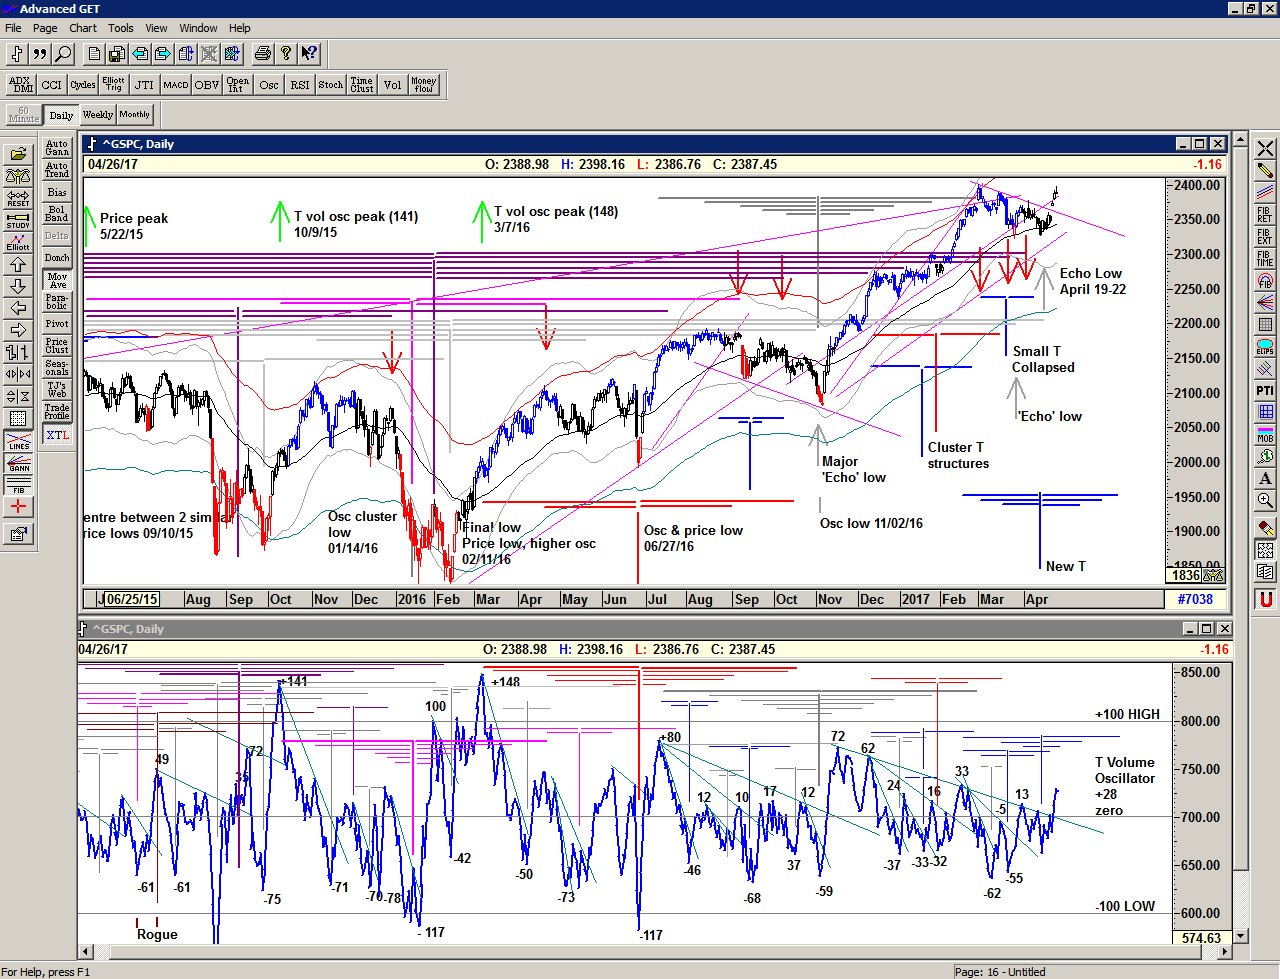
Looking at the bigger picture with the T volume oscillator underlaid, we can see what a good signal we received on 11 September when the oscillator rose above the long cash build up line, making a new relative high. The subsequent 'pullback' in the oscillator as the market continued higher was all the 'correction' that was needed to provide the fuel for the newer T structures. In effect the downward movement of the oscillator describes profit-taking and therefore the build up of cash on the sidelines waiting for re-investment.
Note that the oscillator has recently made another new relative high, and this potentially re-activates that long cash-build up line again, whilst also making what appears (at the moment) to be a blow-off exhaustion type peak. This bodes well for future advances, though suggests some caution first.
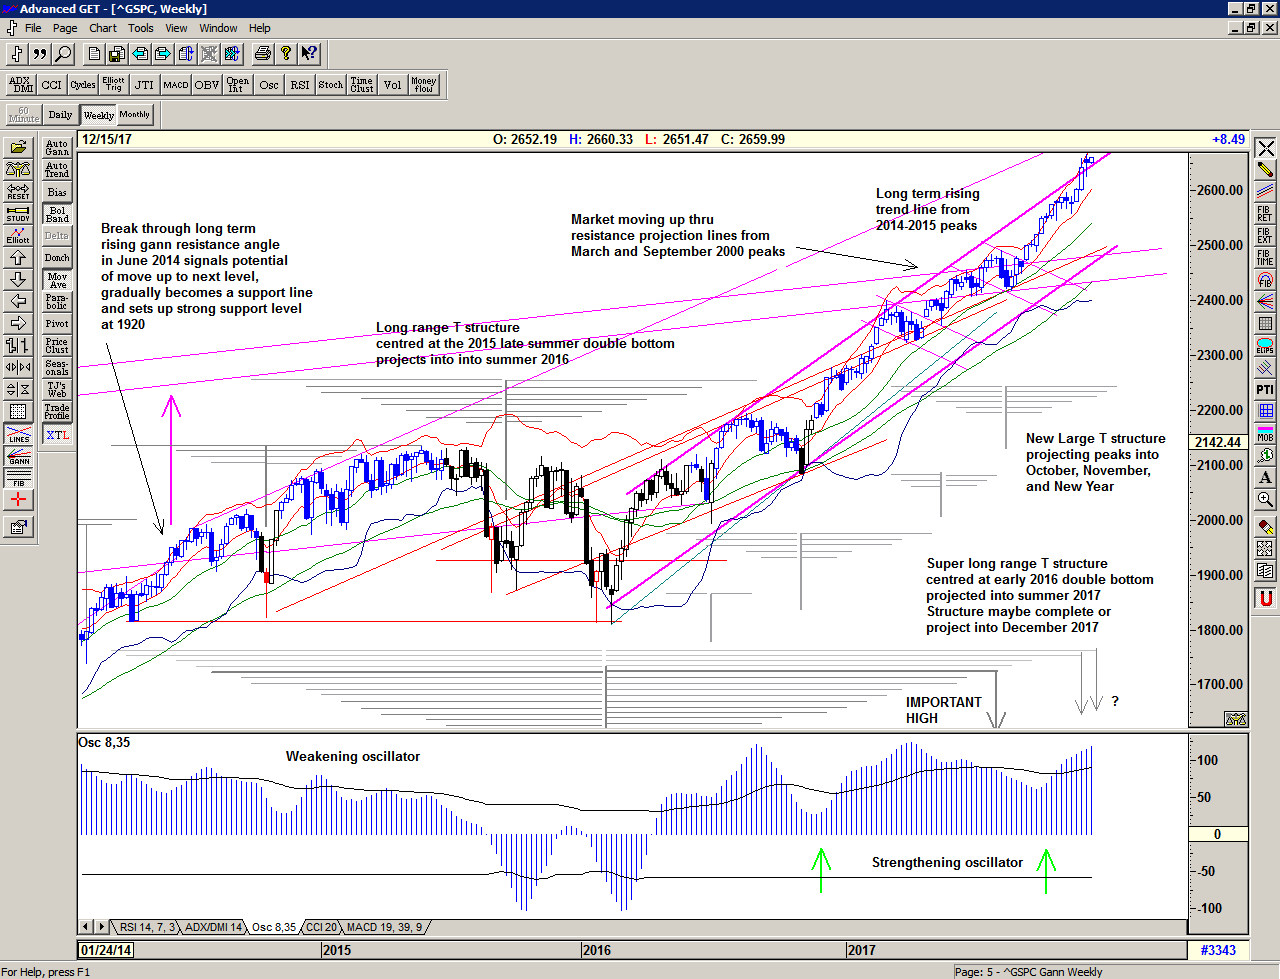
Save the image to your desktop to view a larger version
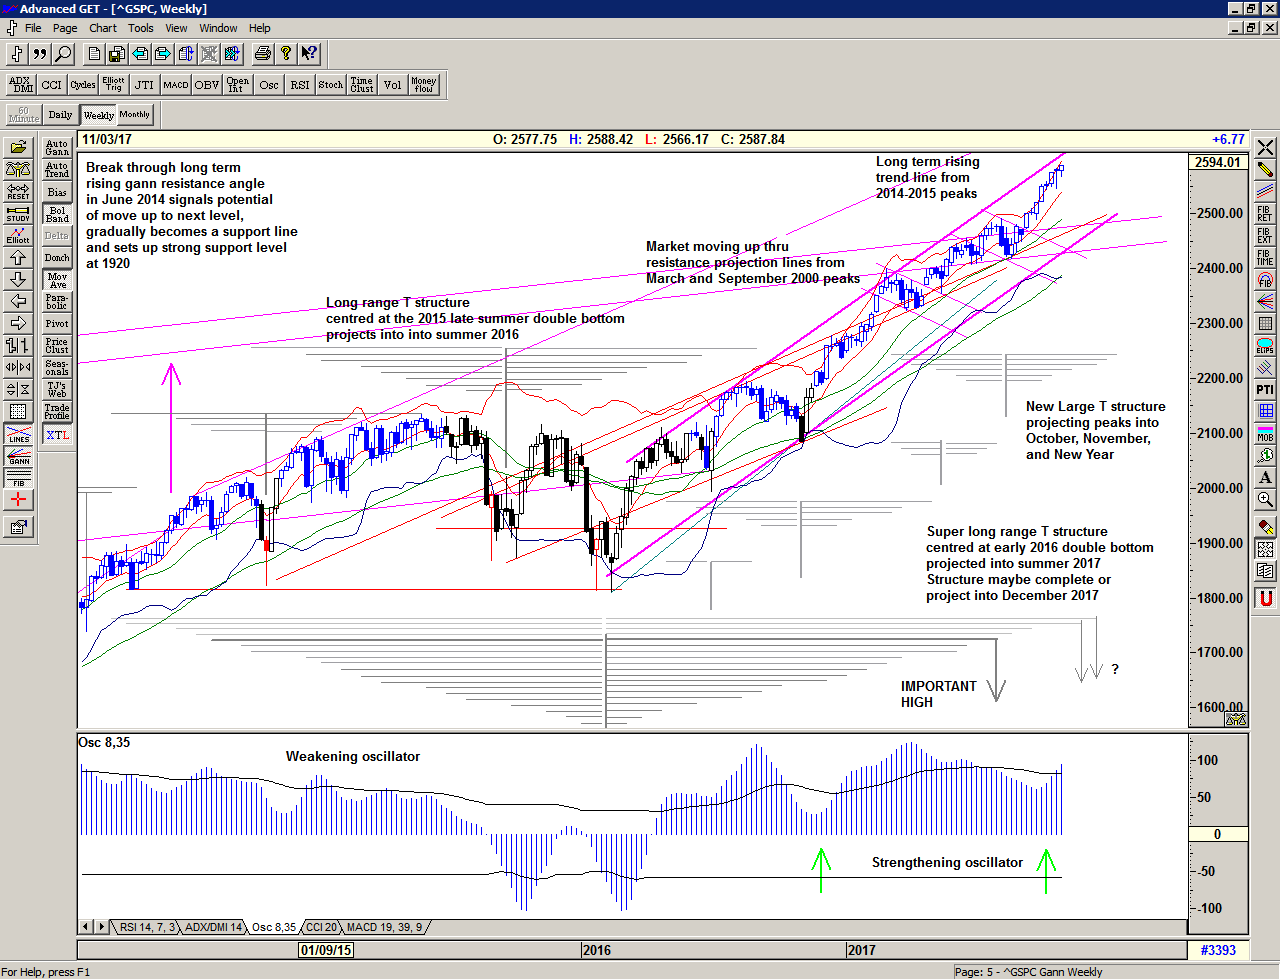
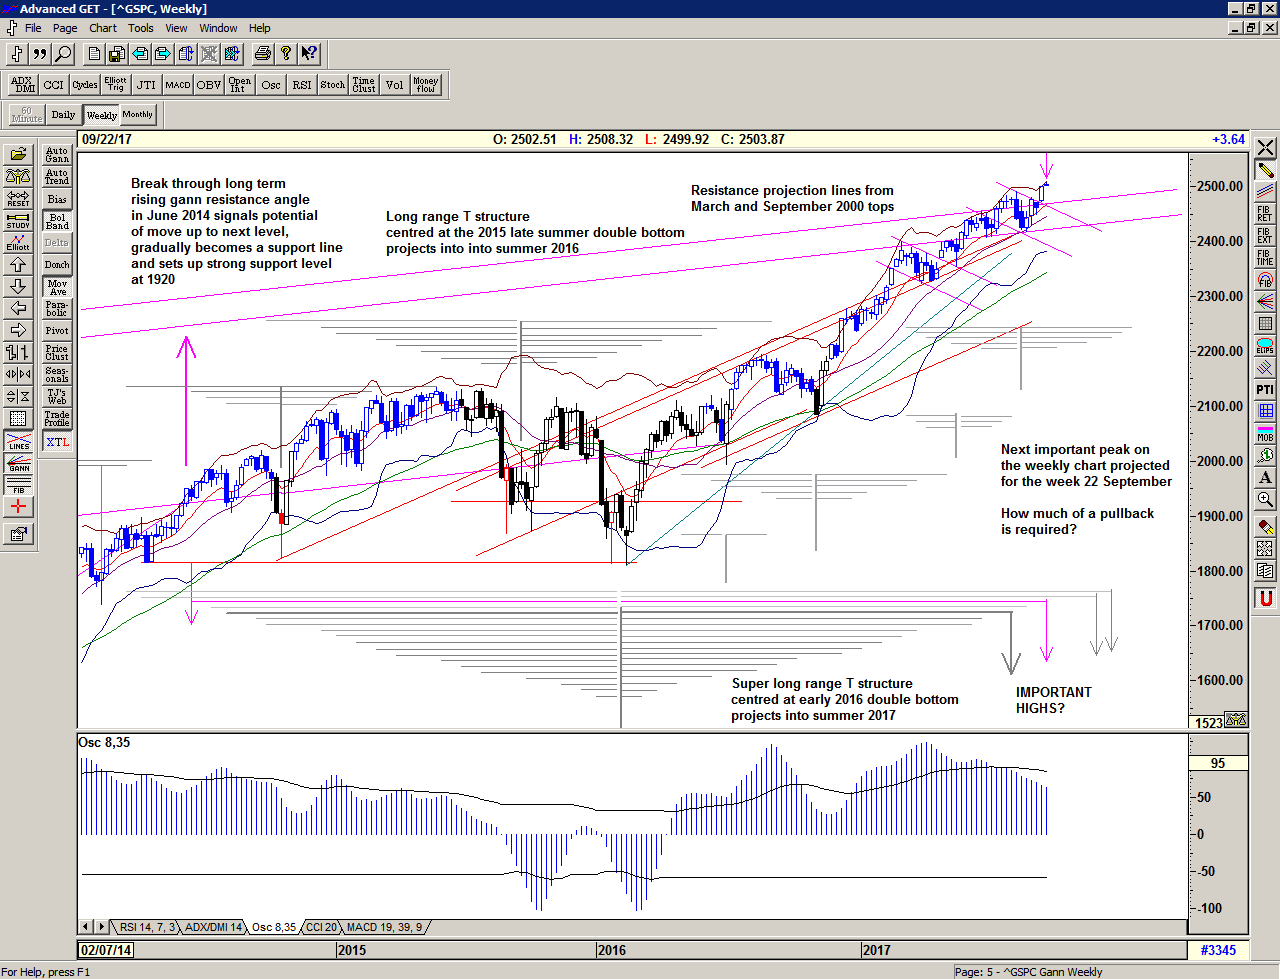
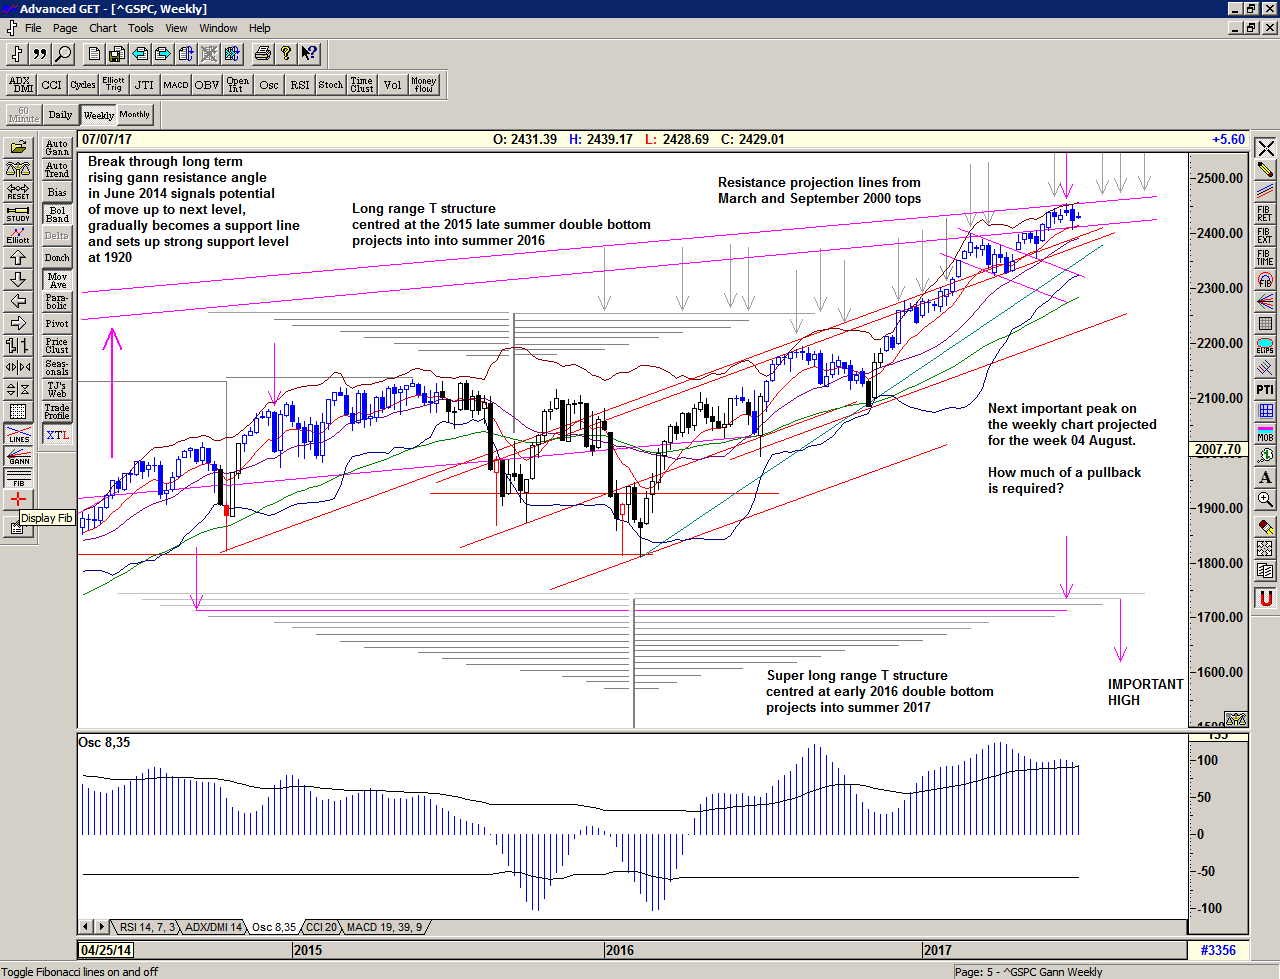
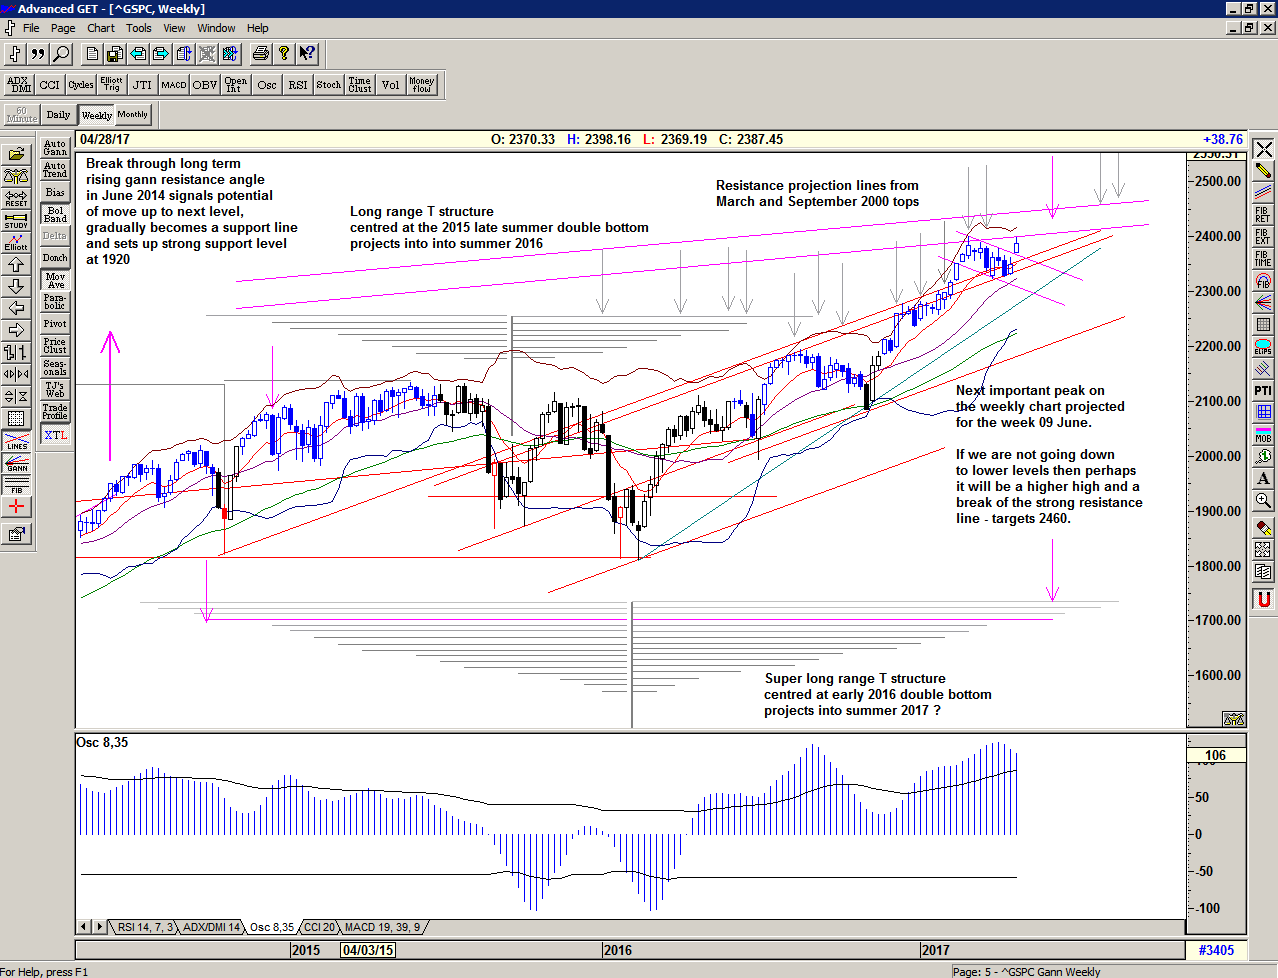
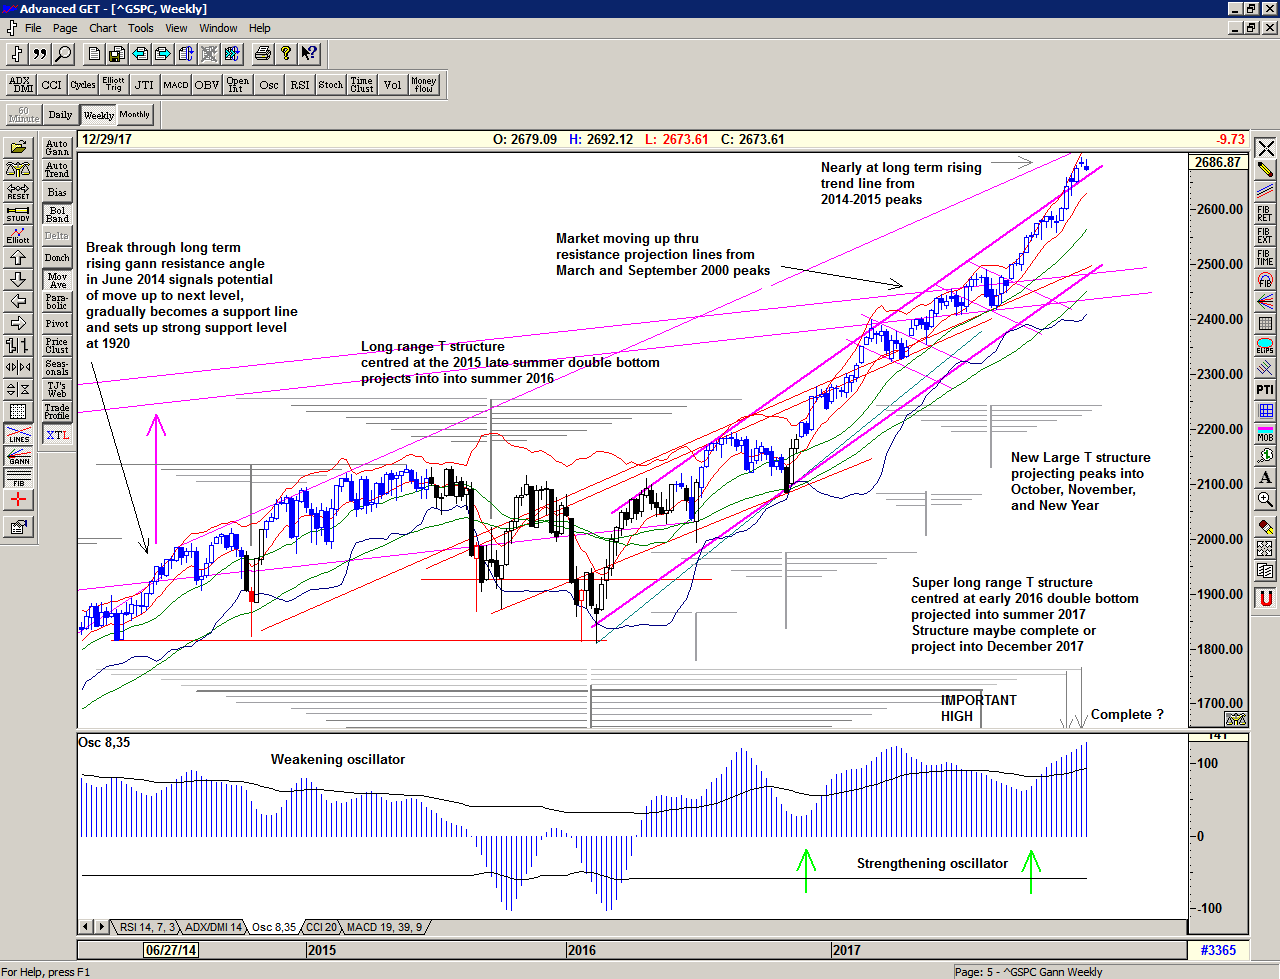
On the weekly chart we can see that the market has been rising towards the long term term rising trend line, and is nearly there. At the same time, we did have a possible completion of the Super long range T structure projected for early and late December – and that may well explain the additional volatility that came into the market in December.
And so it appears that the market is exactly where it should be, and it has synchronised in time and price, establishing important new highs, close to projected peaks and close to an important trend line.
What happens next is likely to be corrective, but either in price or time, or perhaps both. We will keep a close eye on the oscillators and watch how price responds. Keep an open mind – the market looks a bit over-heated, but remains firmly bullish, for now.
–
Be prepared for what is coming next and trade with confidence:
For more detailed ongoing analysis of the developments in the S&P500 index on a daily basis, as well as my personal Buy and Sell Signal trigger levels, please Sign up for daily Alerts & Observations. This includes access to the Members Area for an archive of all of my alerts and updates and my Explanatory Notes pdf which gives detailed explanations on all of the concepts being discussed.