Pandora’s Box
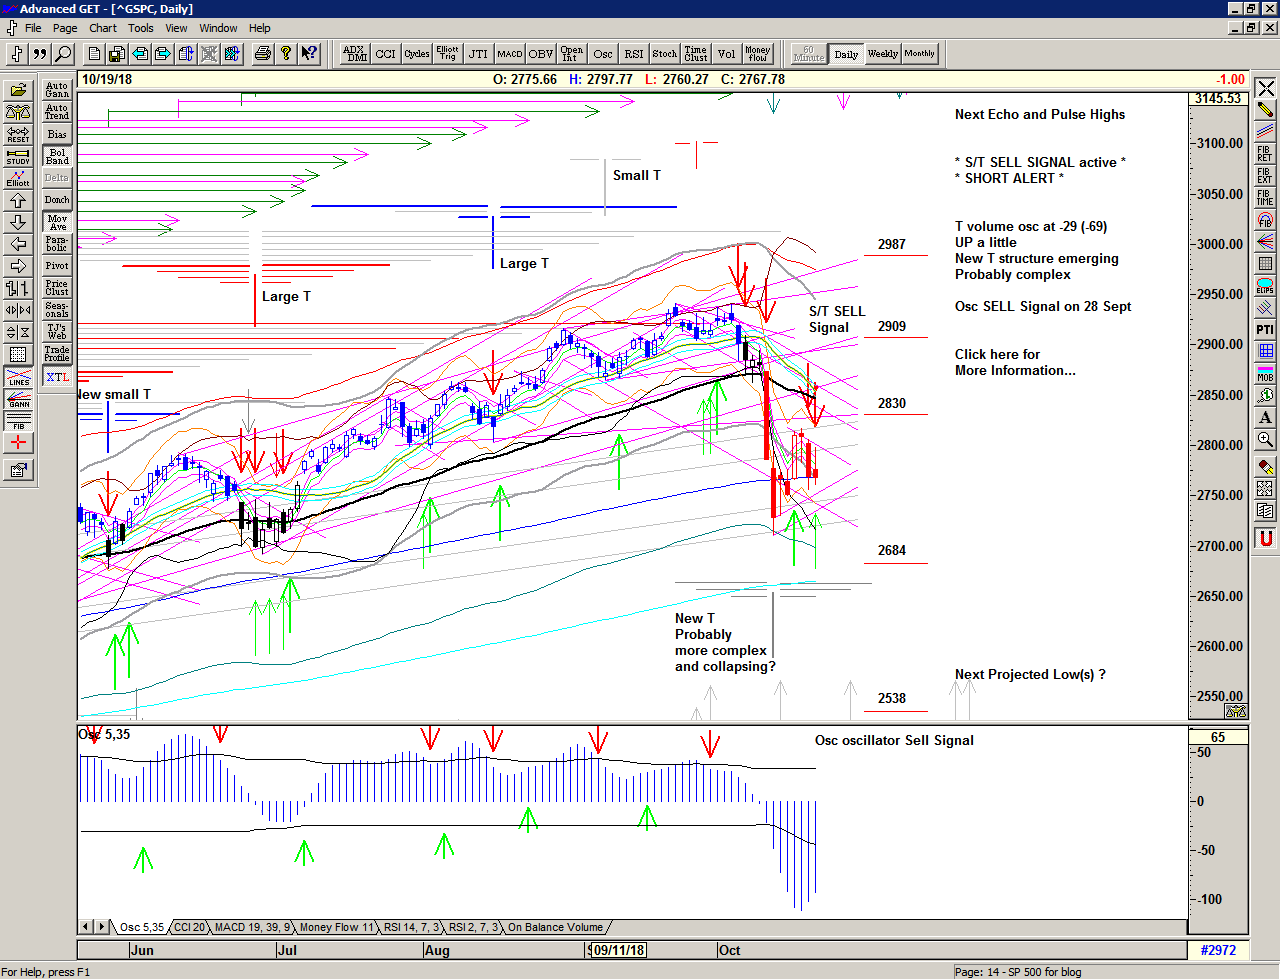
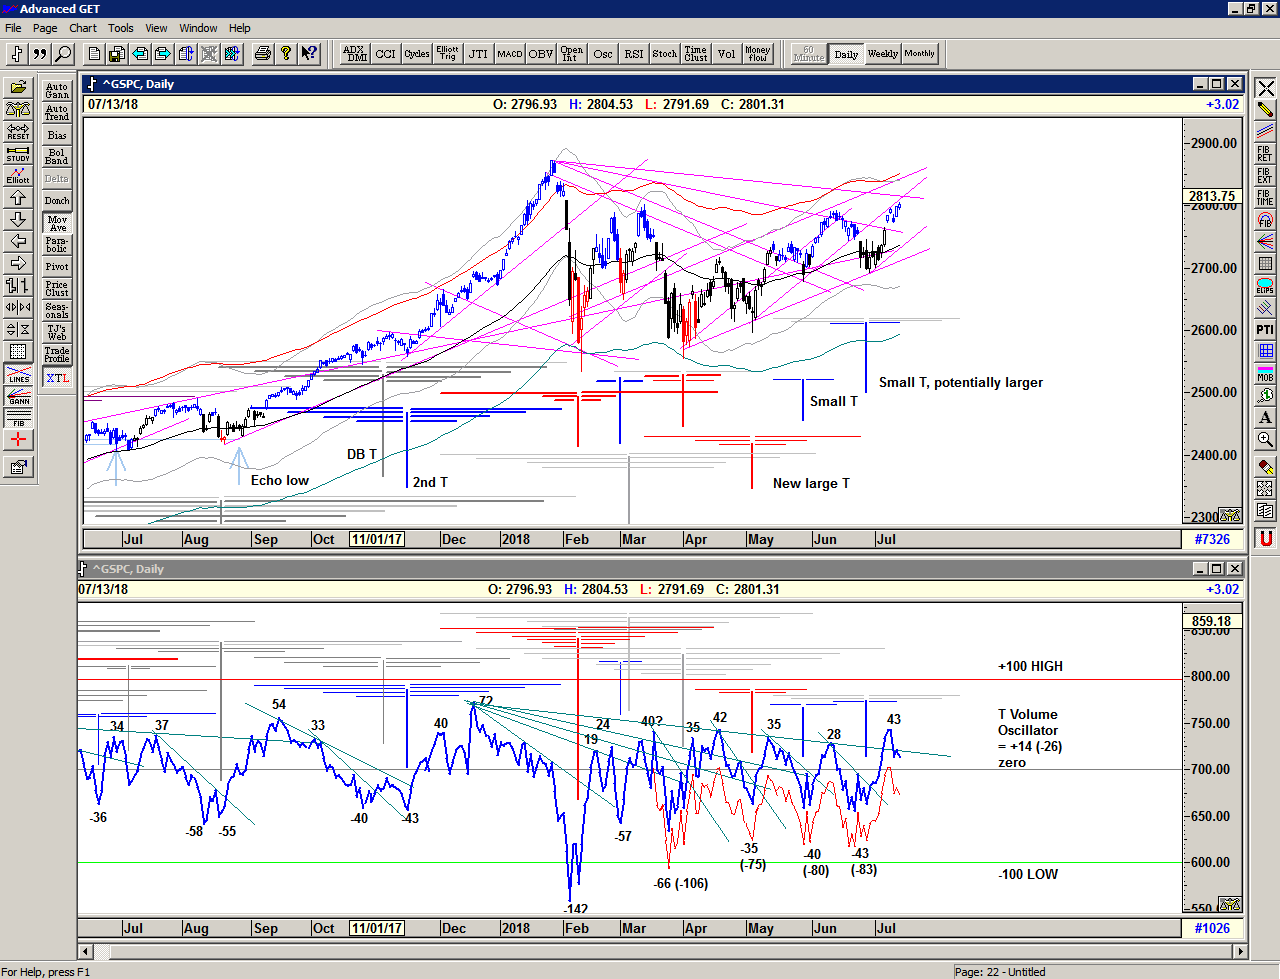
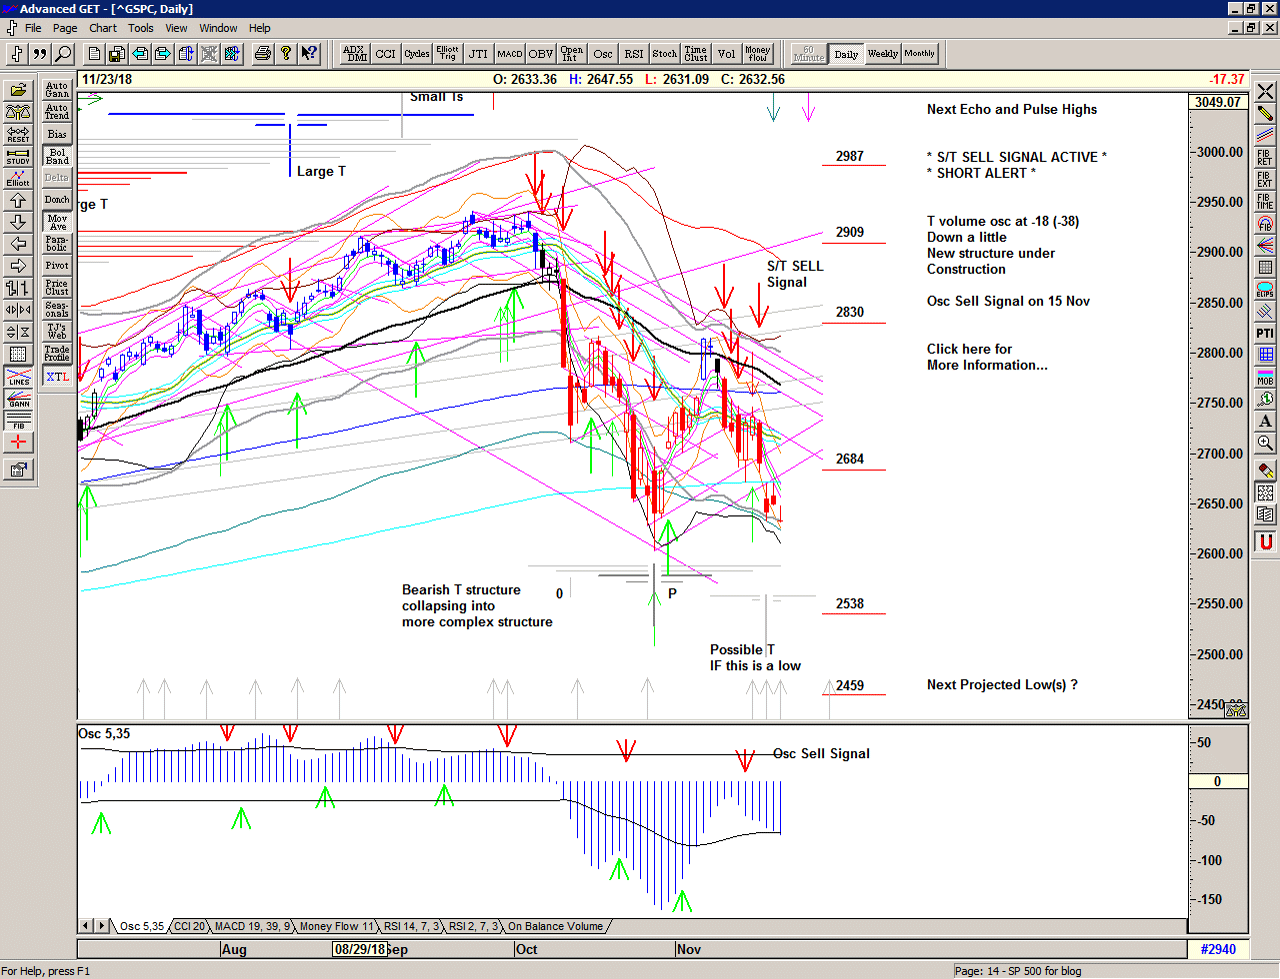
The brief and dramatic recovery off the late October low saw the market back at 2815 before reversing back lower. A bounce at 2670 in mid November looked promising but again the market succumbs to declining forces and here we are again, back at the previous primary low.
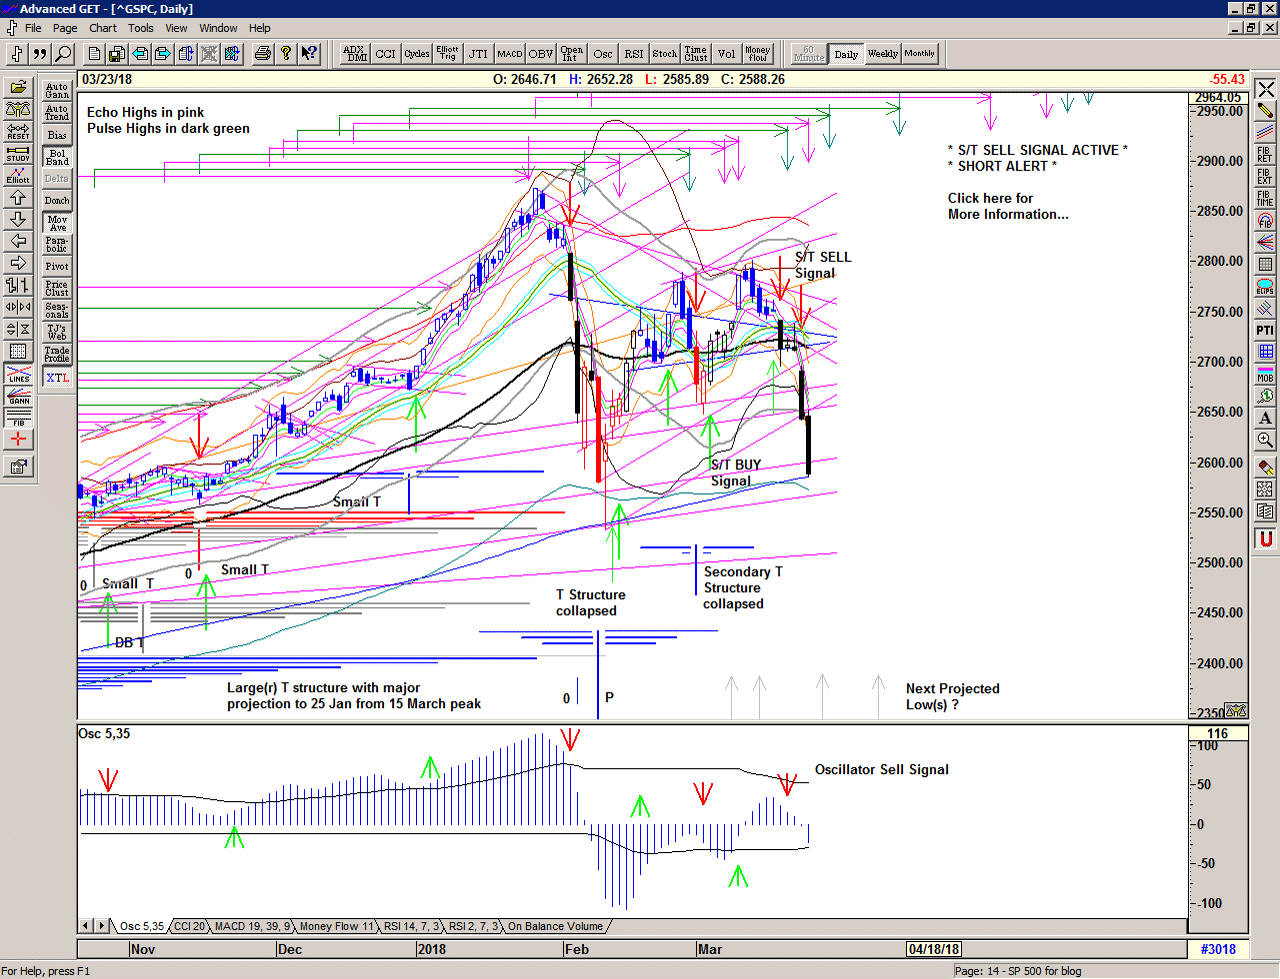
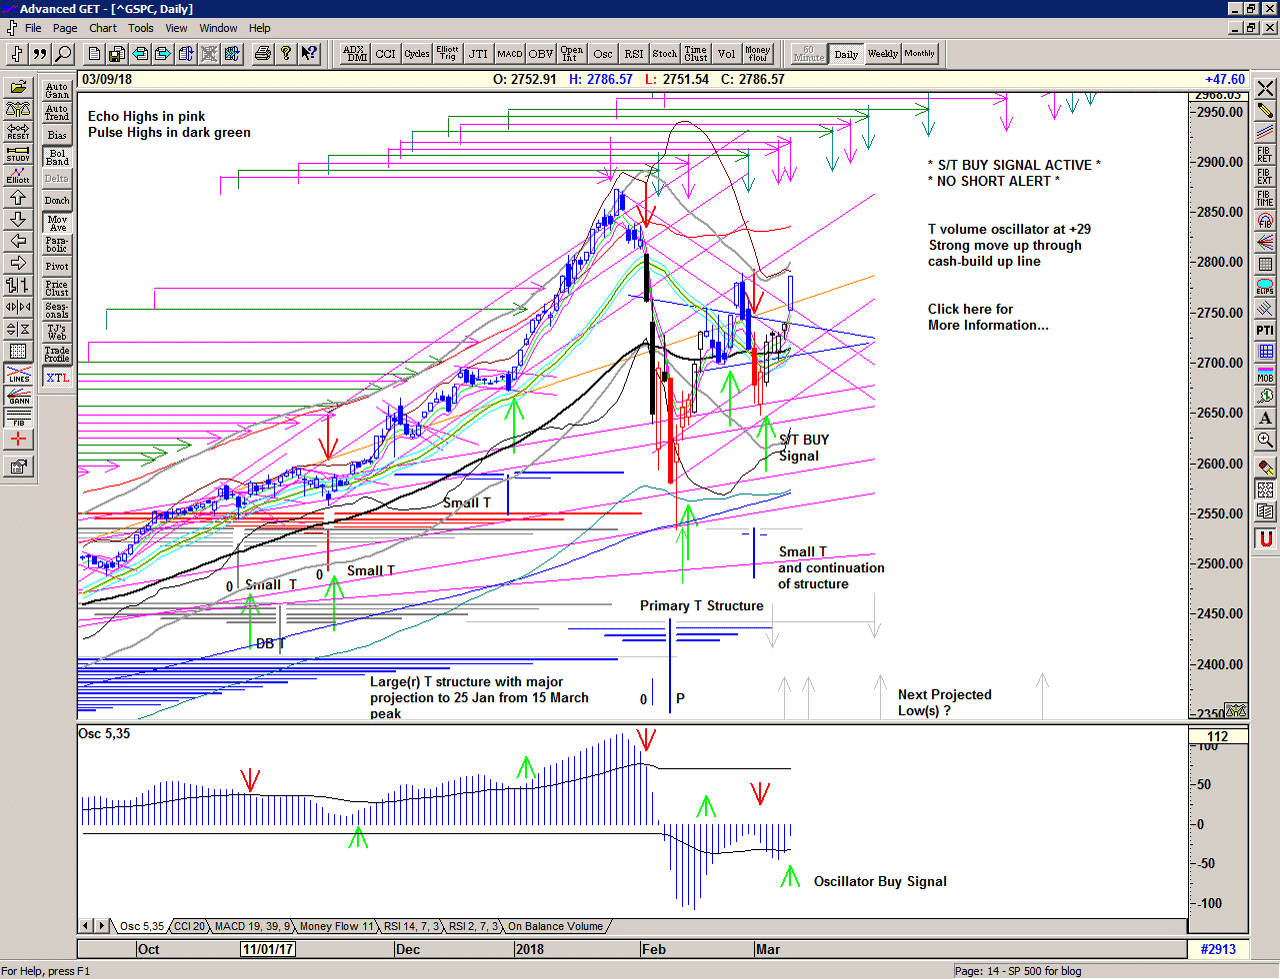
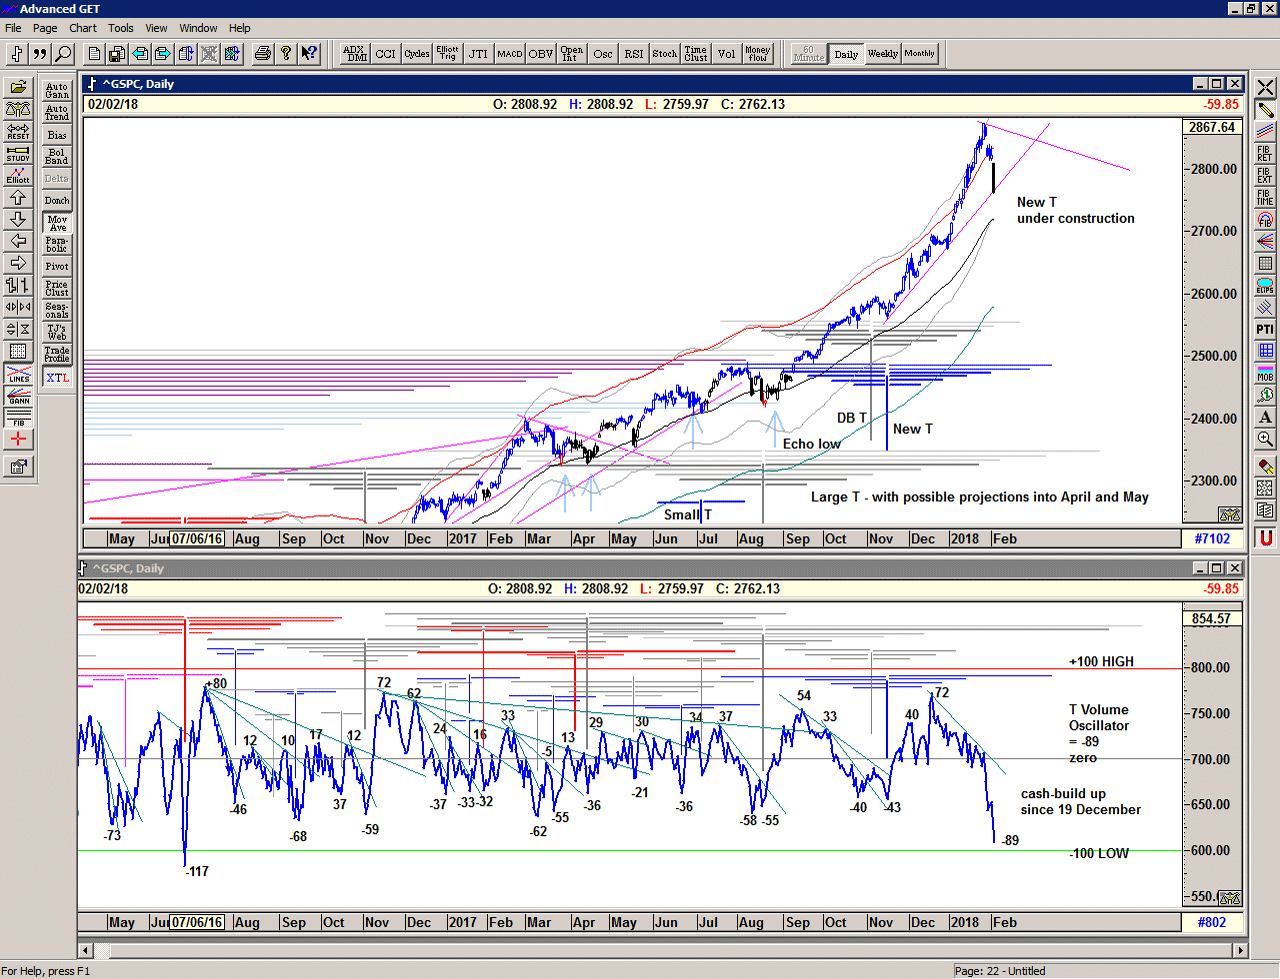
The strong rise off the October low had all the early signs of a potential V shaped T structure which projected a series of initial highs into 08 November, but at that point the rapid decline (in price and oscillator) started to flash some strong warning signs as the structure turned increasingly bearish.
When a T structure collapses it will morph into a larger and more complex structure, and we must revise our expectations as the market looks for a secondary or another primary low.
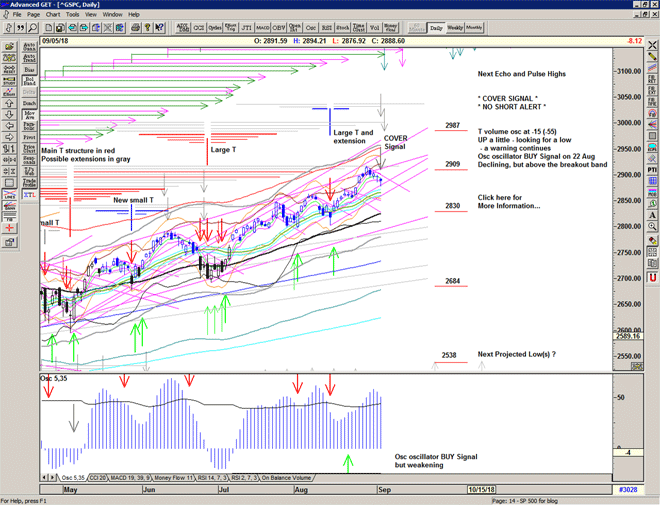
We are now seeing trade in the region of an important pivot, hence the previous strong bounce. If breached it opens up Pandora's Box for significantly lower prices.
Save the image to your desktop to view a larger version
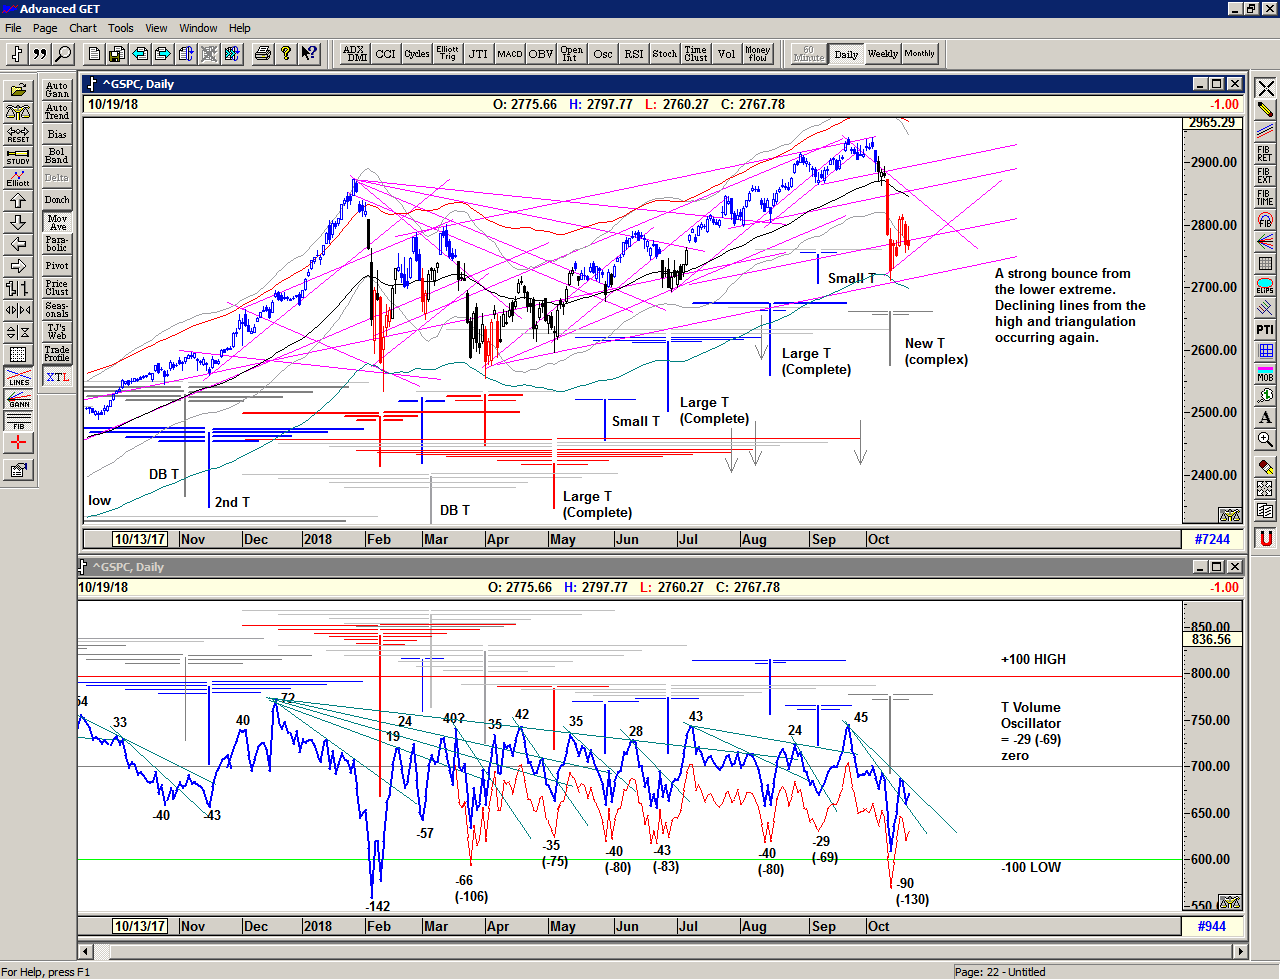
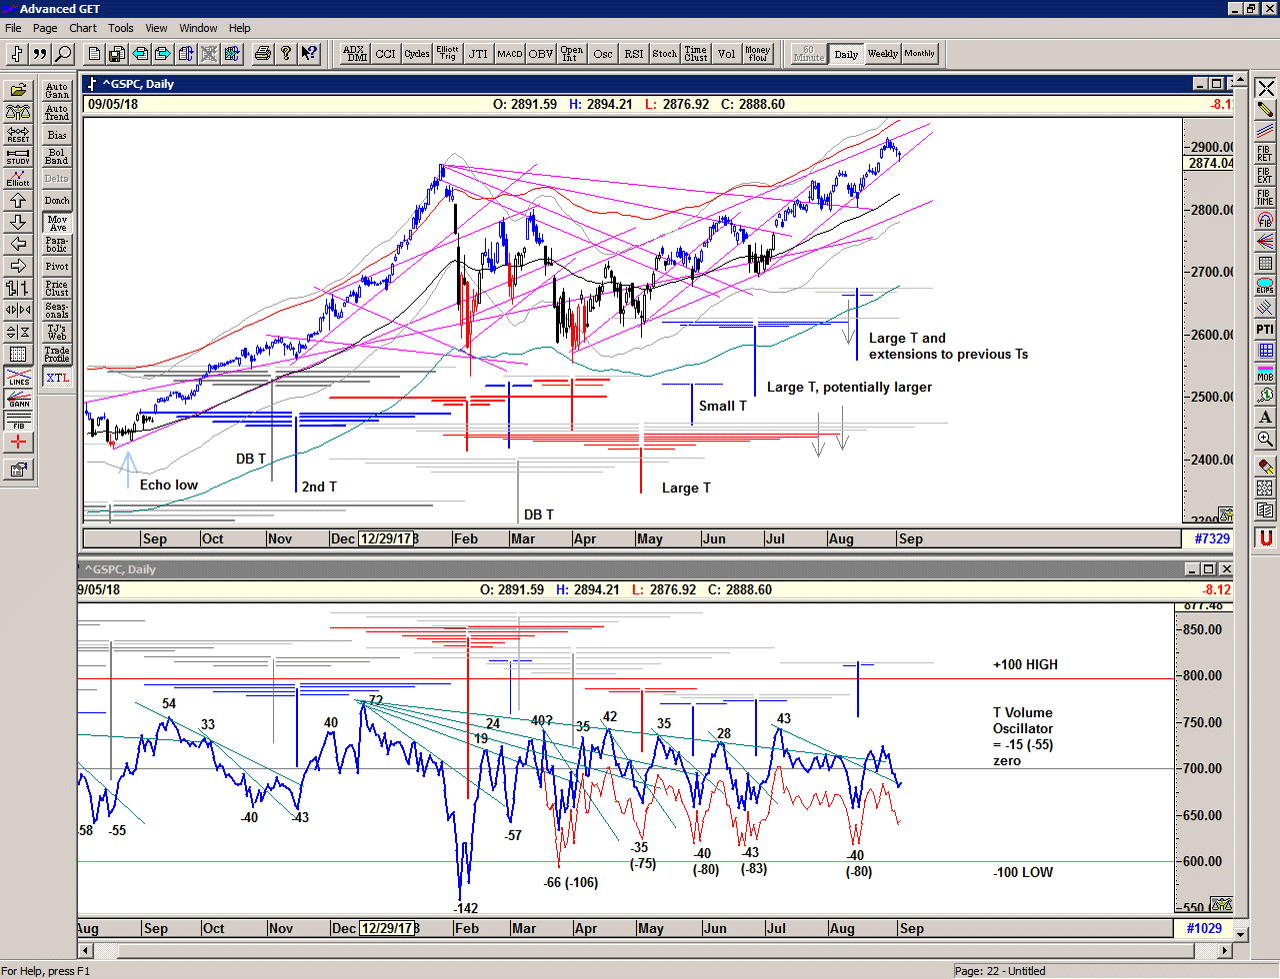
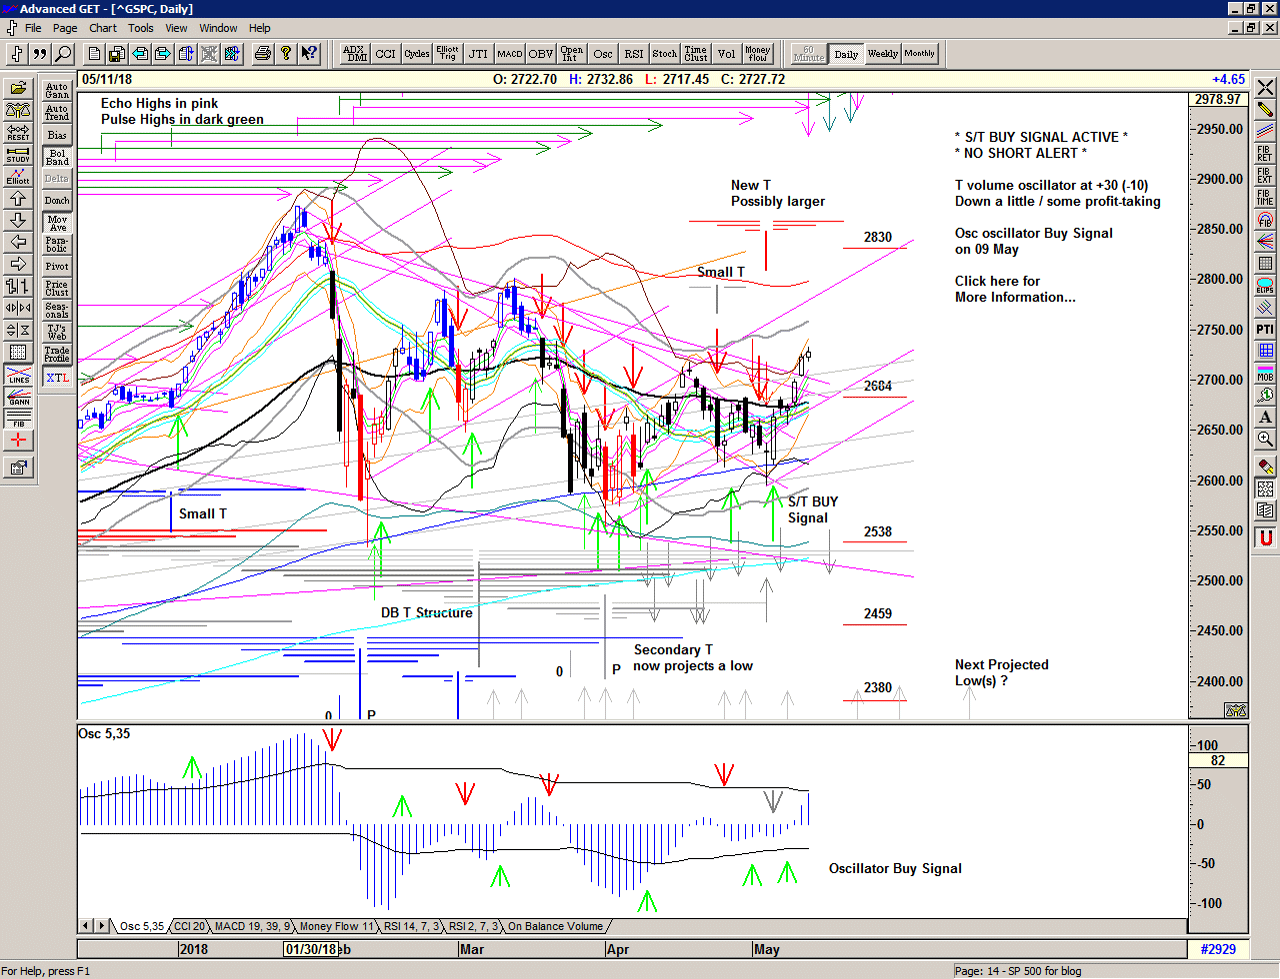
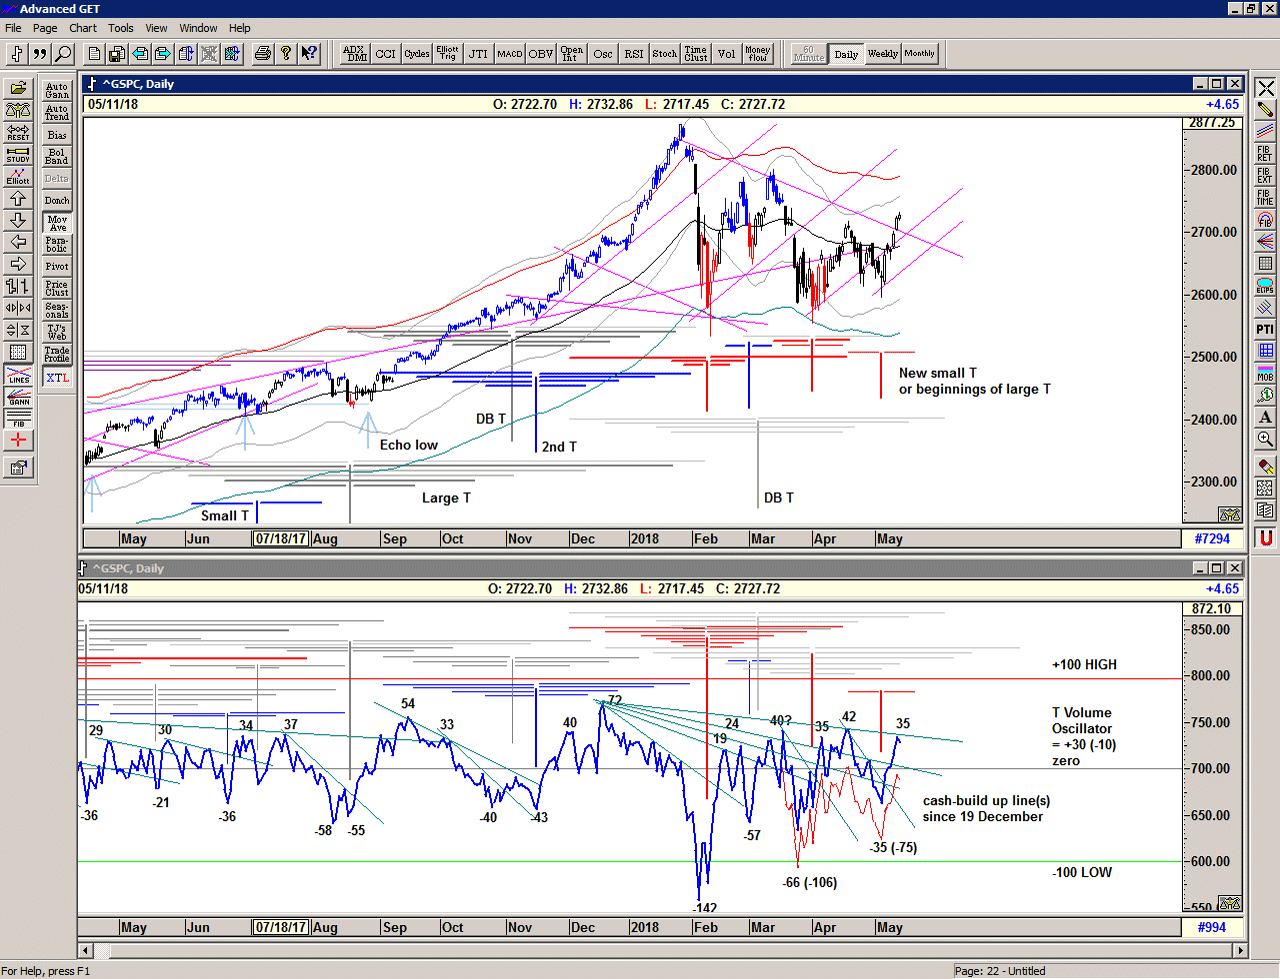
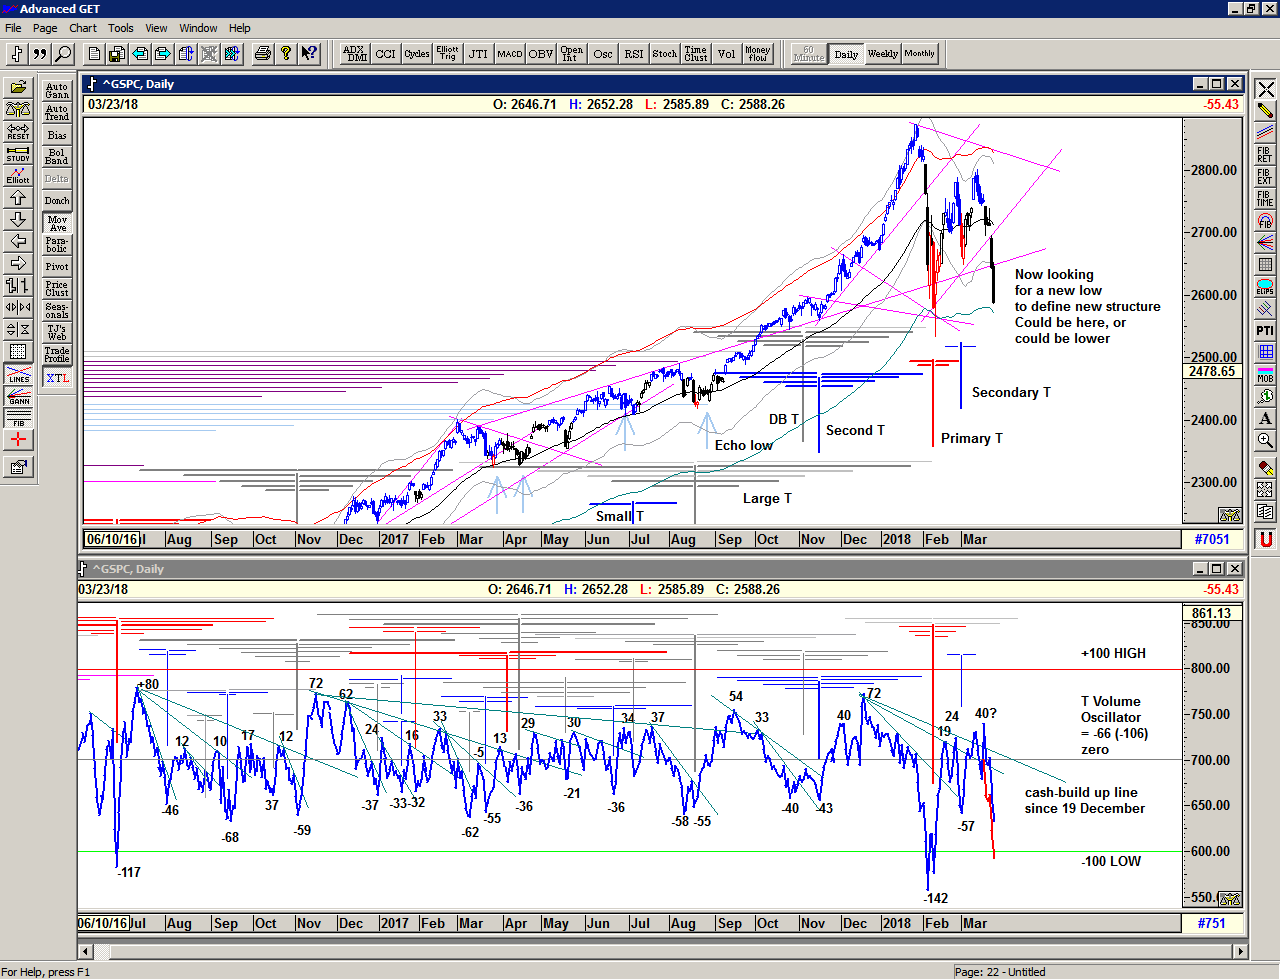
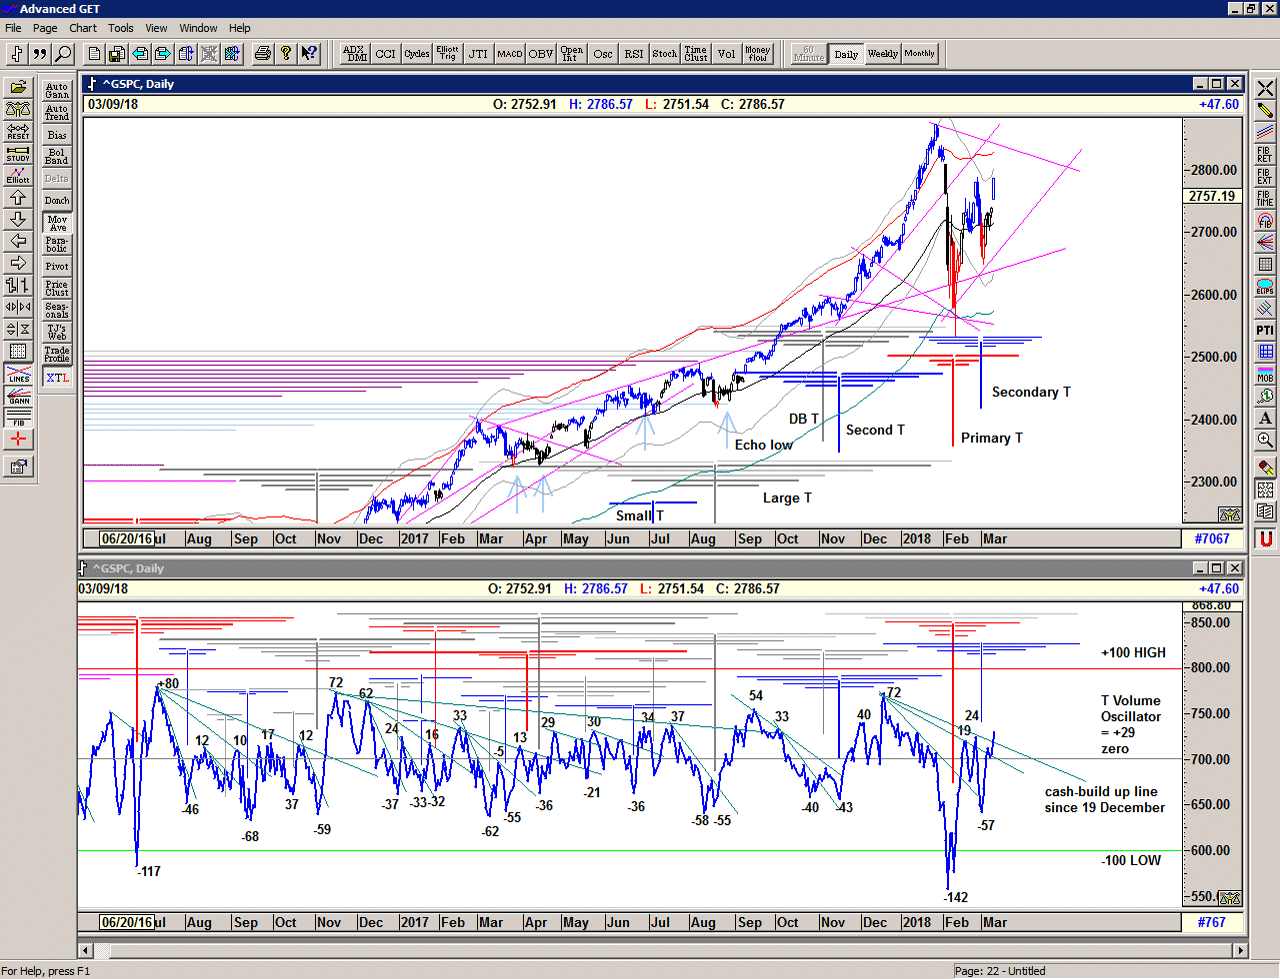
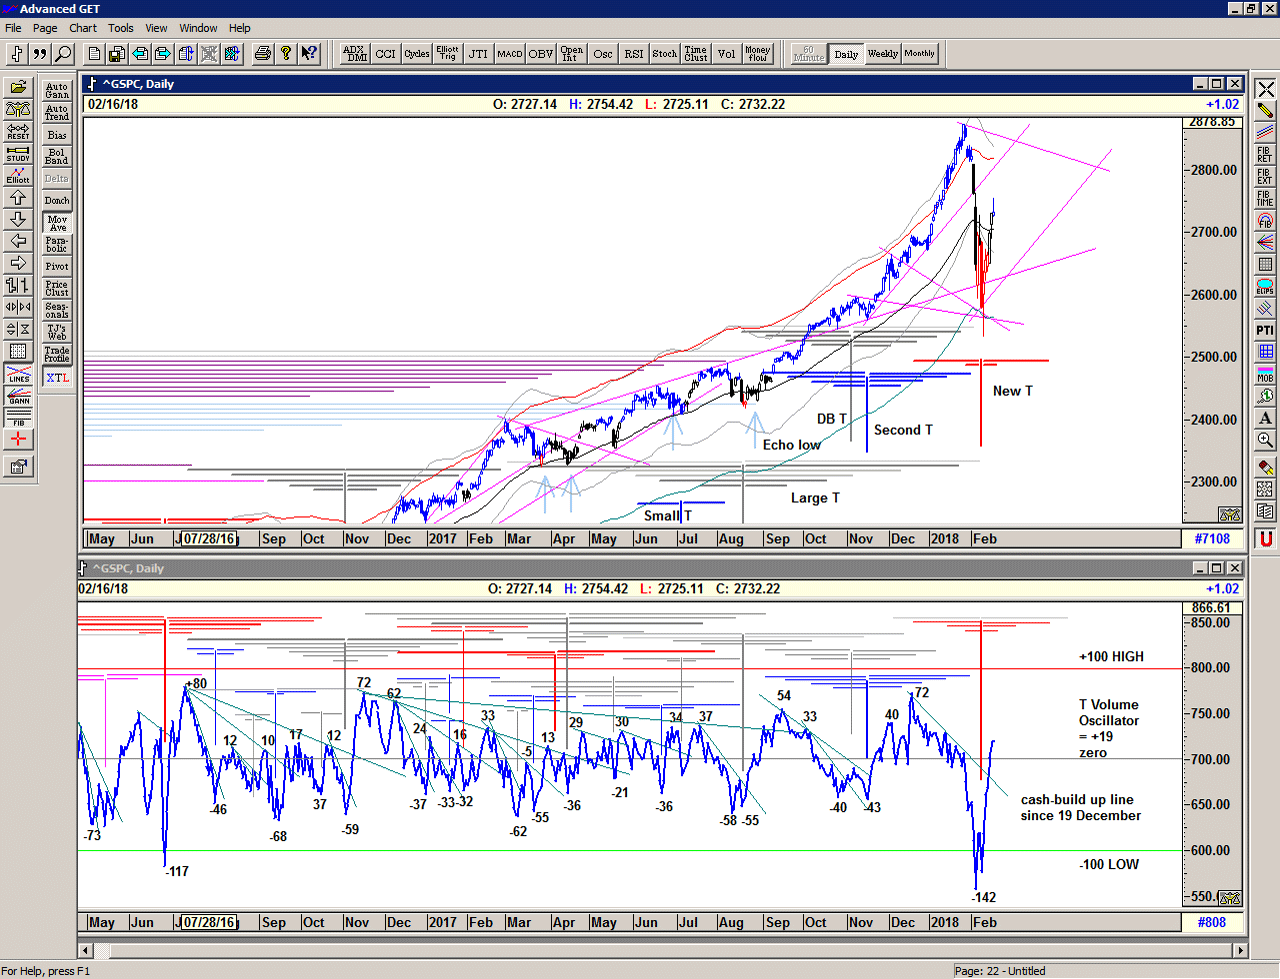
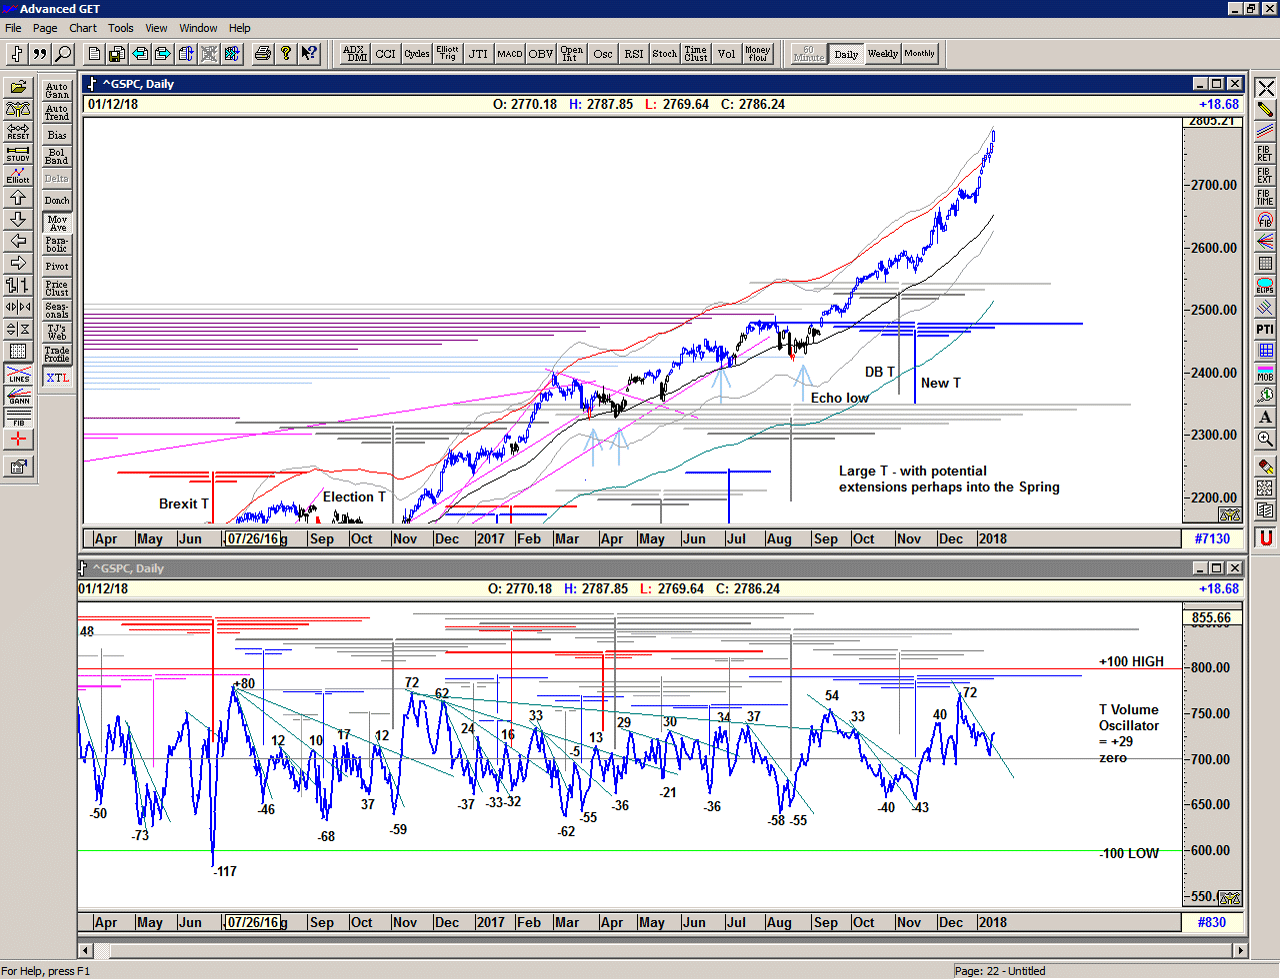
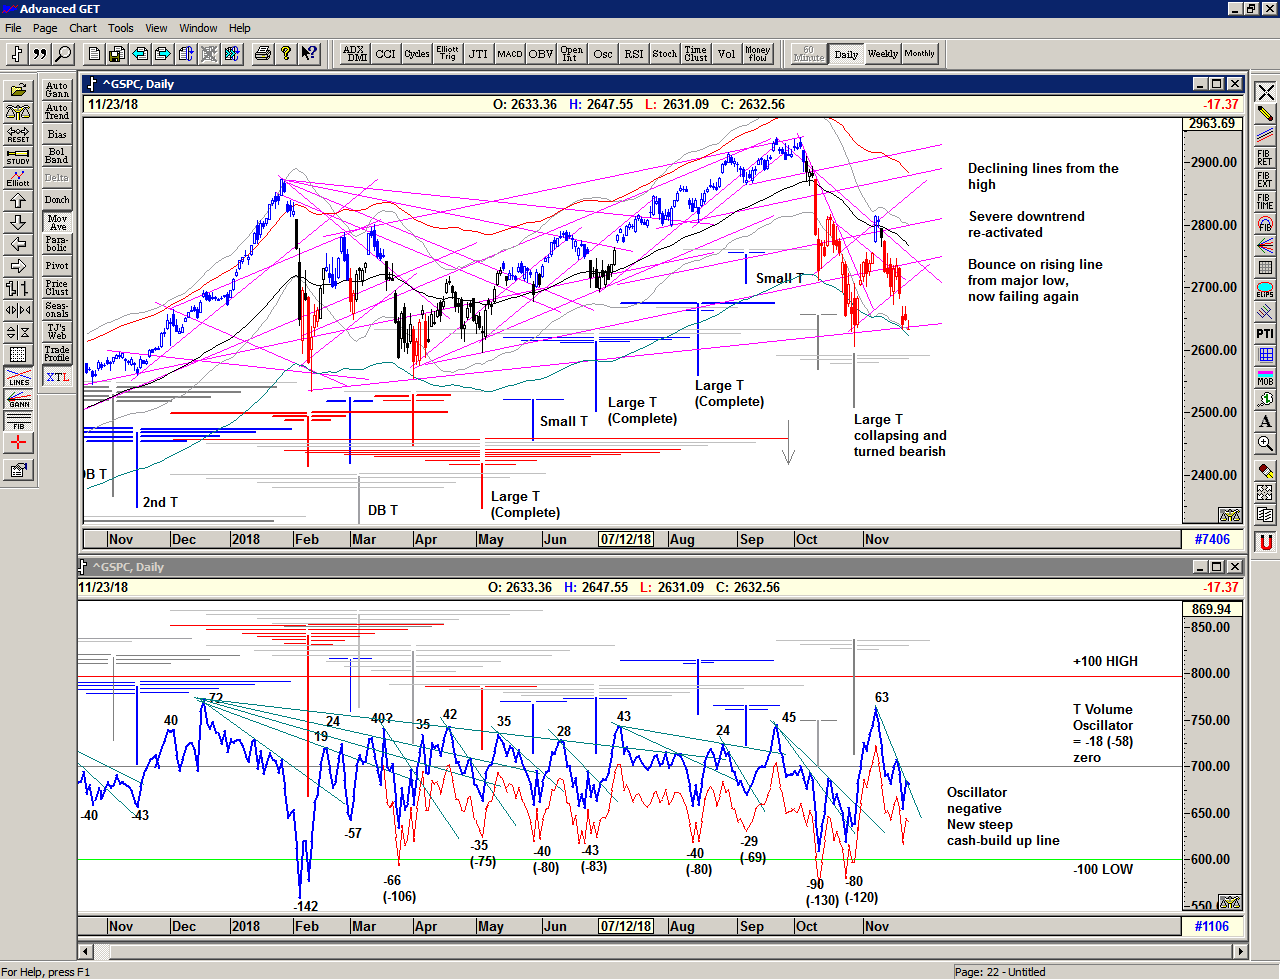
As we can see from the chart below with the T volume oscillator, the rise off the October low was indeed very strong with the oscillator making a new high. We can see the T confirmed by the oscillator moving upwards through the previous series of declining highs in the oscillator – the cash-build up line – and it should have projected highs on 08, 16, 23 November and 04 December. But the rapid decline in price and in the oscillator on 12 November hinted at a problem as the T structure collapsed and turned very bearish, providing fuel for the downside. We haven't seen this for some years.
Save the image to your desktop to view a larger version
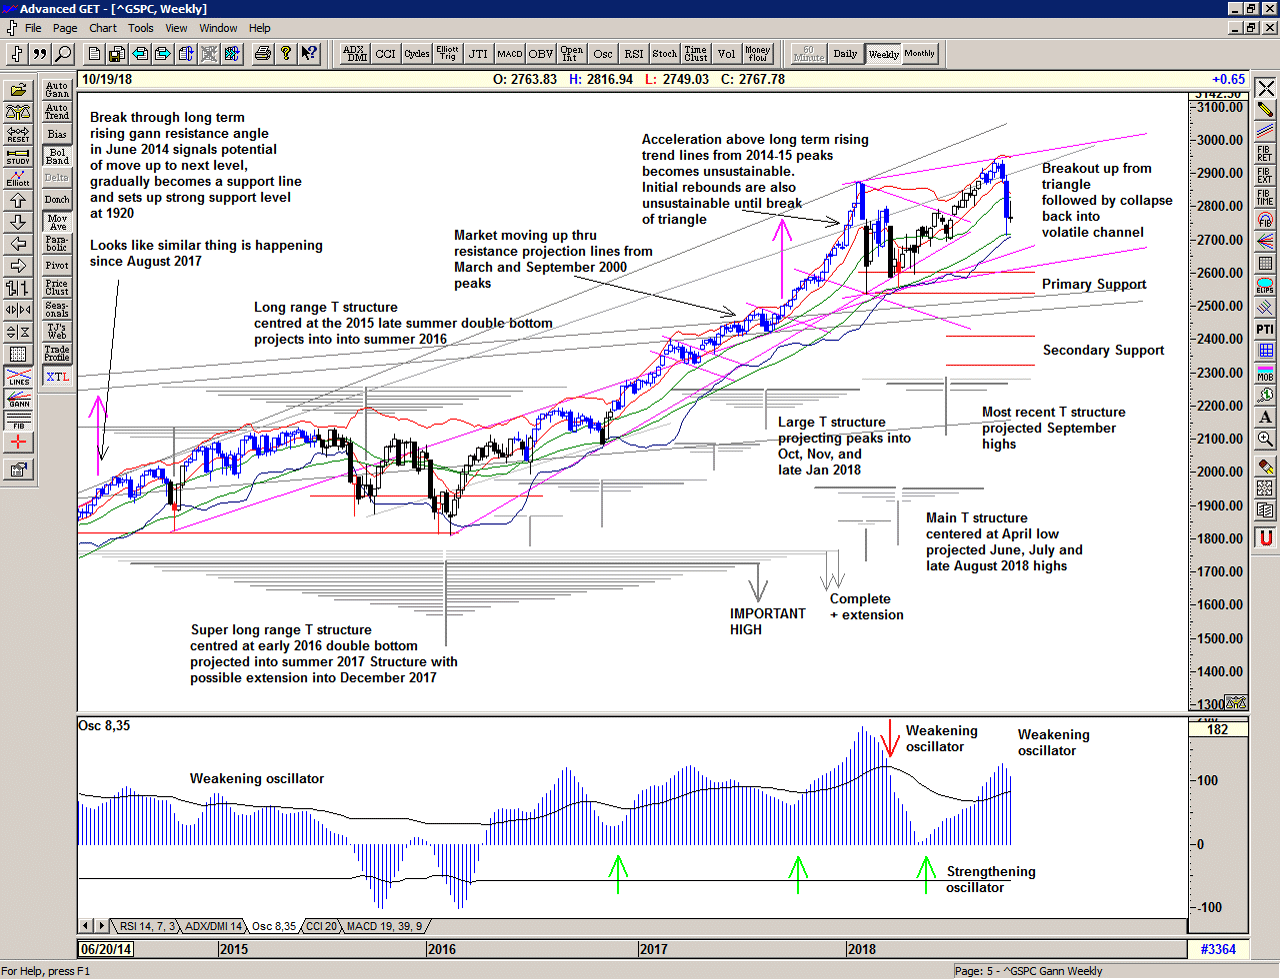
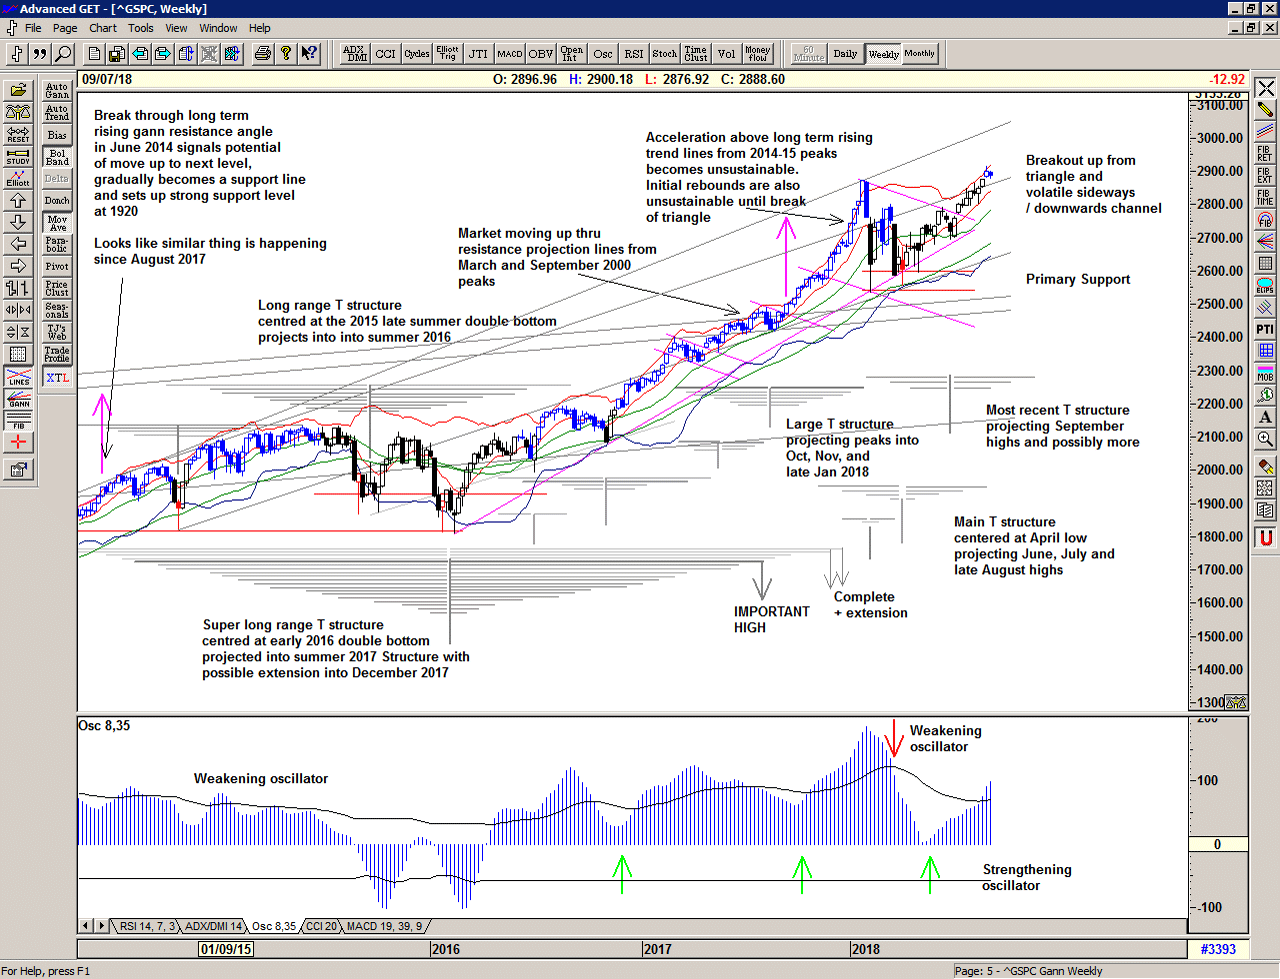
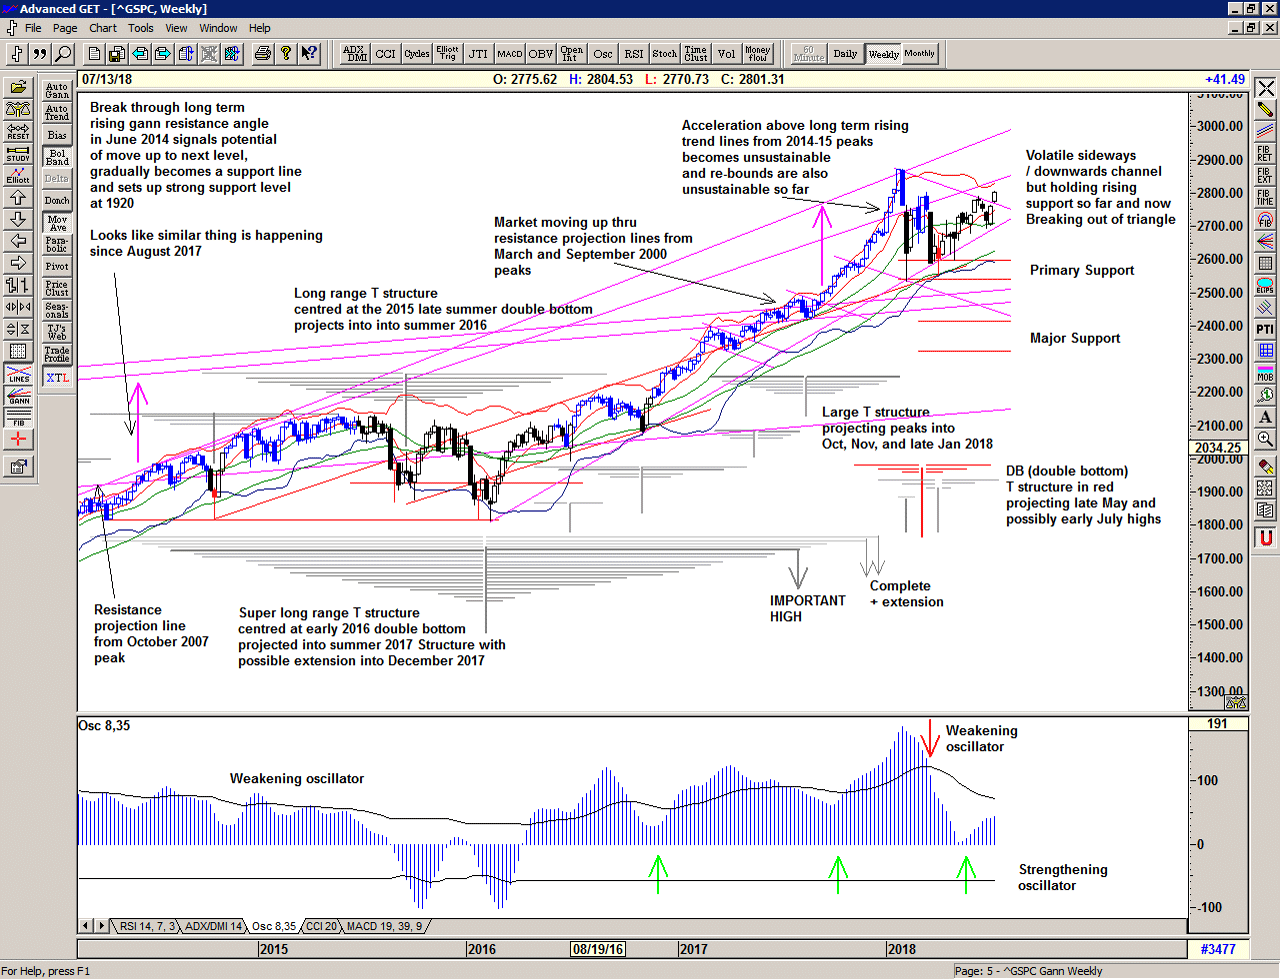
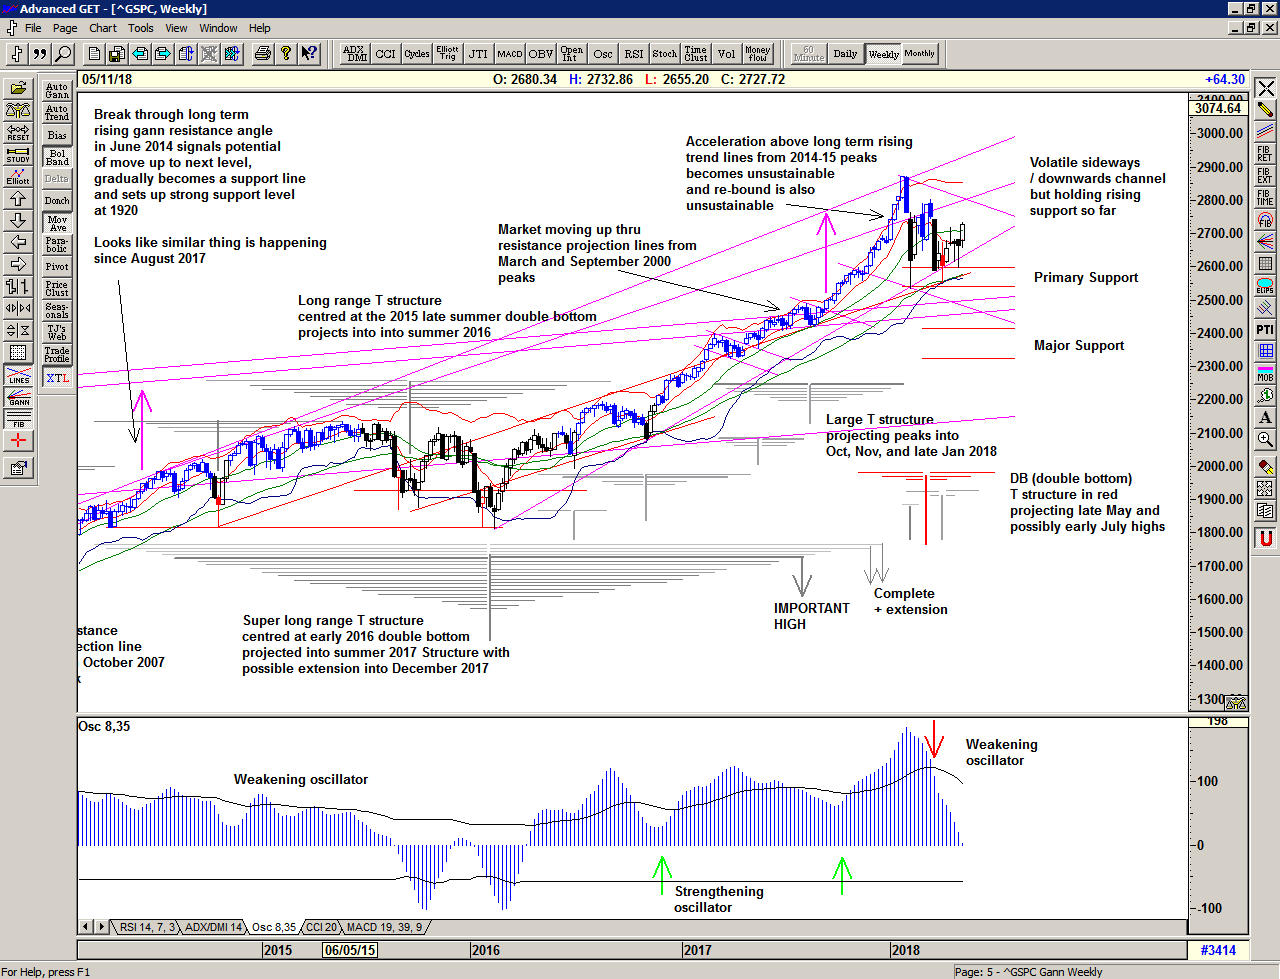
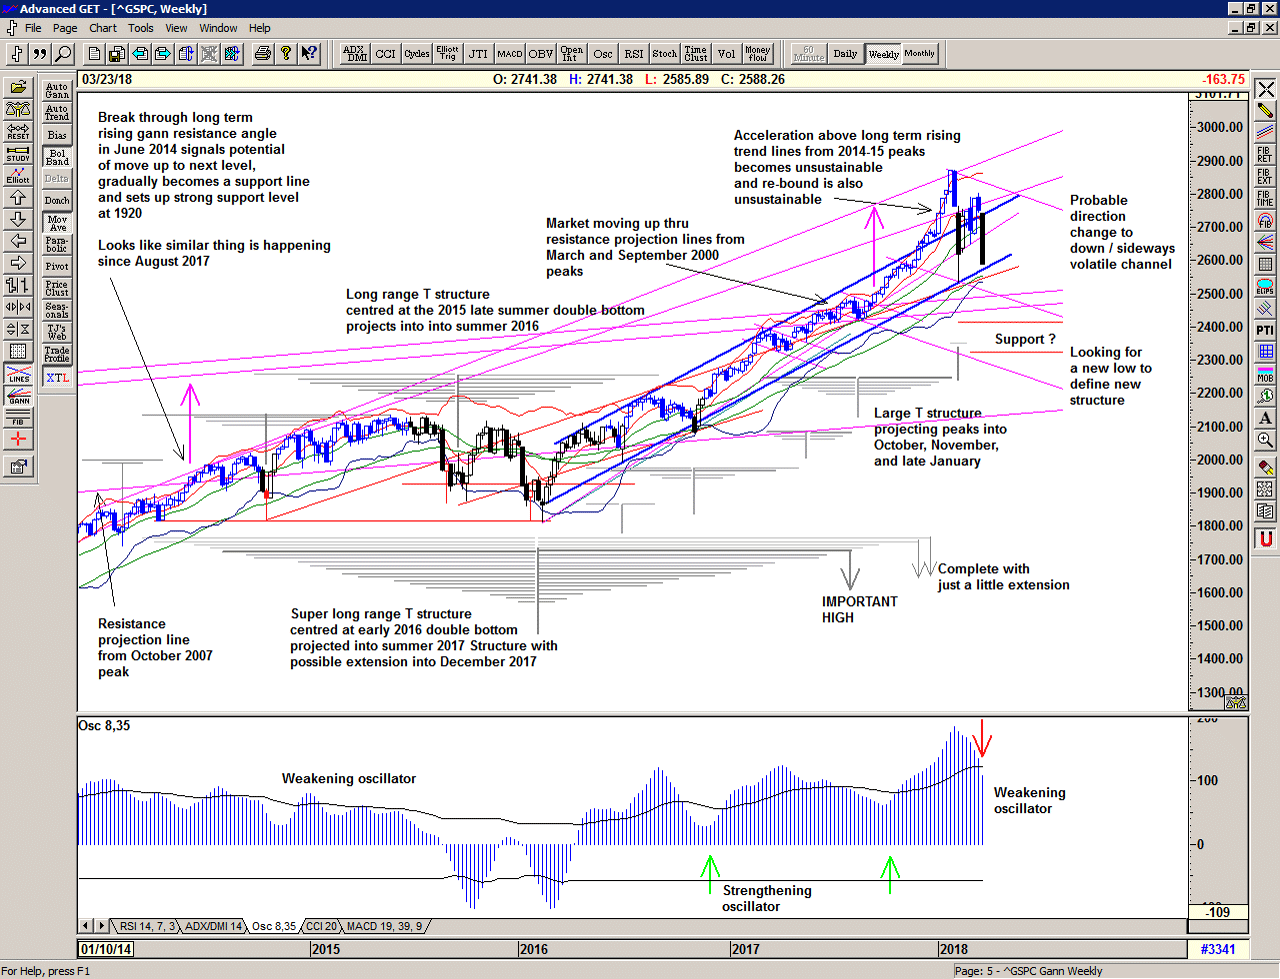
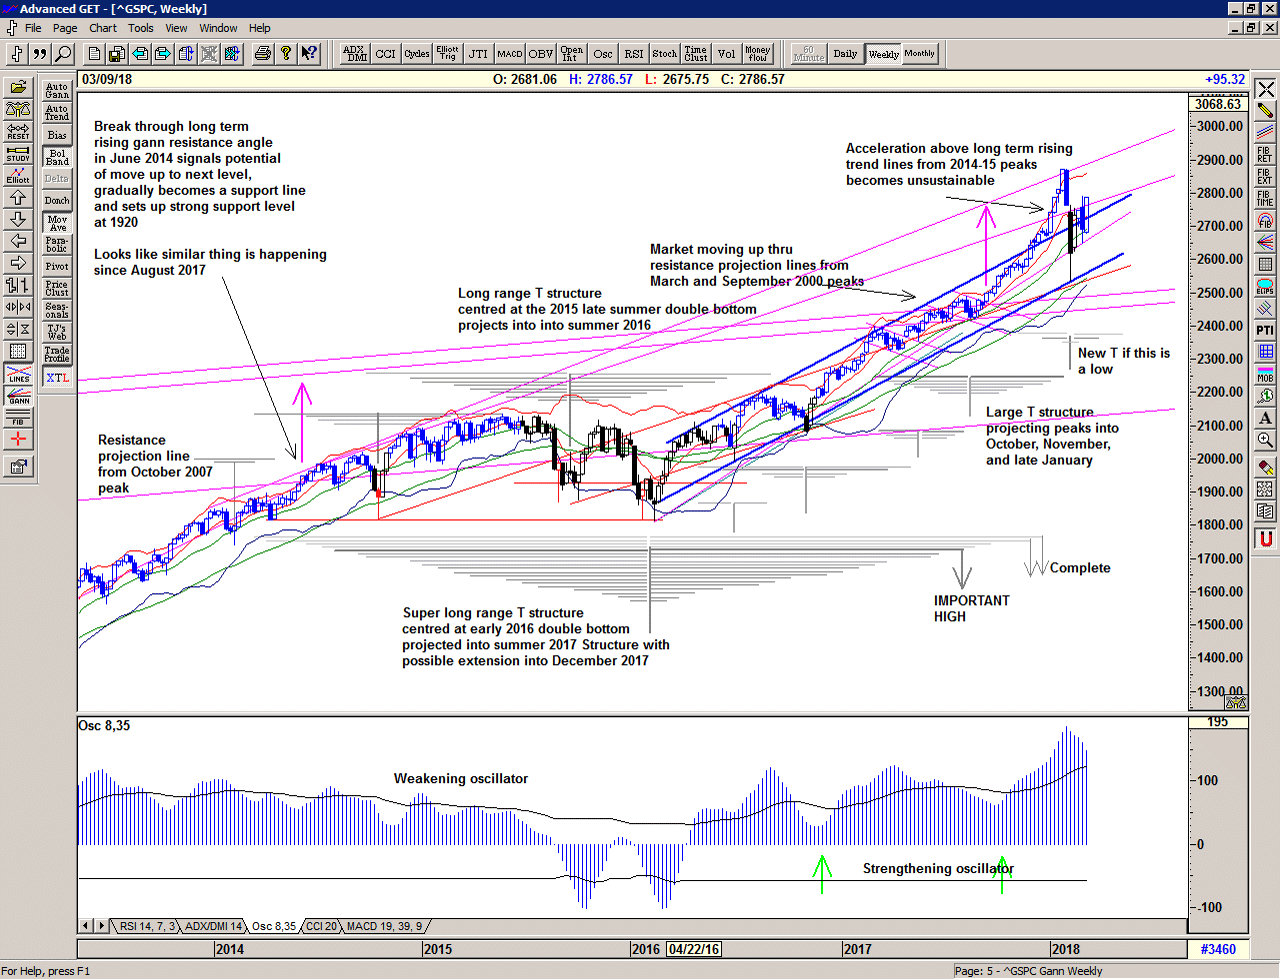
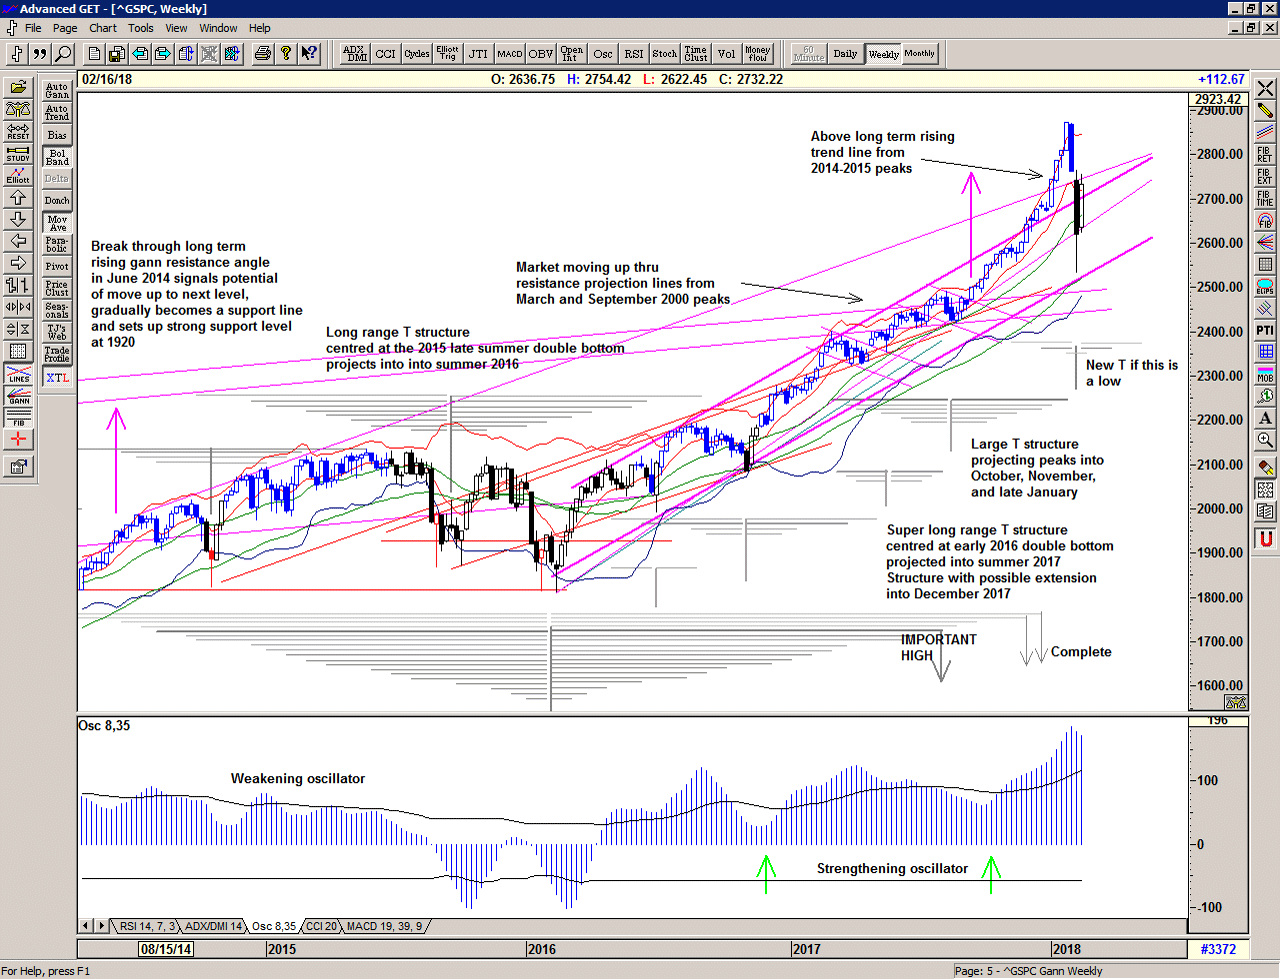
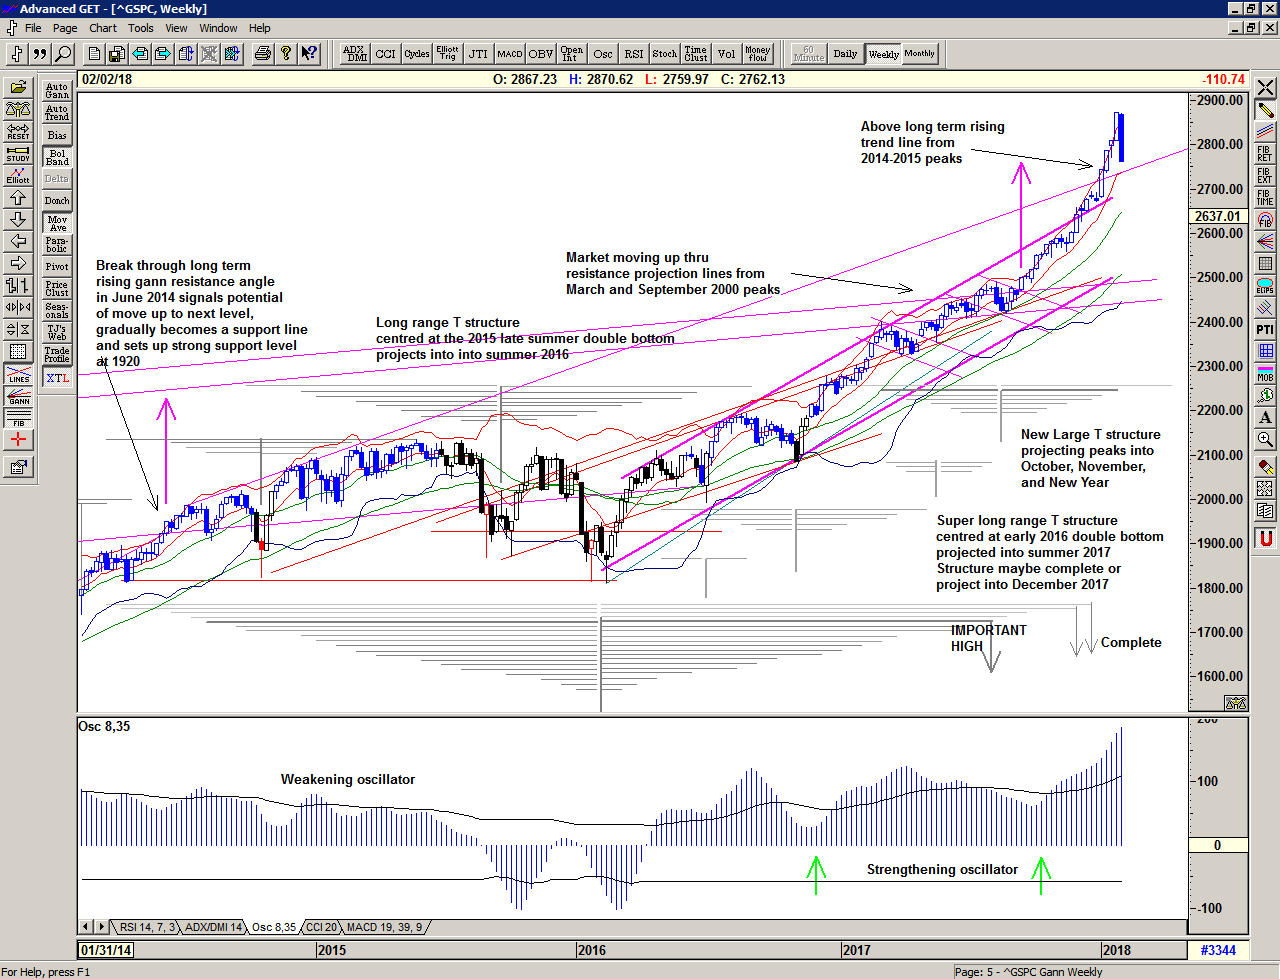
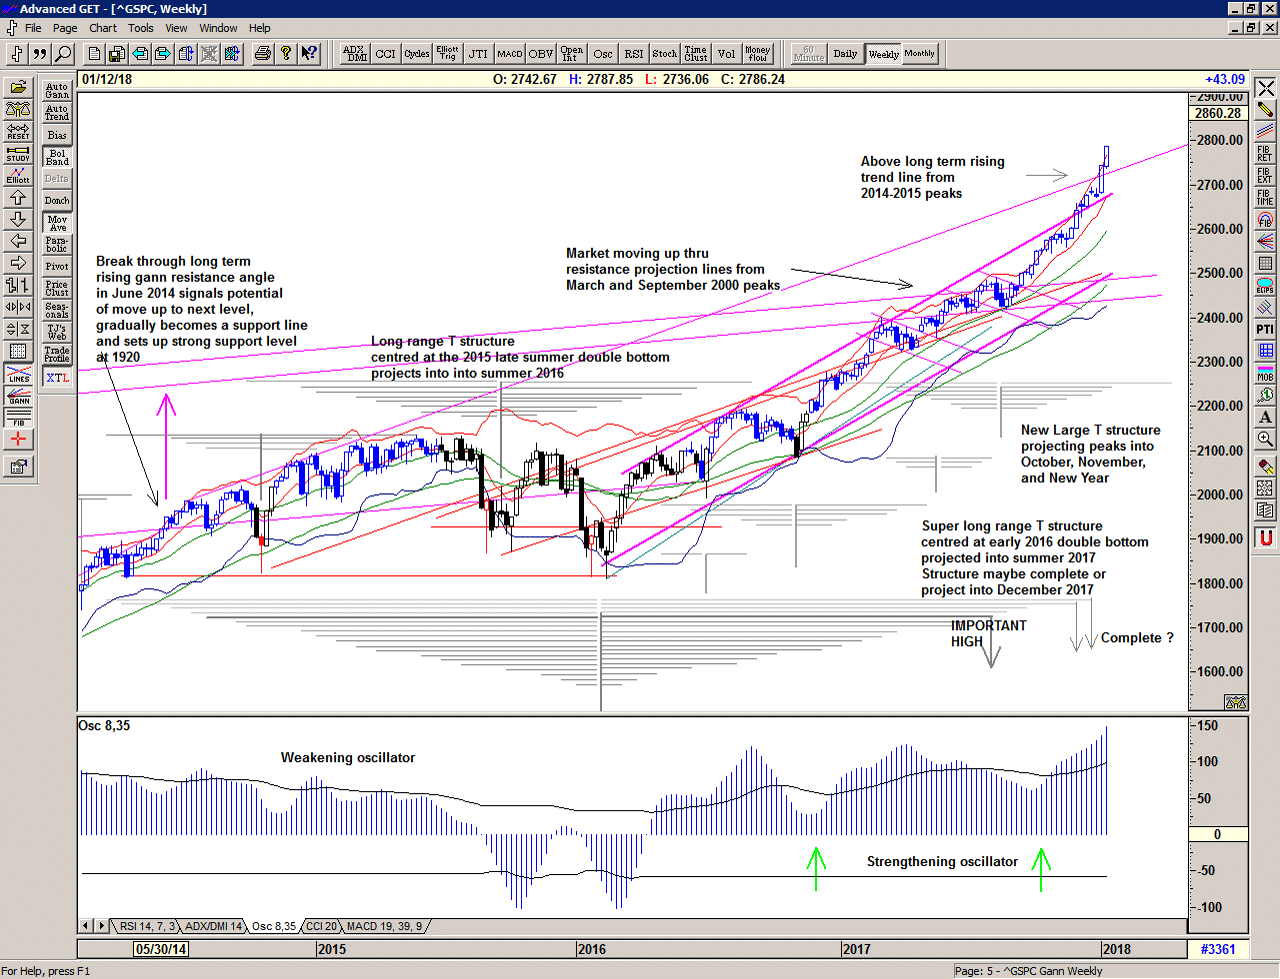
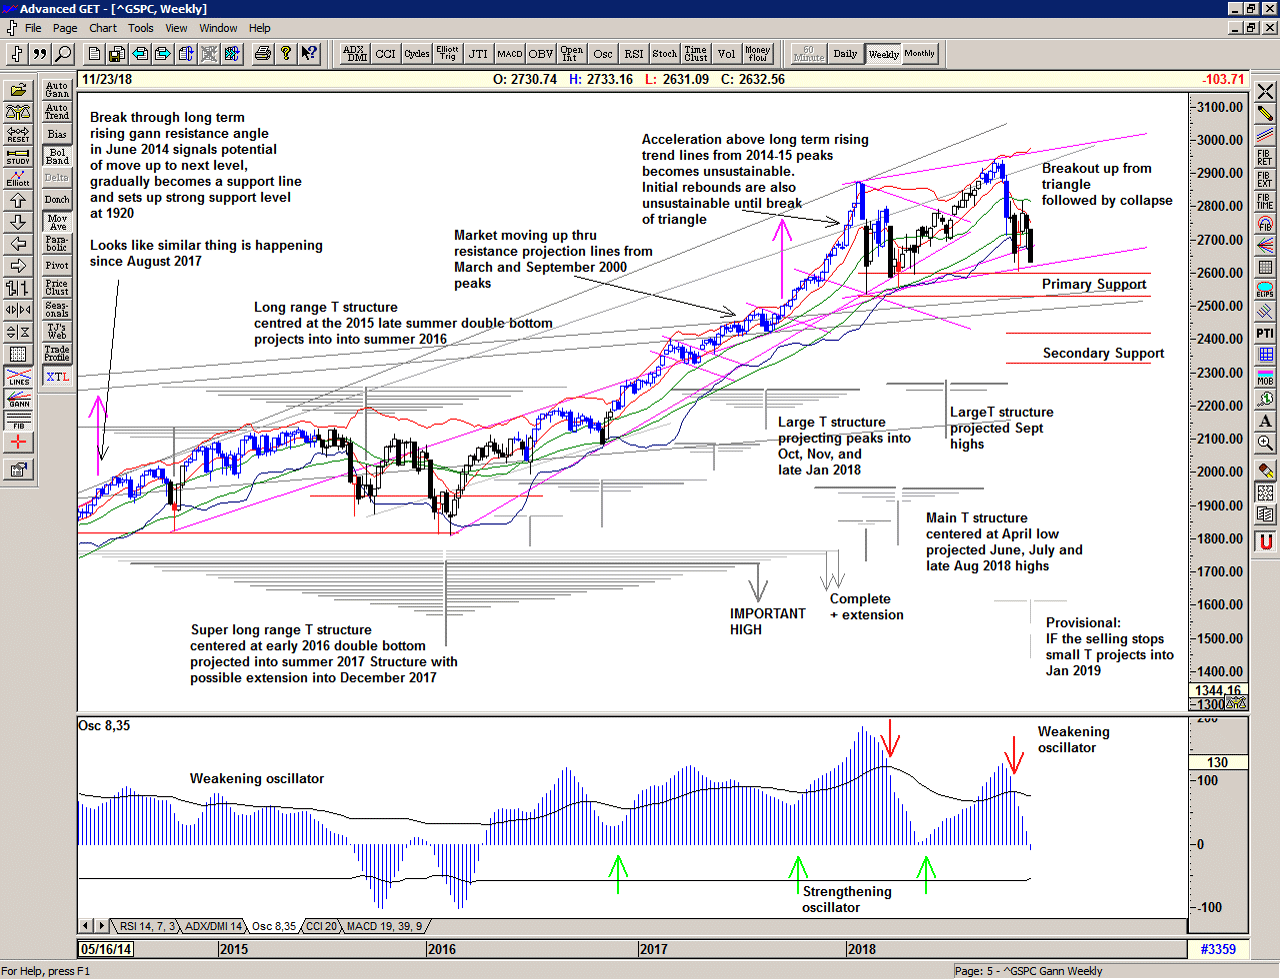
Zooming out to the weekly chart, we can see that price is again at the lower edge of the weekly channel and heading towards primary support in the region of the 2 weekly spike lows – 2530-2600, with secondary support much lower 2320-2420.
One of the things that I have noted previously is that when the market pushes upwards through a major trend line as it did in June 2014 and September 2017, we have a challenge to price. The price rise eventually becomes unsustainable and price needs to correct and re-establish itself through a process of probing back lower to find out where the value in price lies.
In our more recent case, we can see that we have yet to see a challenge to the lows prior to the breakout in price above 2500. Those lows at 2420 and even 2320 may well be re-visited in due course.
That may seem dramatic, but there is little in the way of technical support below 2600, and much lower from here opens up Pandora's Box of price re-discovery.
Save the image to your desktop to view a larger version
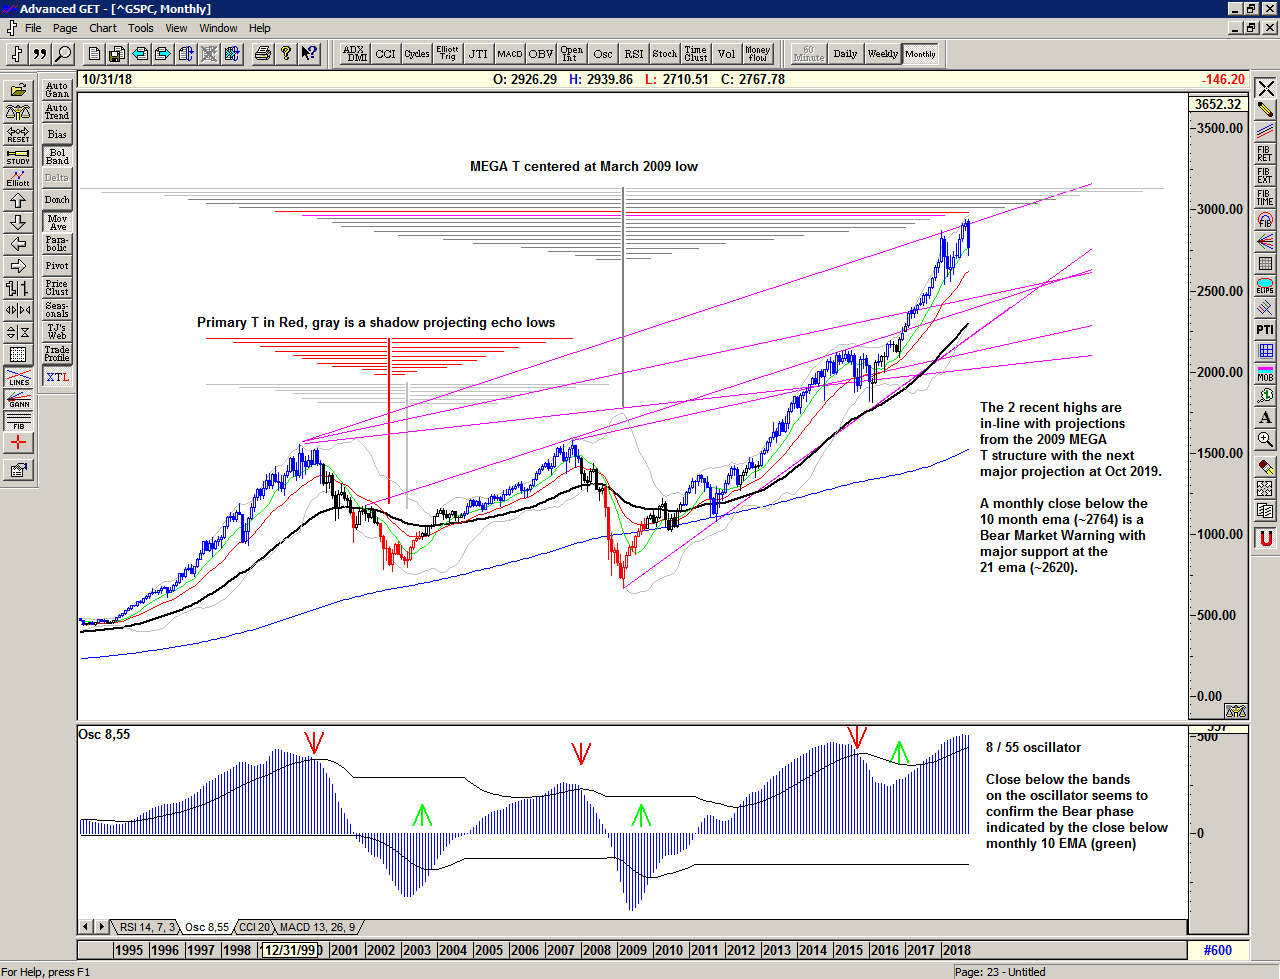
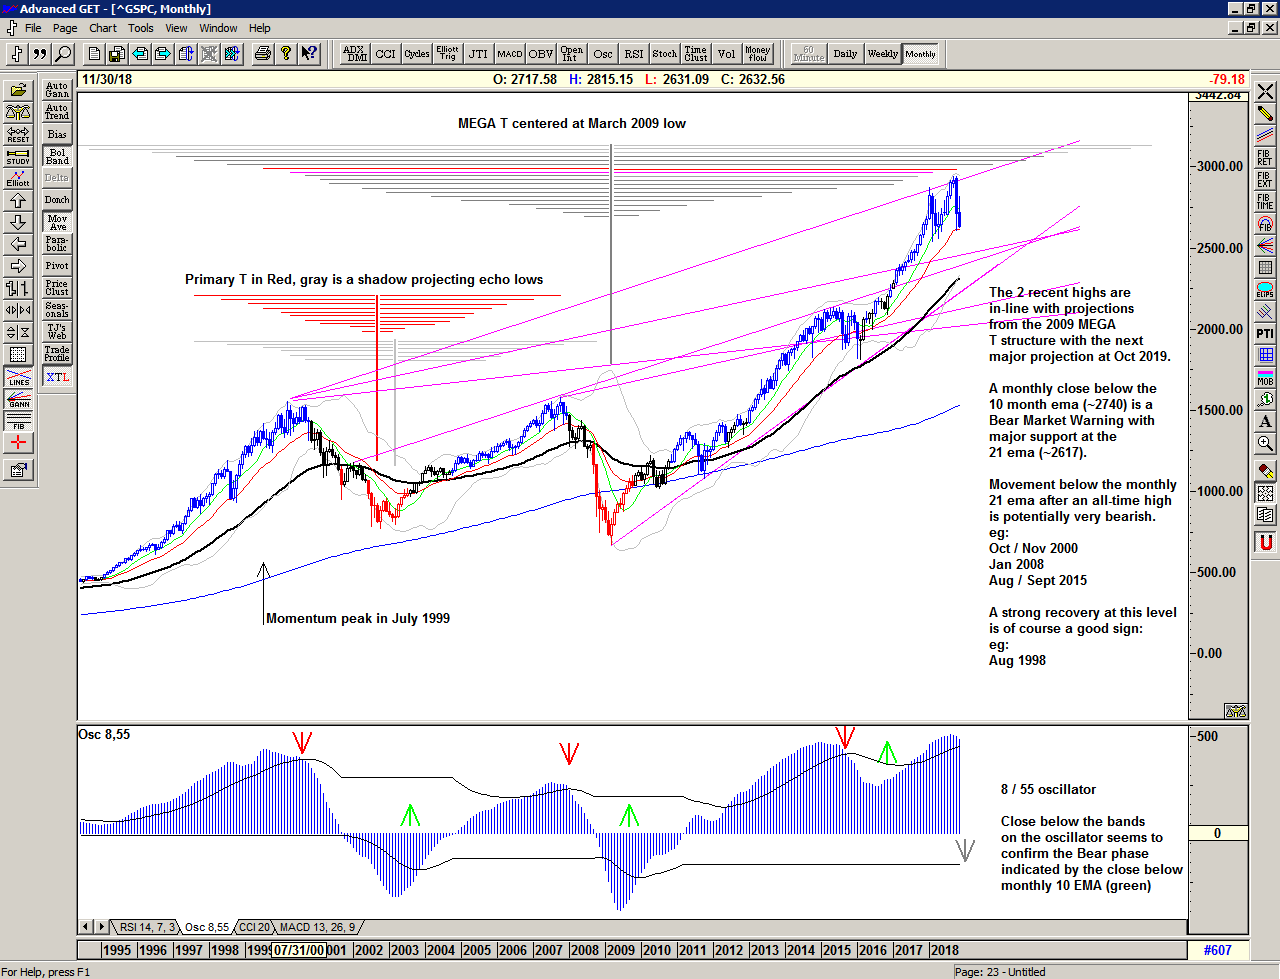
It is interesting to look at the much larger time frame occasionally, and on the monthly chart below we can contextualise the market in relation to its historical lows in 2002 and 2009.
It is clear that the market has been rising generally since the low in March 2009, and therefore within the right-hand side of a Mega T structure. According to this we have just seen a projected high from the April 2000 peak in January-February of this year (pink), and subsequently another projected high from the July 1999 high (red). This is potentially the momentum peak of the Mega large T structure. Another wave from the July 1998 high would project another major high in October 2019 – not necessarily a higher high though, but it could be.
I have drawn each projection from the price highs prior to the major low. In the red T structure at the 2002 low we can see that the ultimate projection for the 2007 high came from the 1997 high which is of course much earlier than the final high in that bull market. Using the same logic we should keep an eye on the projections from the earlier highs. These are October 2019, August 2020, and January 2021.
As you can see the market is generally supported at its 10 month exponential moving average (ema) during bullish phases and subsequently at its 21 ema on major pullbacks. If the market is to enter a serious Bear Market it must then continue to decline below the 21 ema. Note also that the long-range 8 / 55 oscillator also provides a confirmation of the change in momentum.
Unfortunately these levels are now being addressed and price much lower than here is highly suggestive that we are seeing a major bear market develop.
Save the image to your desktop to view a larger version
All in all, 2018 continues to bring with it some excellent opportunity and a range that is far beyond the experience of recent years. We should expect it to continue and trade accordingly. This is a Brave New World.
–
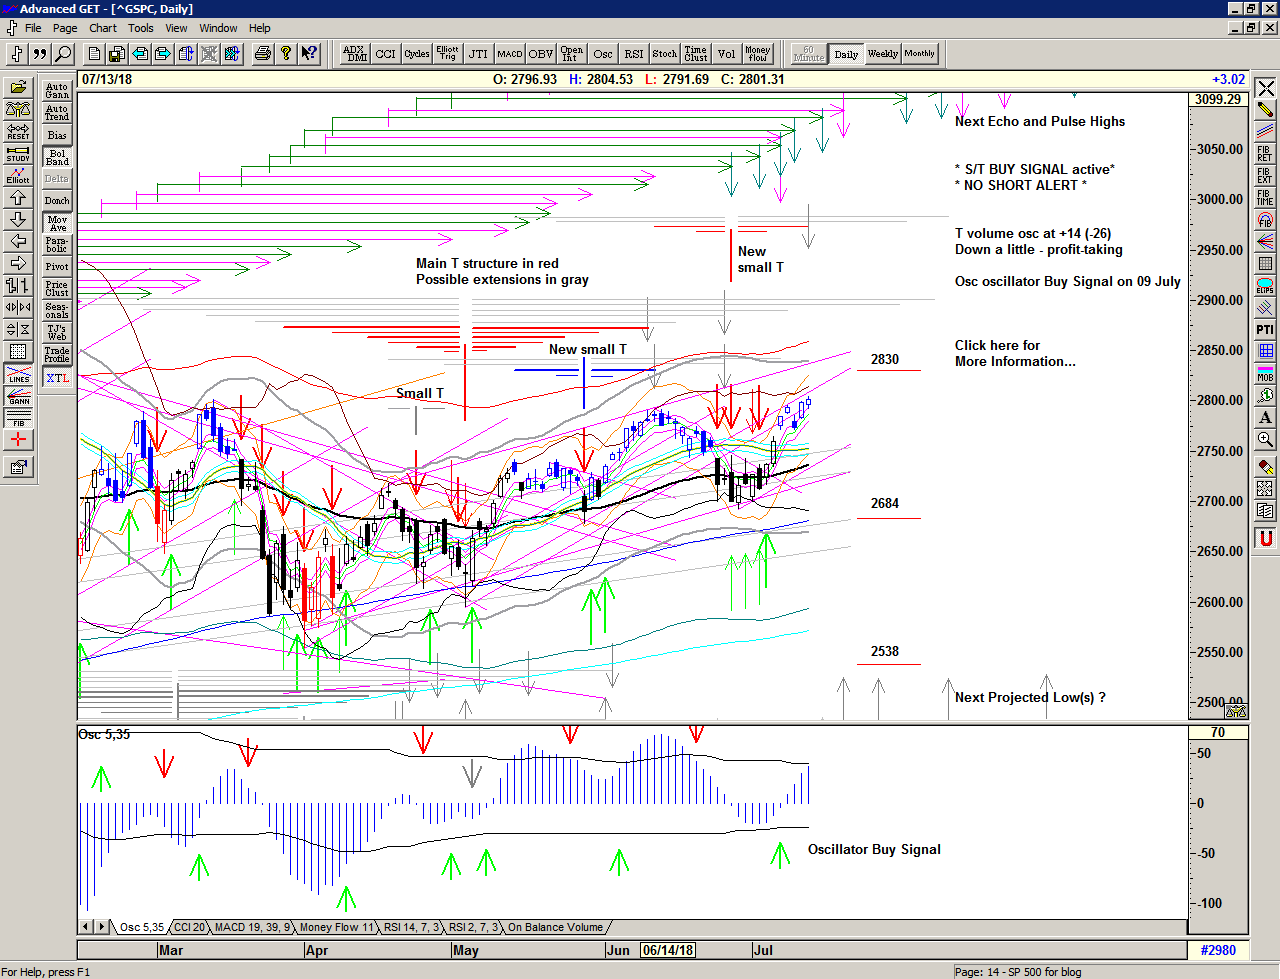
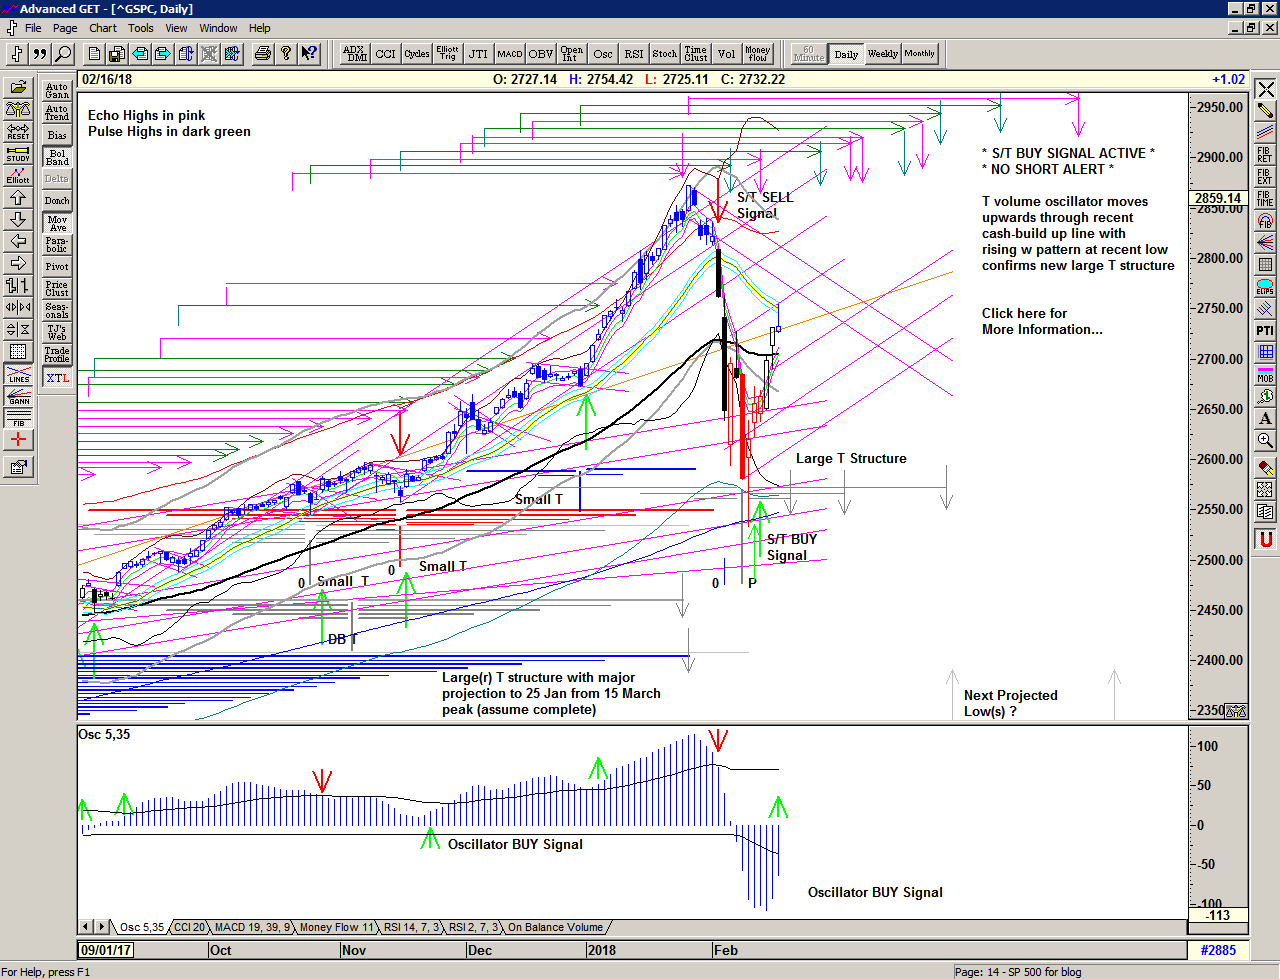
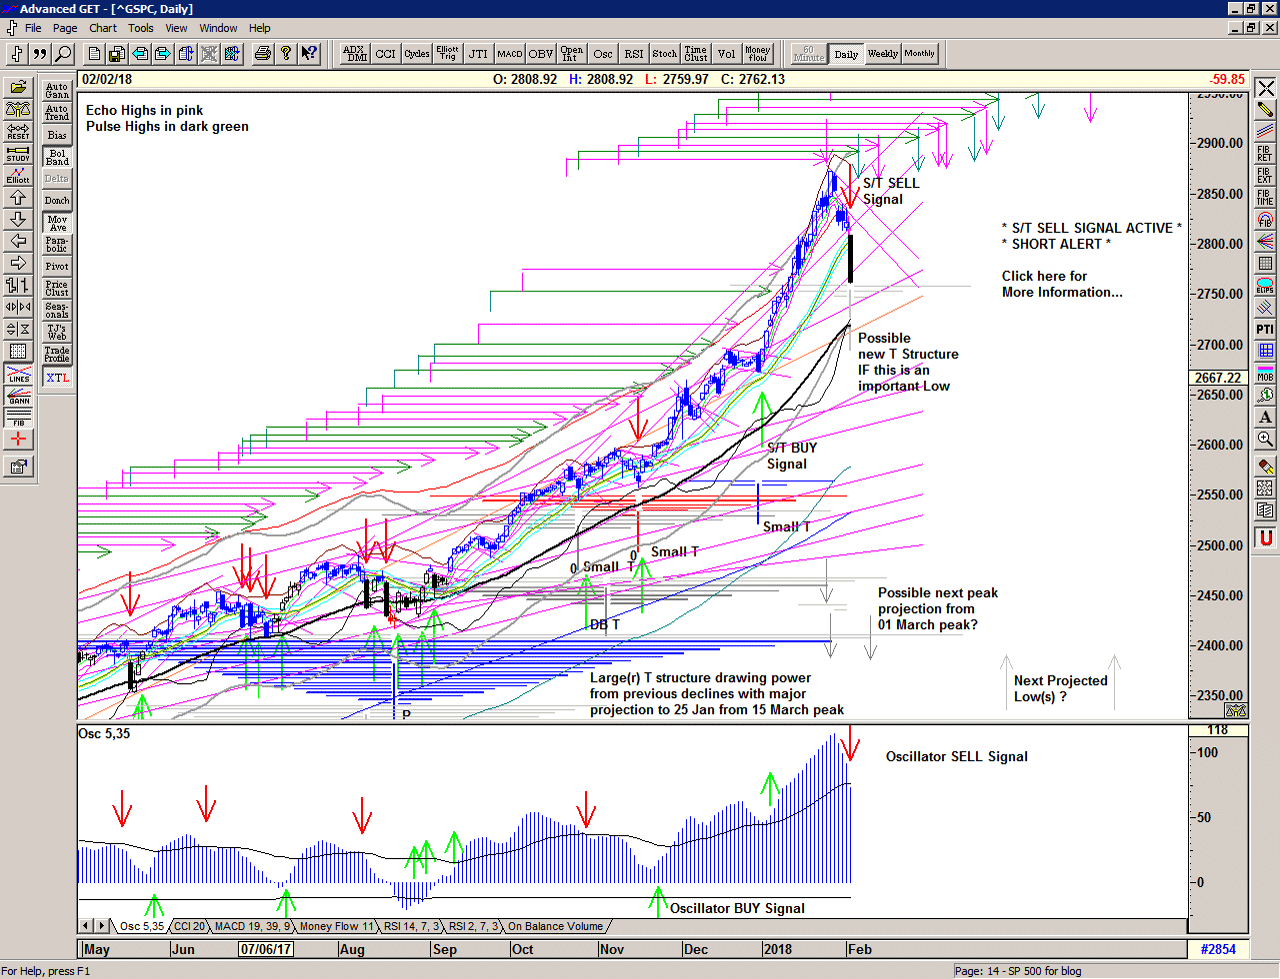
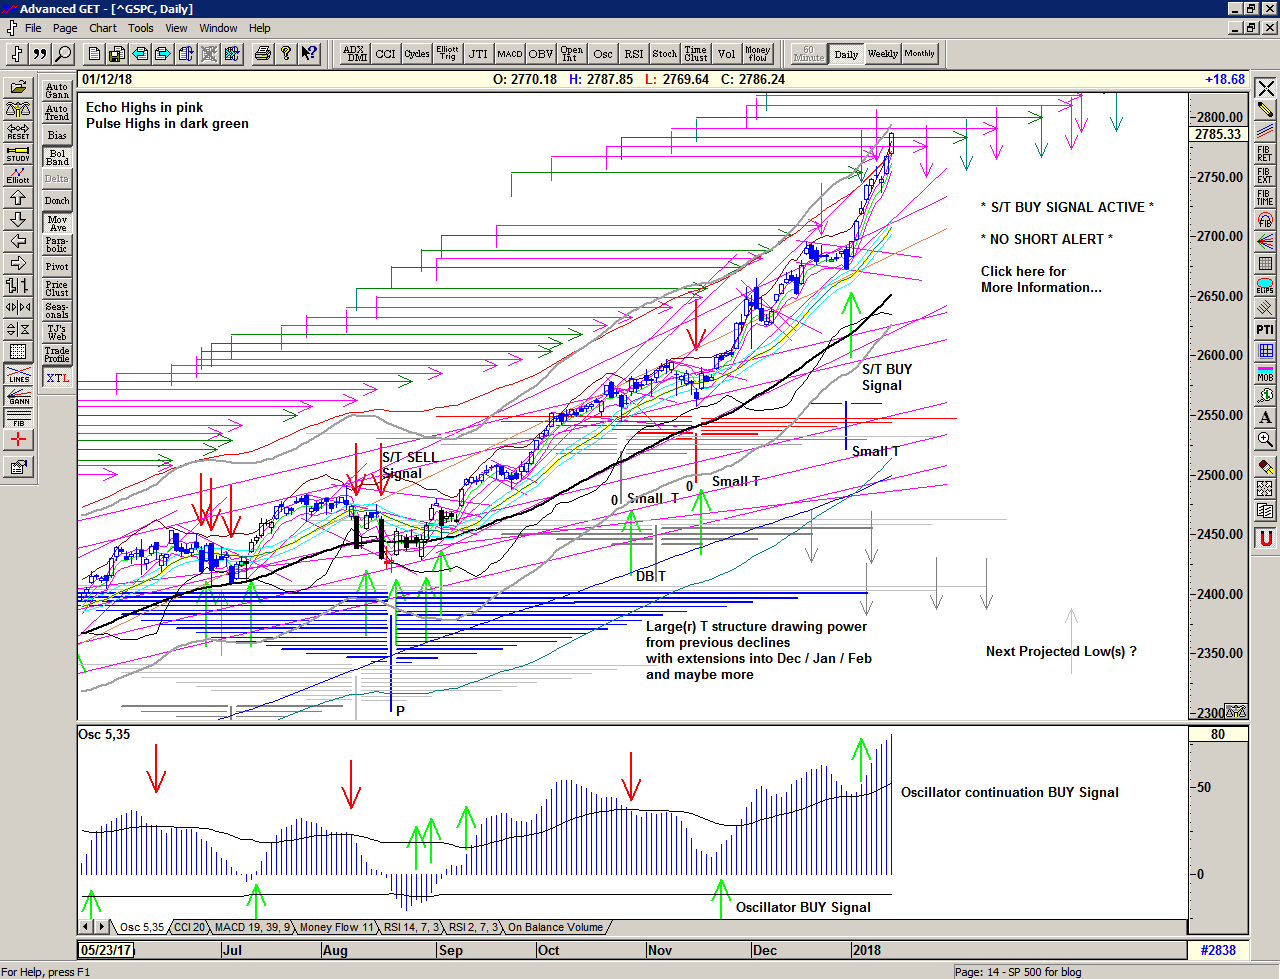
Regardless of whether the market can recover or whether deeper low(s) are ahead of us, the simplicity of the proprietary price based S/T Signalling System continues to keep us on the correct side of the market, providing a timely Sell signal at the beginning of October. Recent Buy Signals have again rapidly switched back into Sell Signals as the market continues to stabilise and the outlook continues to look murky…
If you would like to learn more about using the S/T Signalling System please get in touch.
–
Be prepared for whatever is coming next, and trade with confidence:
To receive detailed daily analysis, guidance and the updated daily Buy / Sell trigger levels being generated by the Trading the Line system before the market opens, and intraday alerts when appropriate, please become a Member and Sign up for Alerts & Observations – includes access to Members Area and the Explanatory Notes for all of the concepts discussed.
Disclaimer: This is the diary of a personal trading system, its methodology and the signals that it is producing. You are welcome to follow along but please understand that the information presented here is for educational purposes only. No recommendations are being made to buy, or sell stocks, options or futures contracts. Please consult your own financial advisor before making any investment decisions.