Trick or Treat
A week of heavy selling in the market.
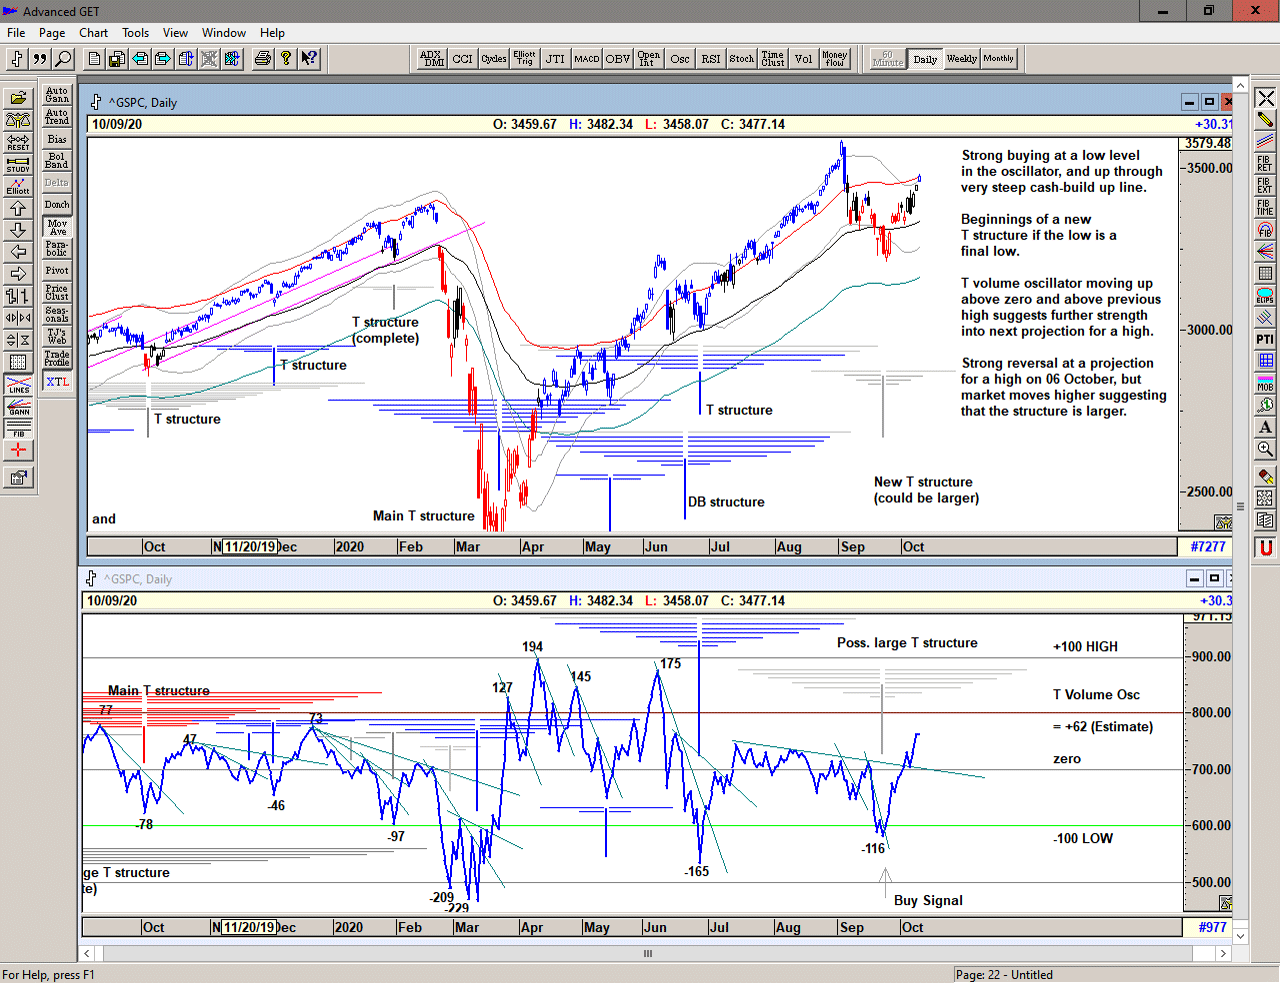
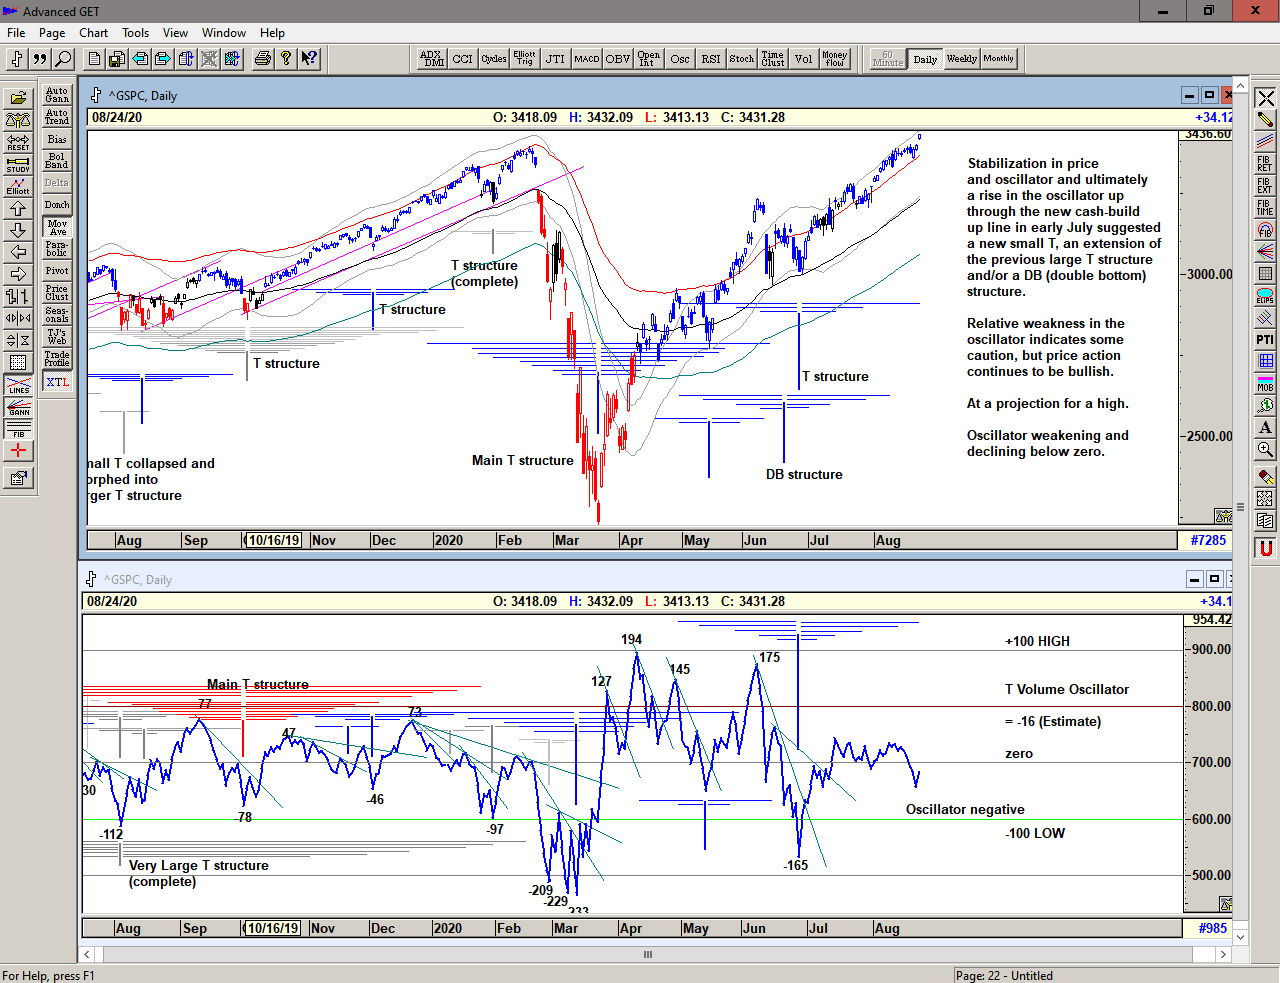
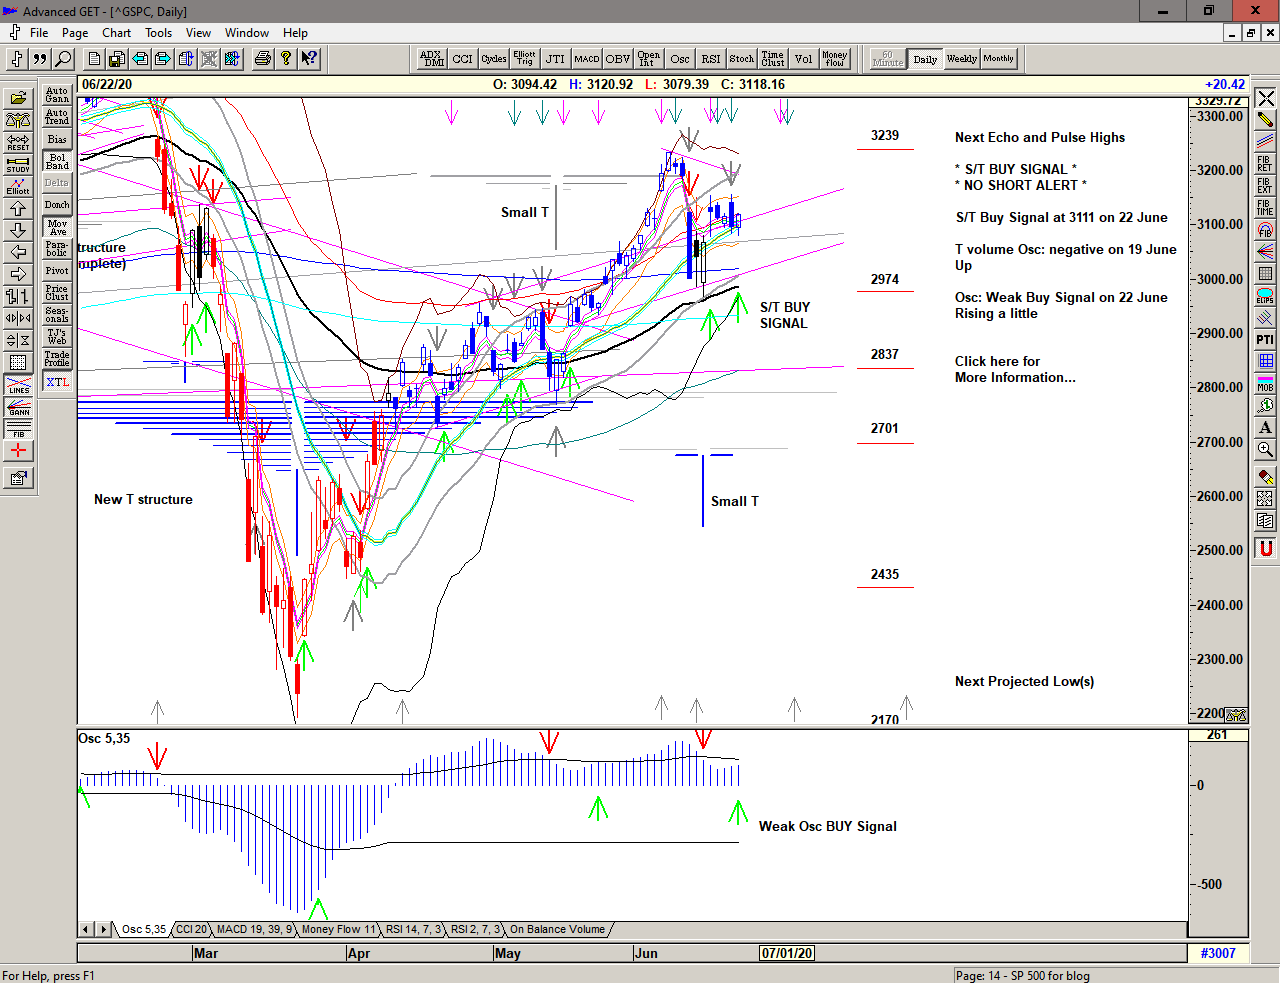
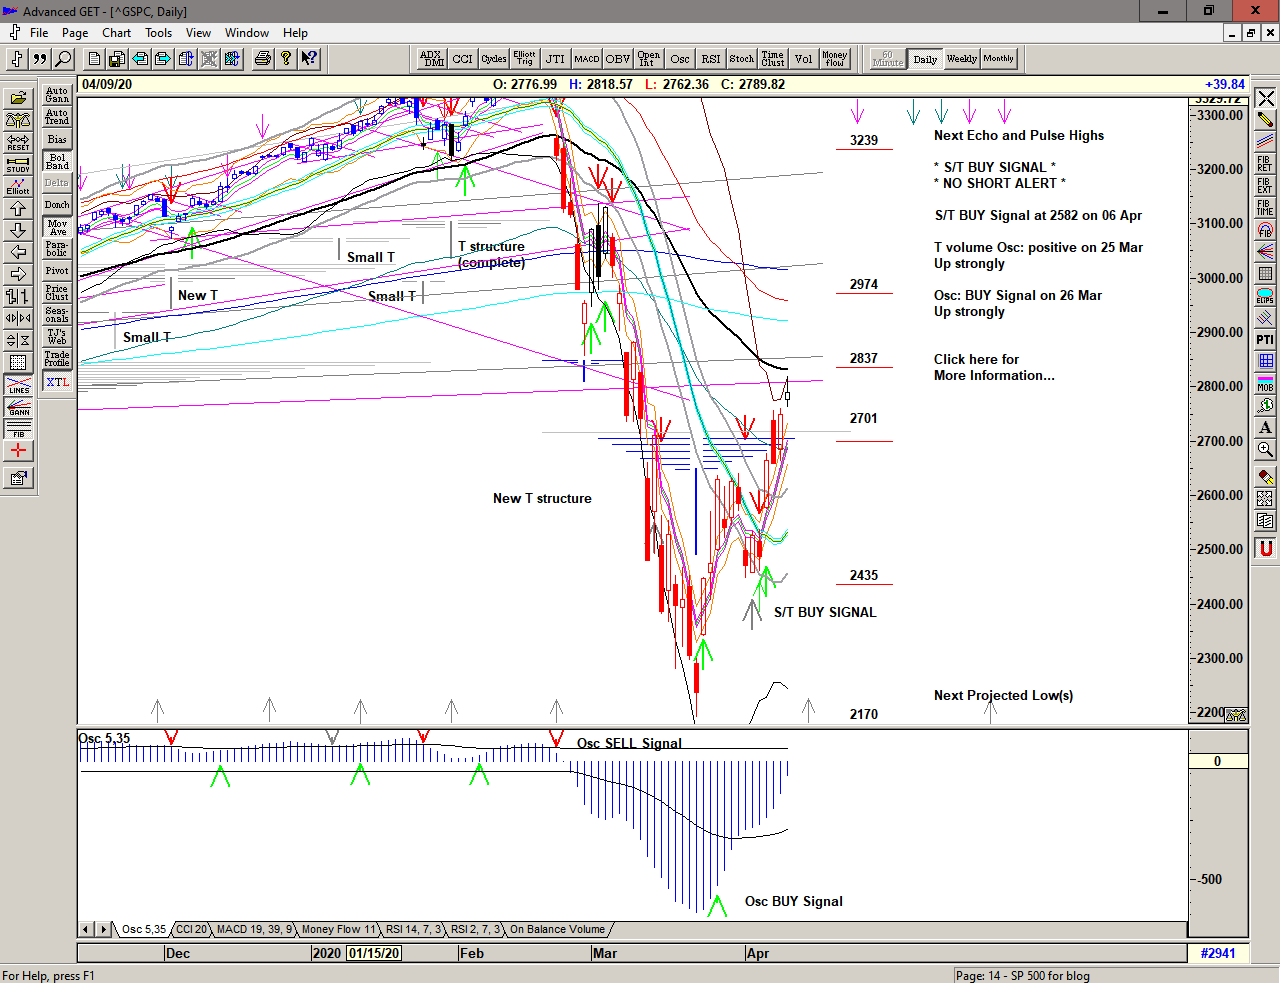
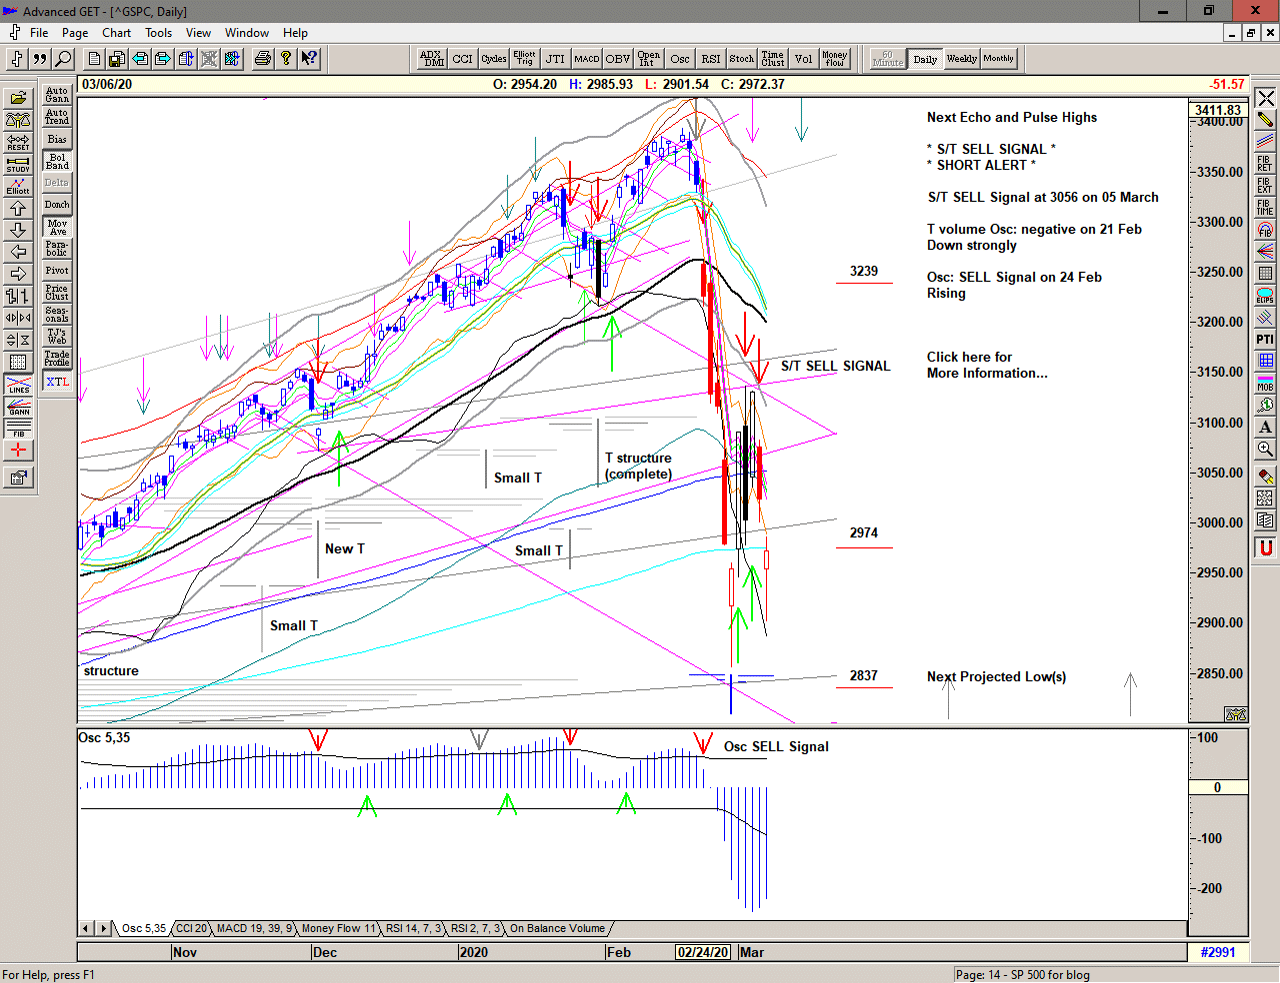
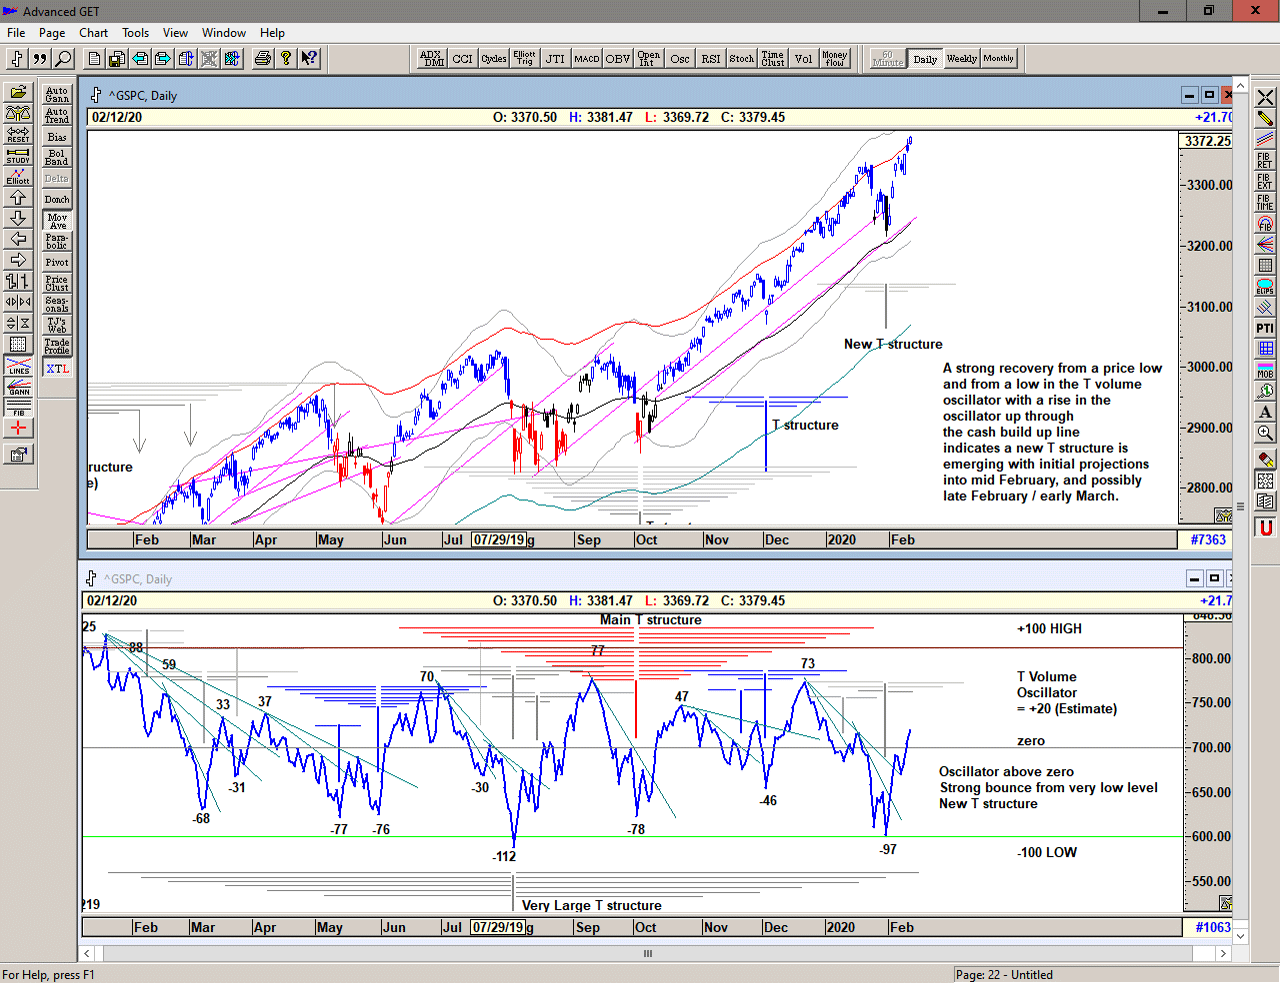
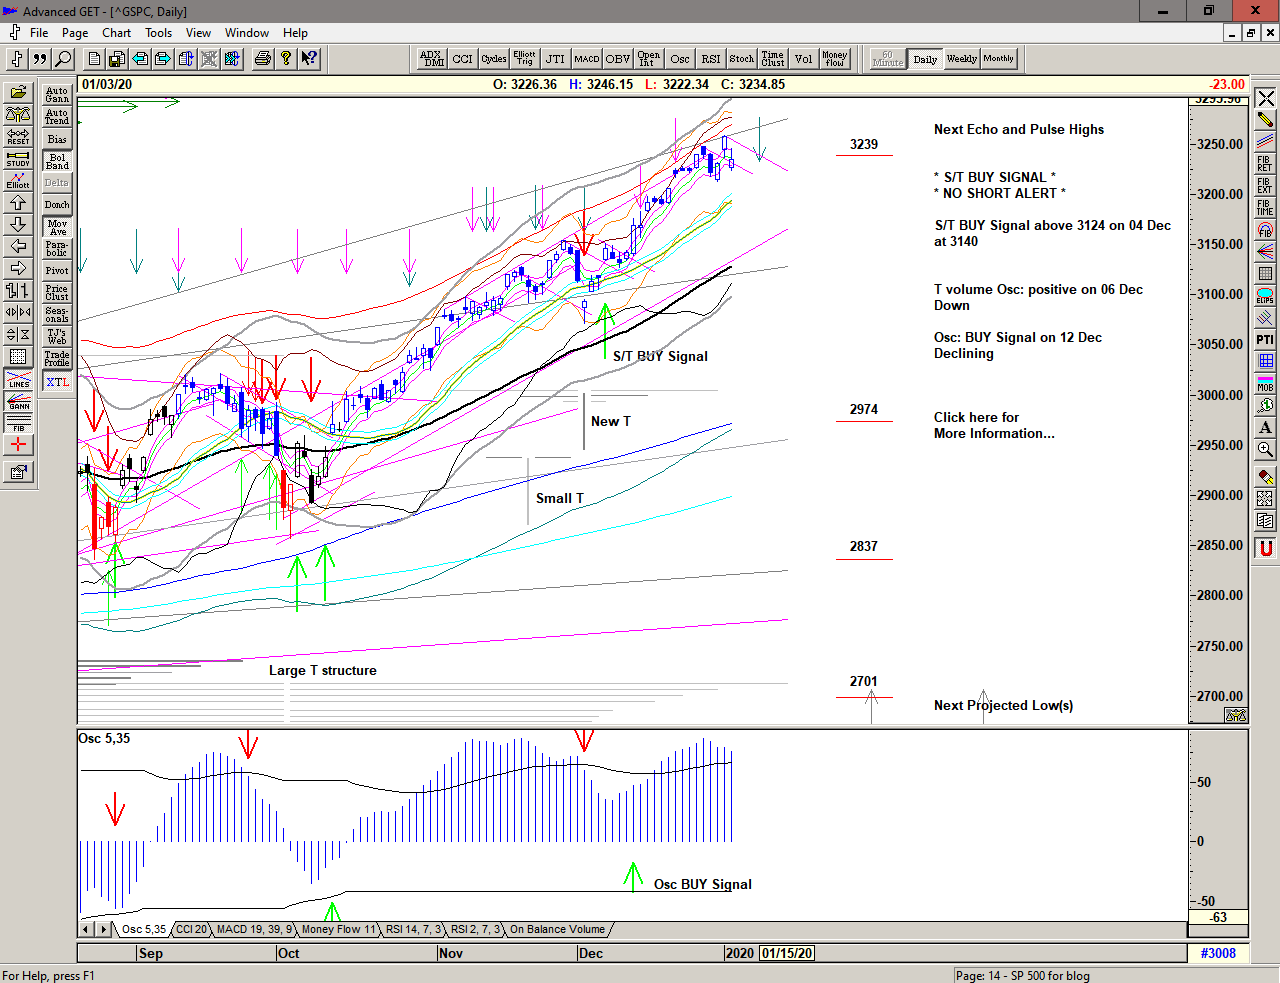
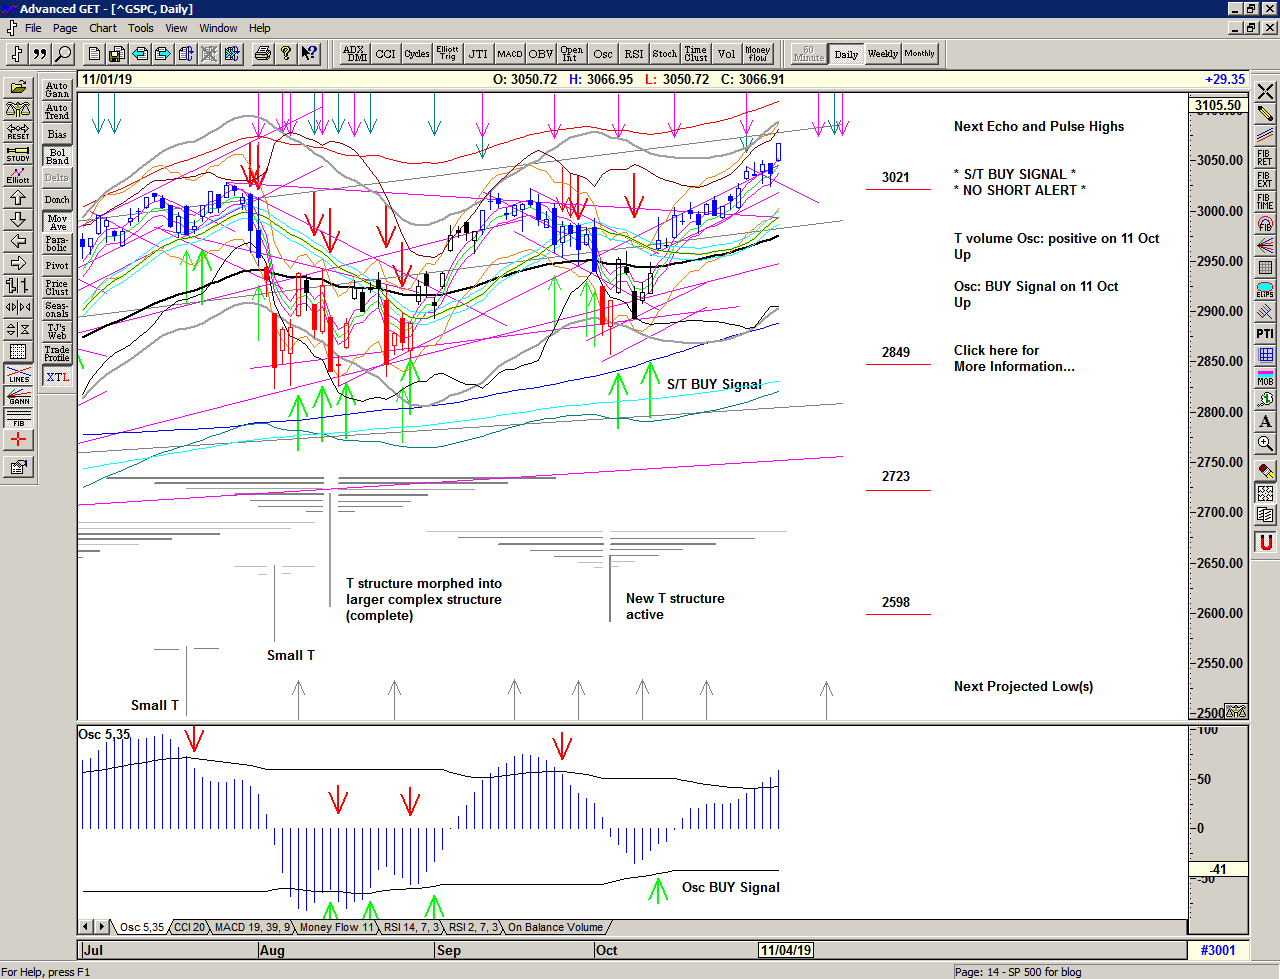
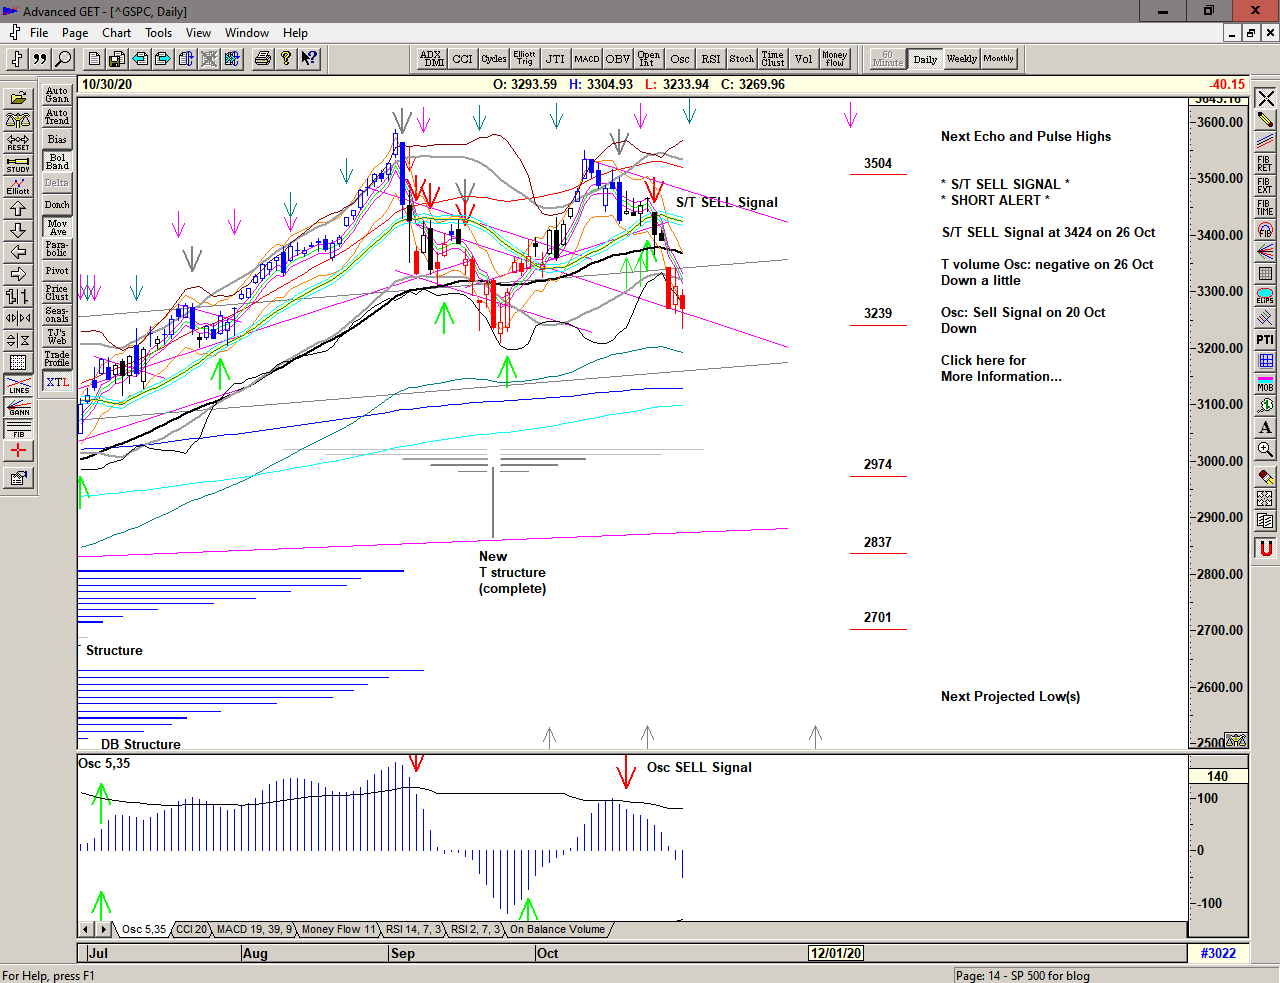
Another look near the all time high on 12 October coinciding with a projection for a high from the T structure centered on the 23 September low initiates profit-taking and resulting in a series of lower highs whilst attempting to recover before finally losing support on 26 October with a Sell Signal at 3424.
Initial support at the important black support line sets up a bounce that is quickly forgotten with a gap lower and further selling finds the market looking at the 23 September low again.
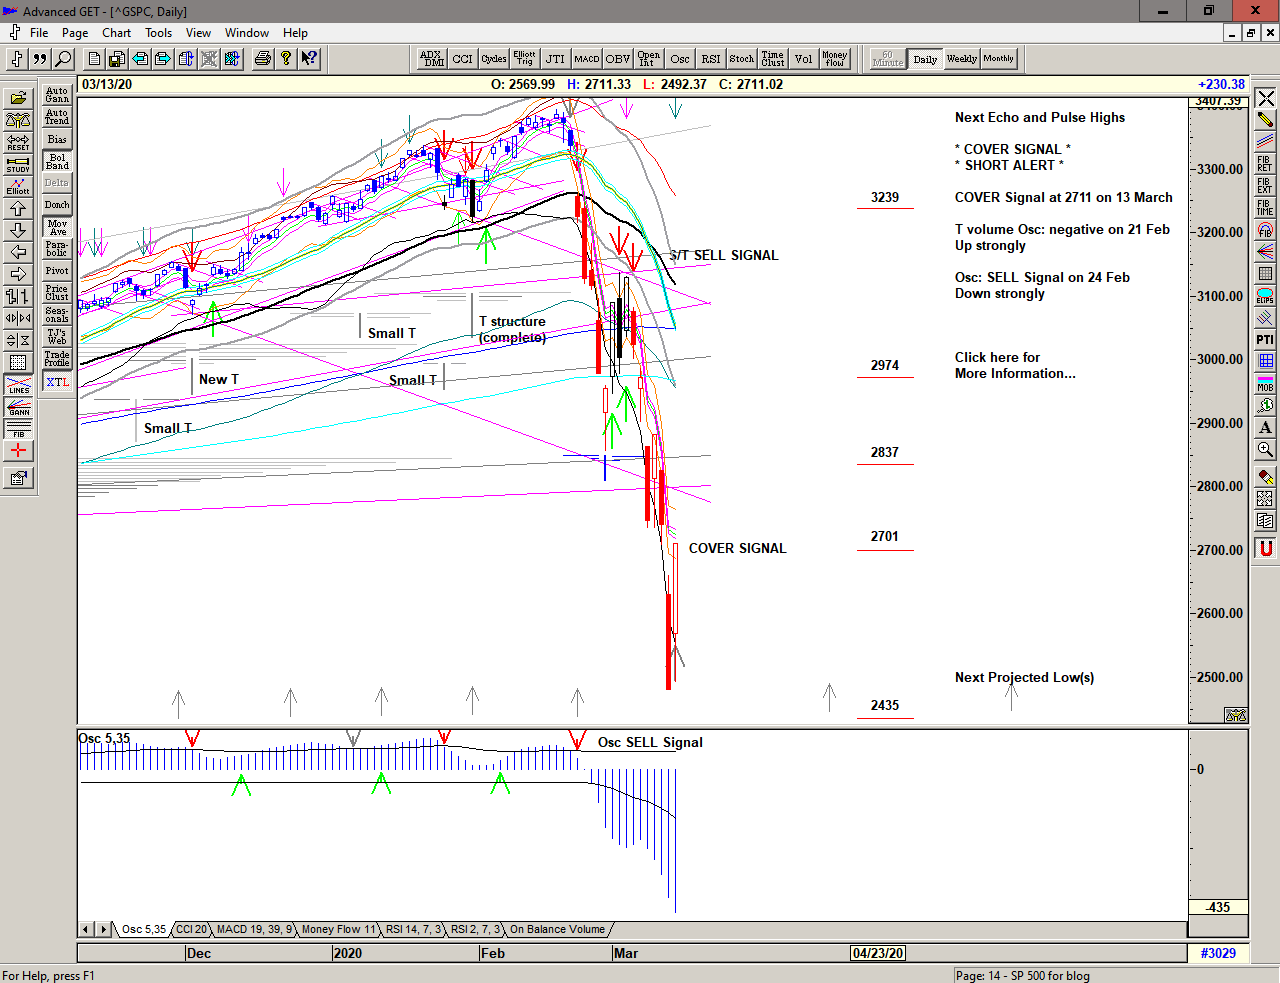
A Sell Signal active and the beginning of a new bearish phase or a 'pullback' to previous support?
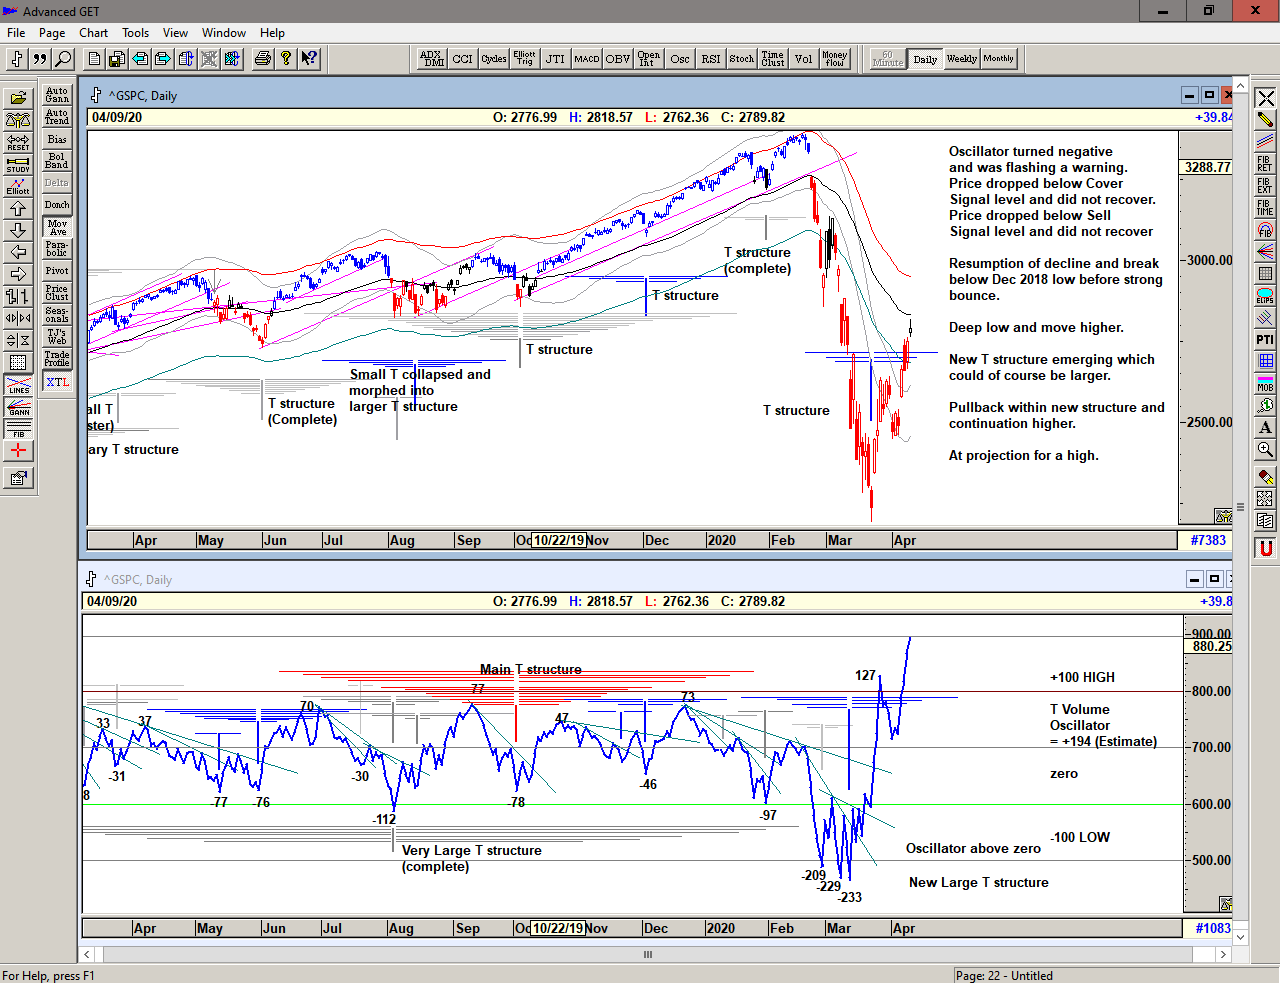
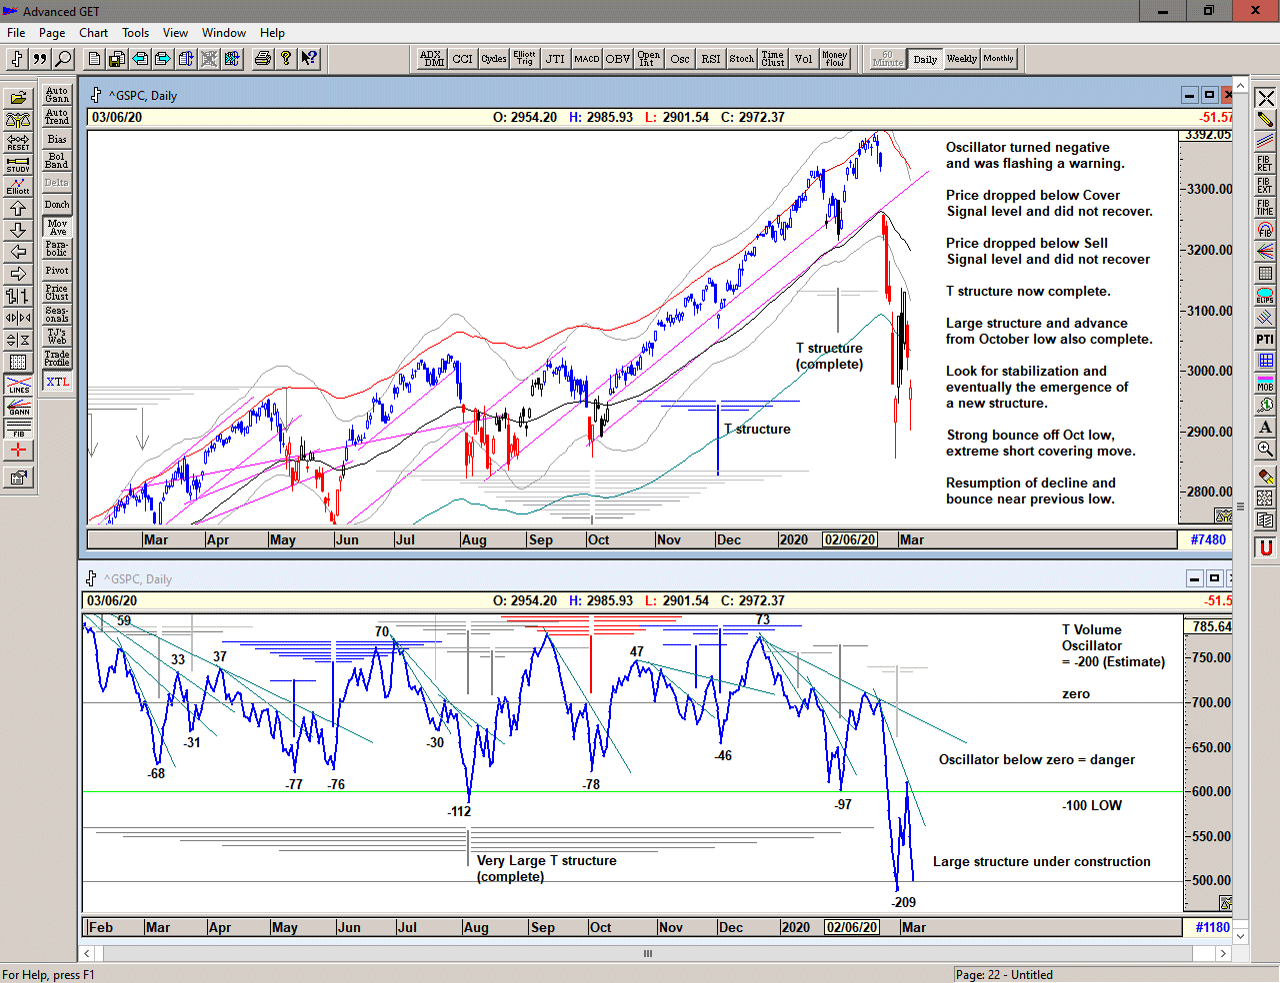
Save the image to your desktop to view a larger version
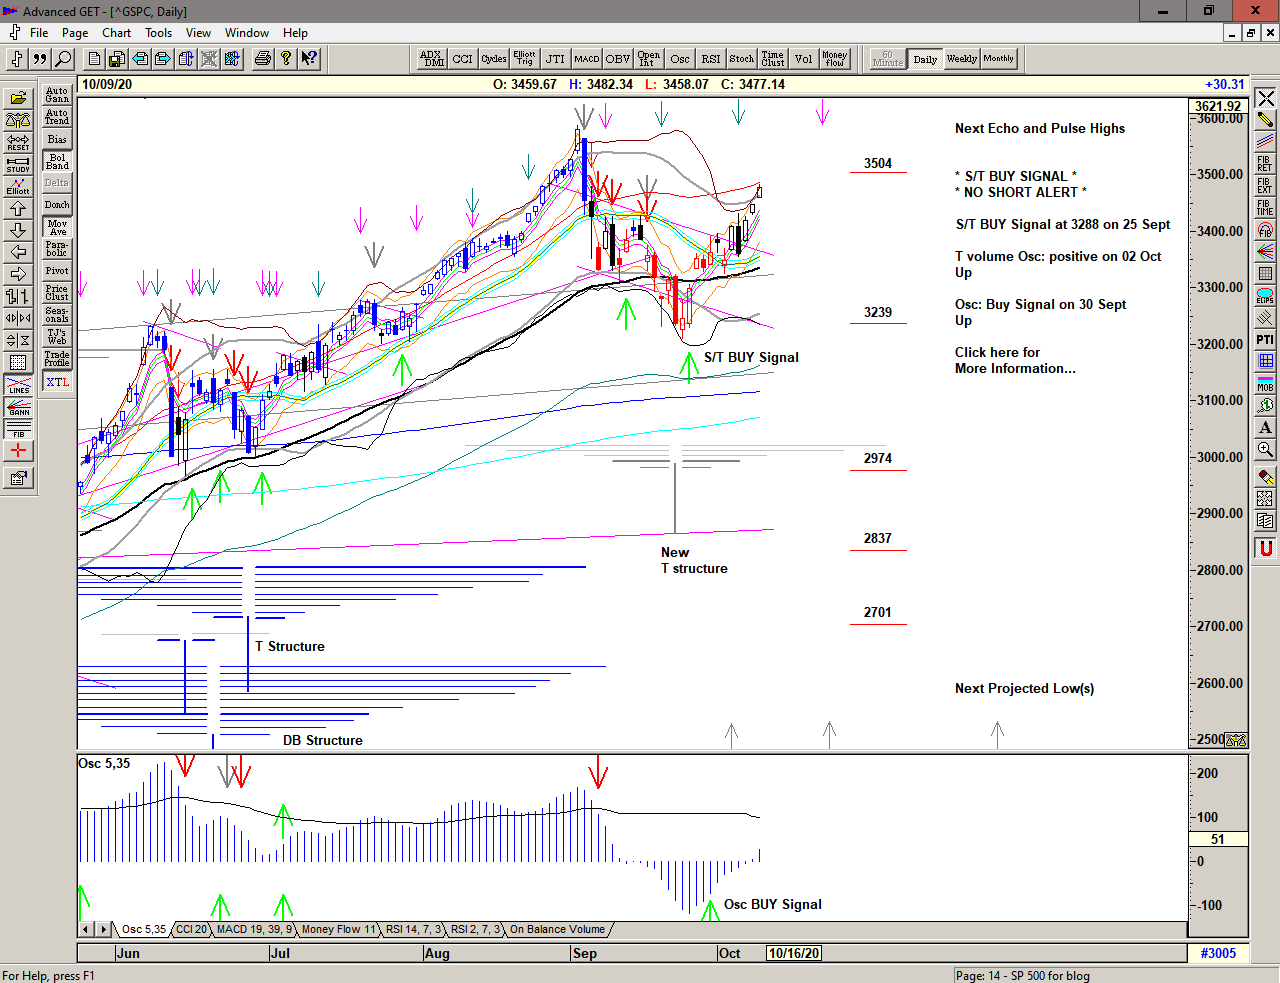
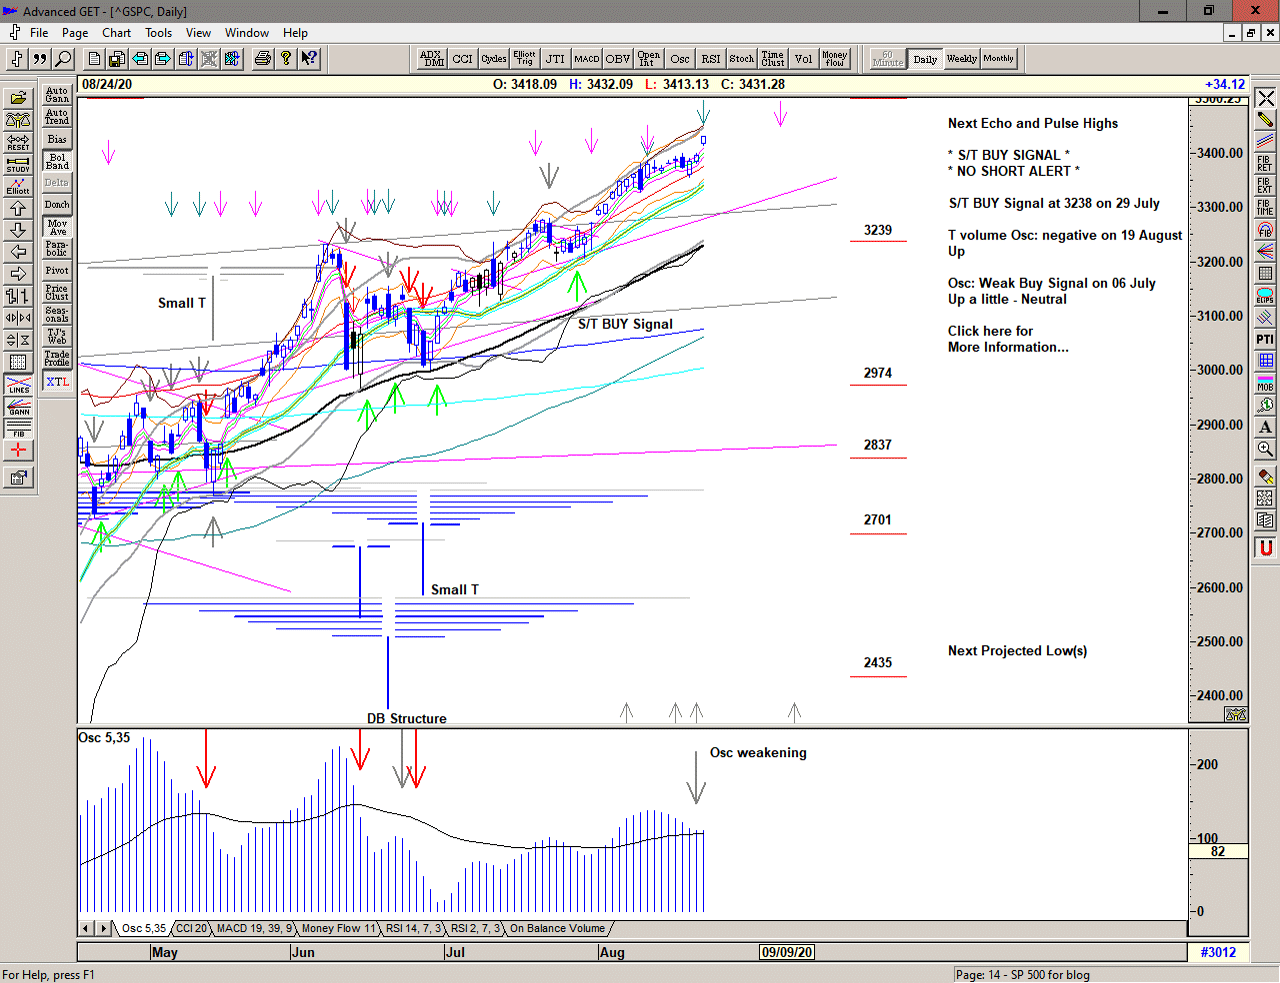
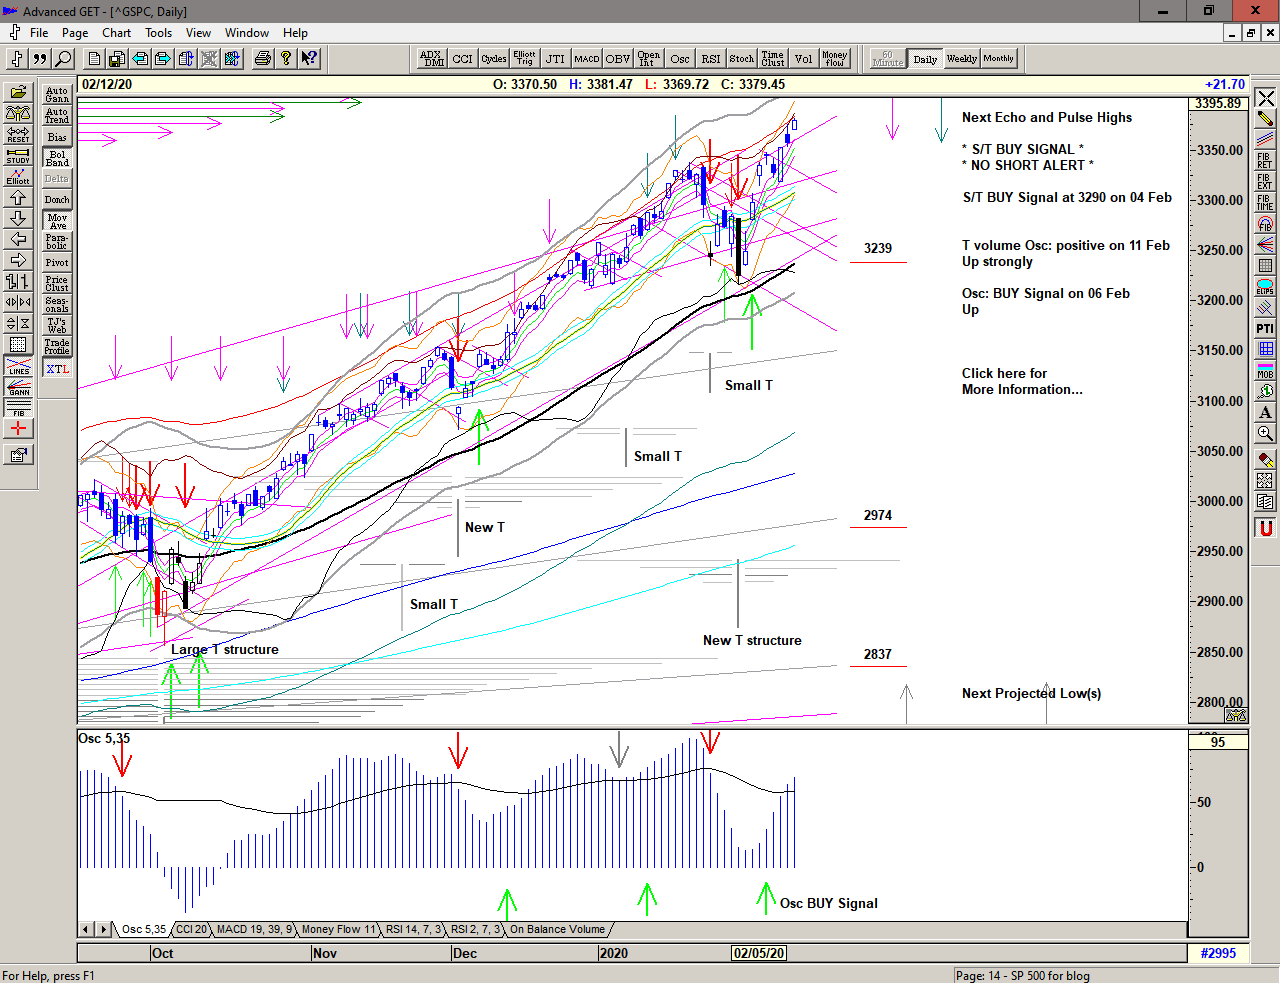
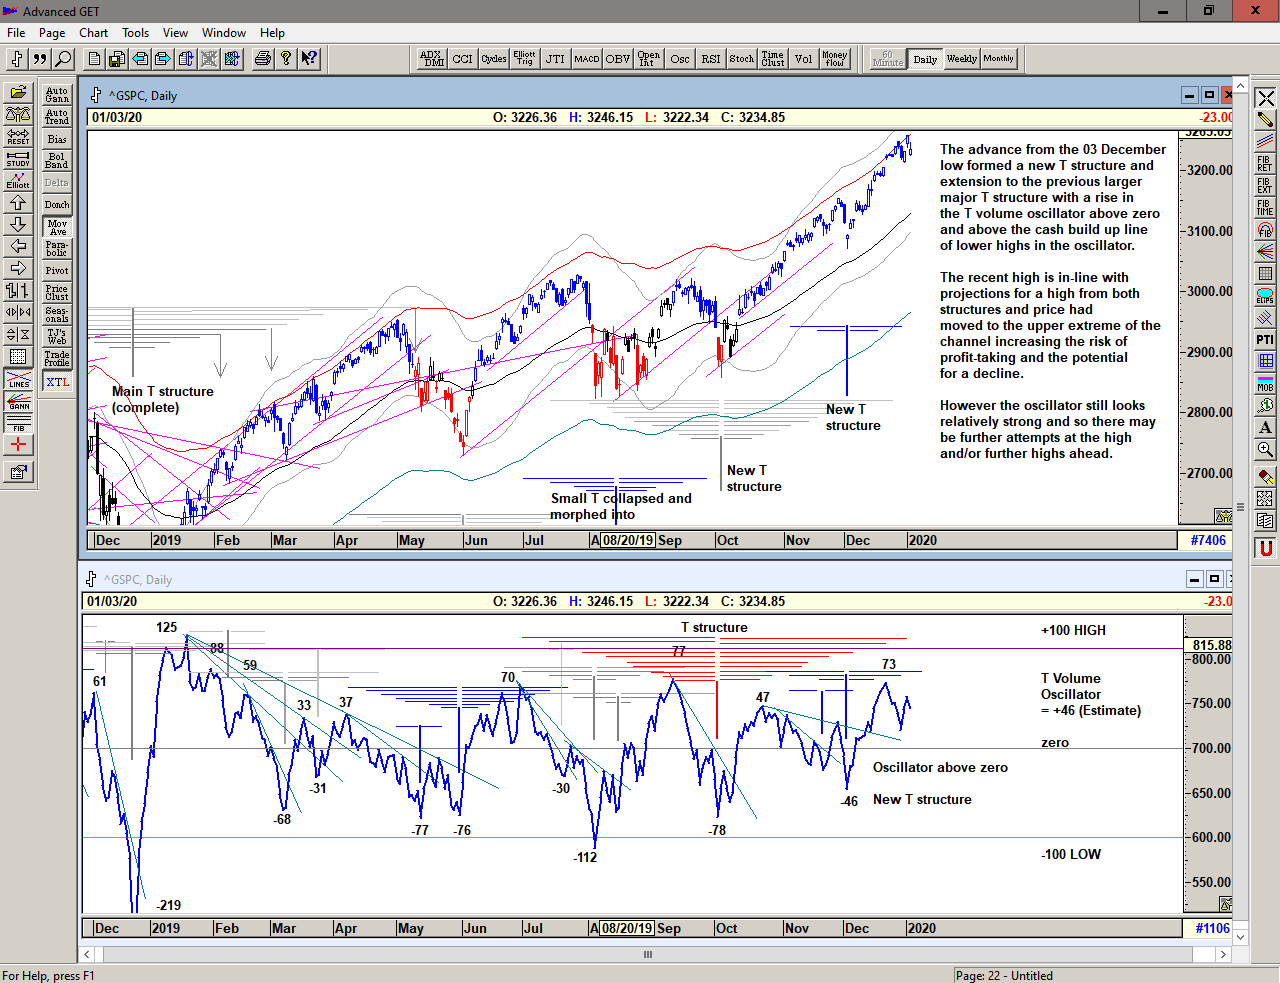
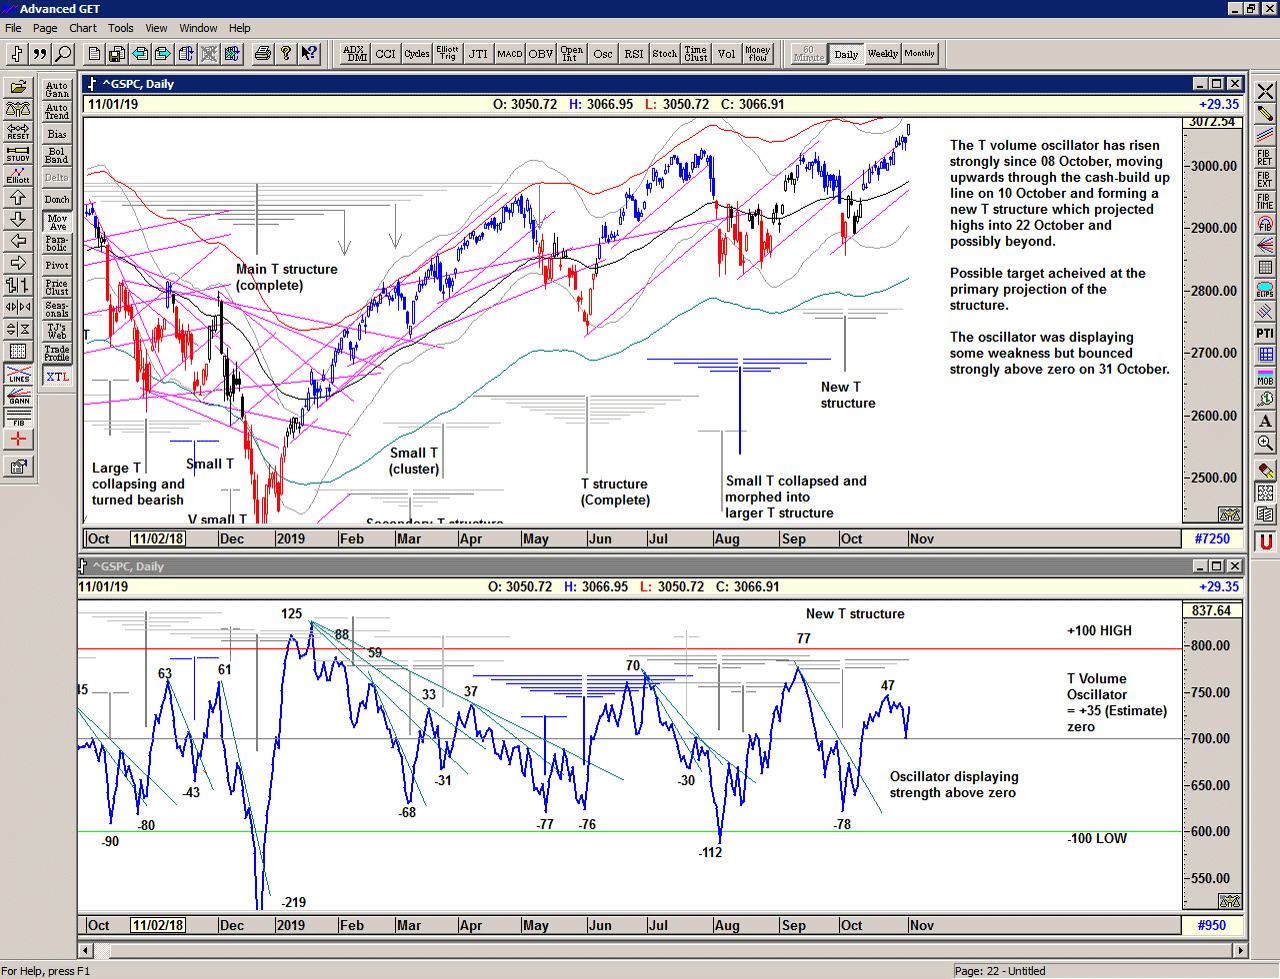
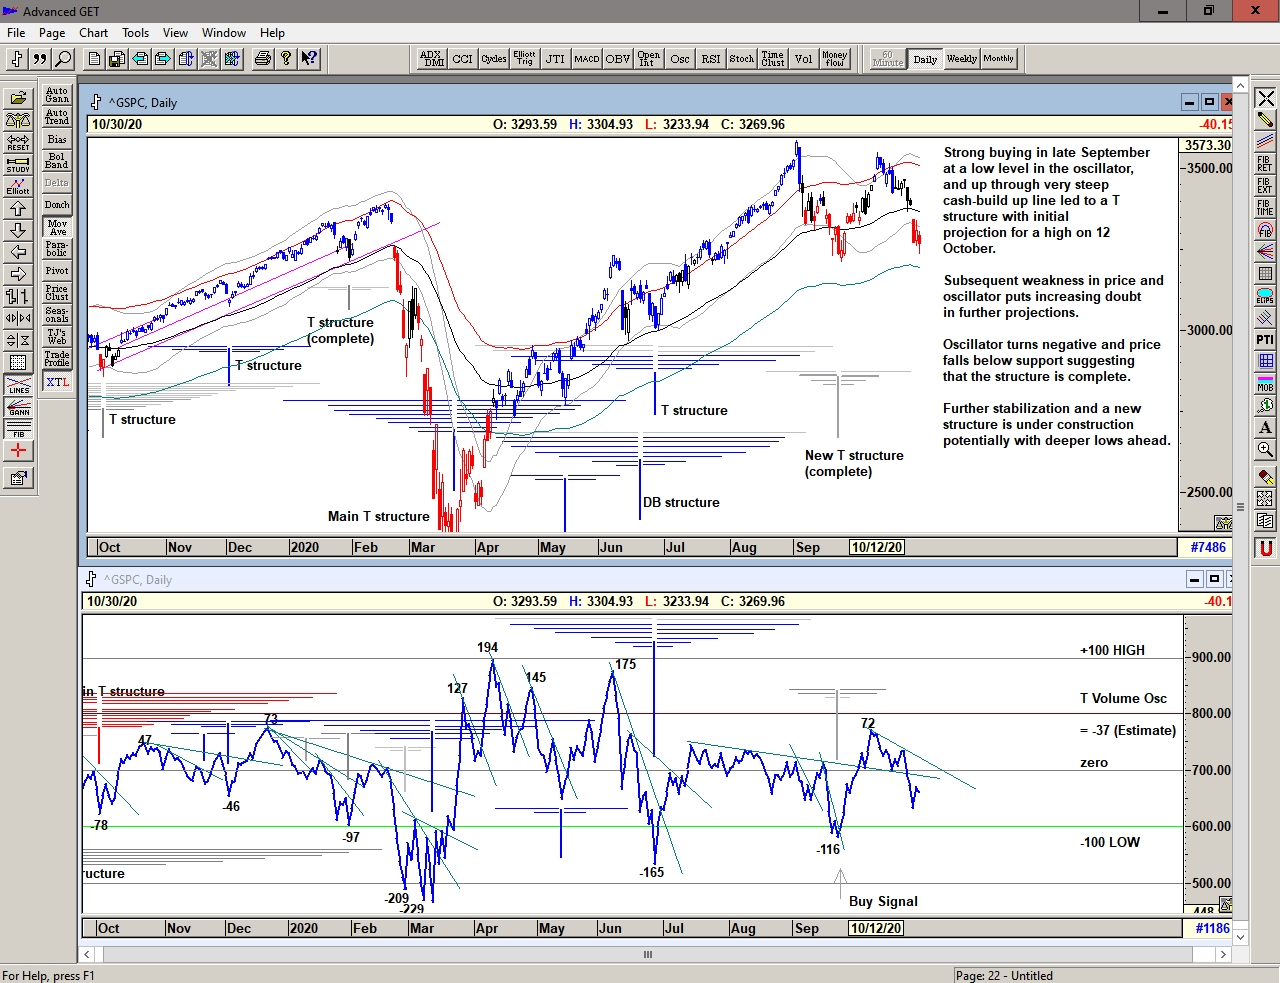
The T volume oscillator* rose rapidly from the very small w pattern at the 23 September low moving up through the cash build-up lines** confirming the buying strength and supporting the emerging T structure centered at that low.
The peak in the oscillator occurred just prior to the October high and although it would be normal for some kind of re-test and/or marking out of the range into exhaustion, the price failure on 26 October confirmed the weakness that had been developing.
On 26 October the oscillator also turns negative, flashing a warning of weakness and distribution and suggesting that the market is again entering a weak phase with plenty of downside risk ahead.
* The T volume oscillator is an indication of Buying Power within the market as a whole
** The cash build-up line is a declining line drawn above a series of lower highs made in the oscillator.
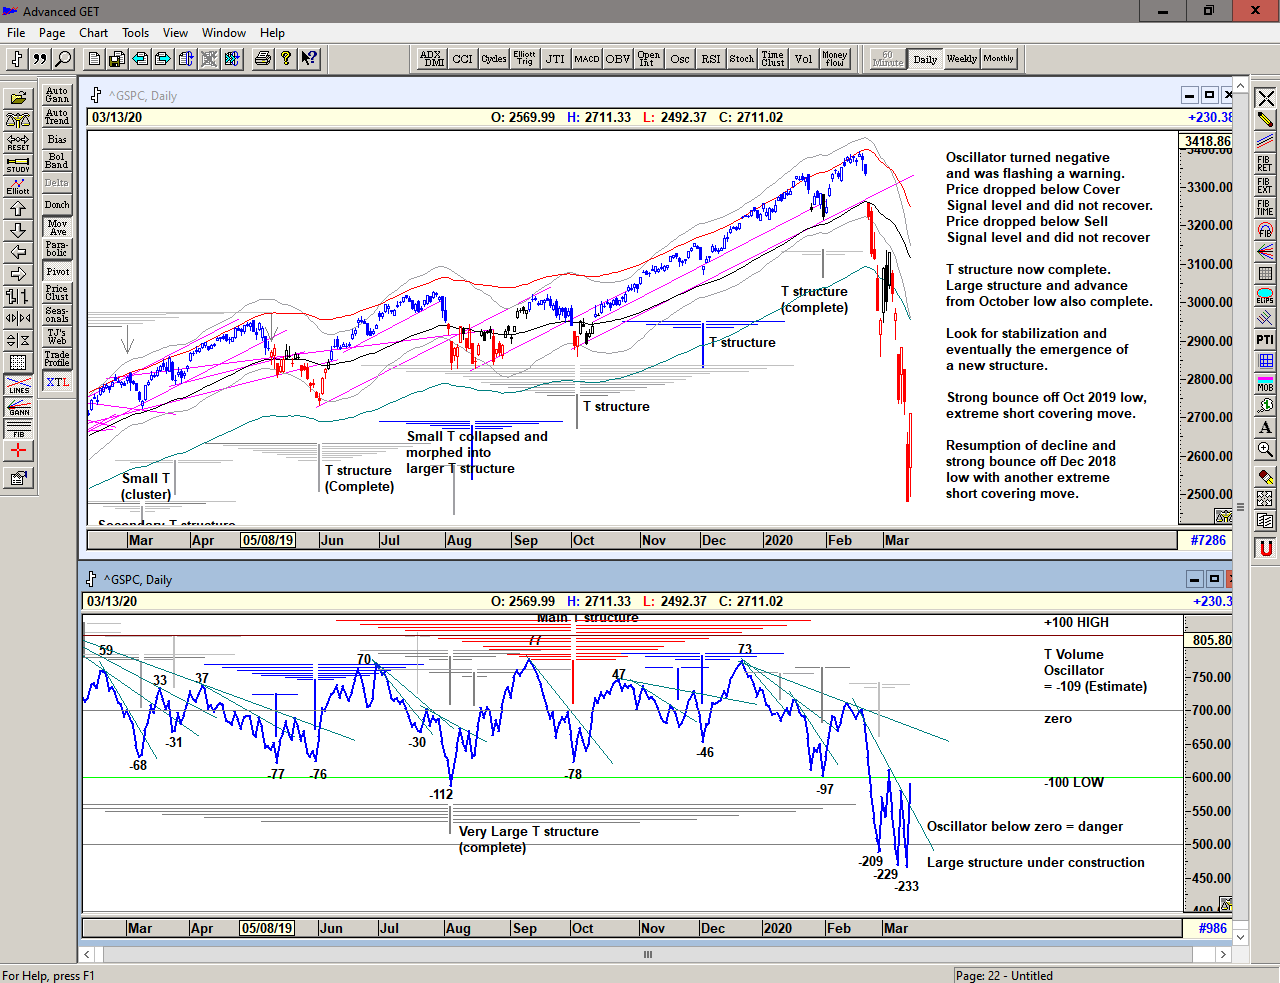
Save the image to your desktop to view a larger version
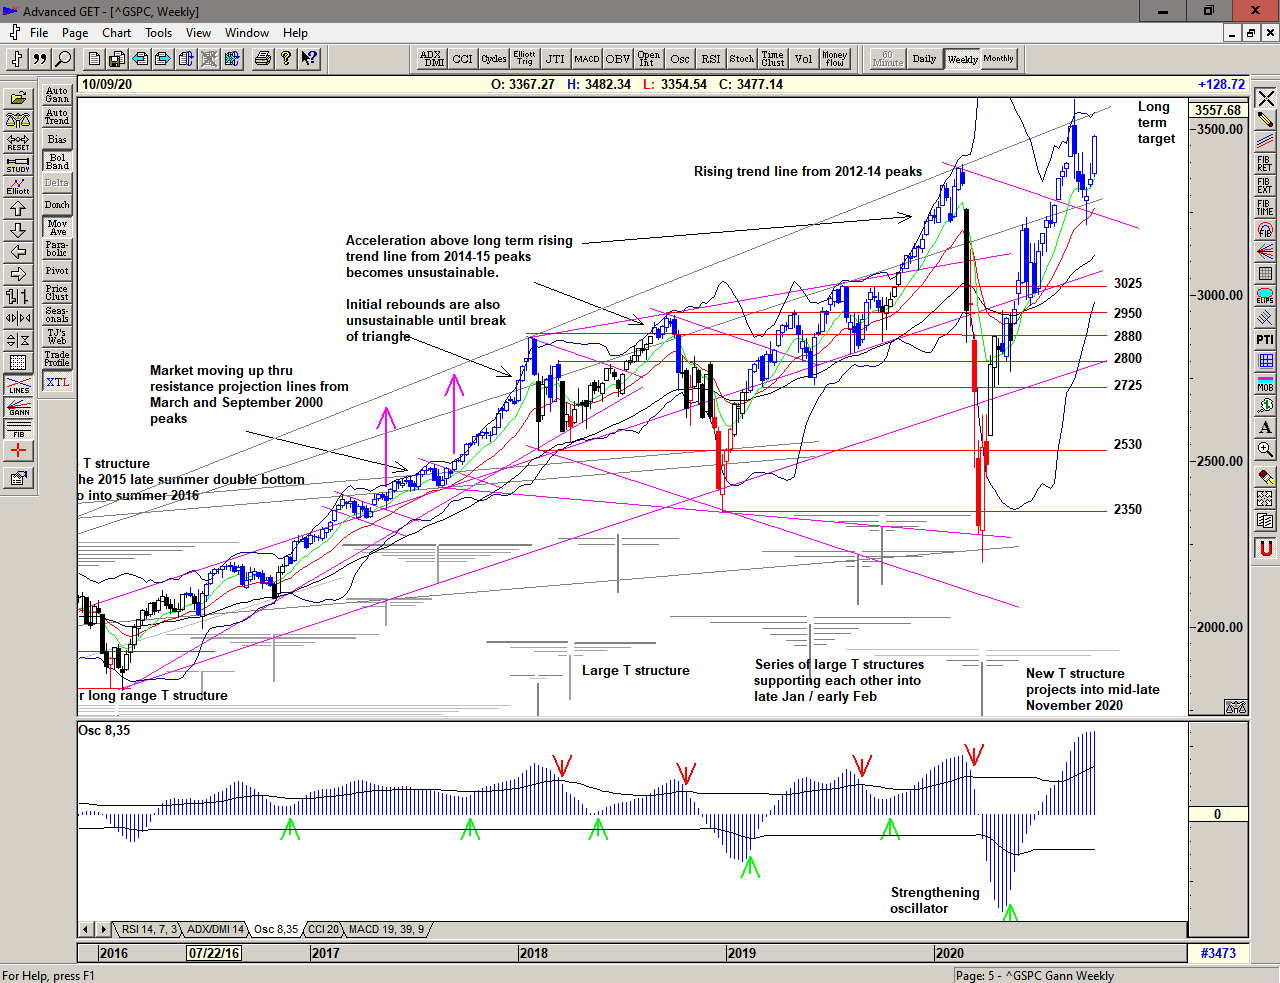
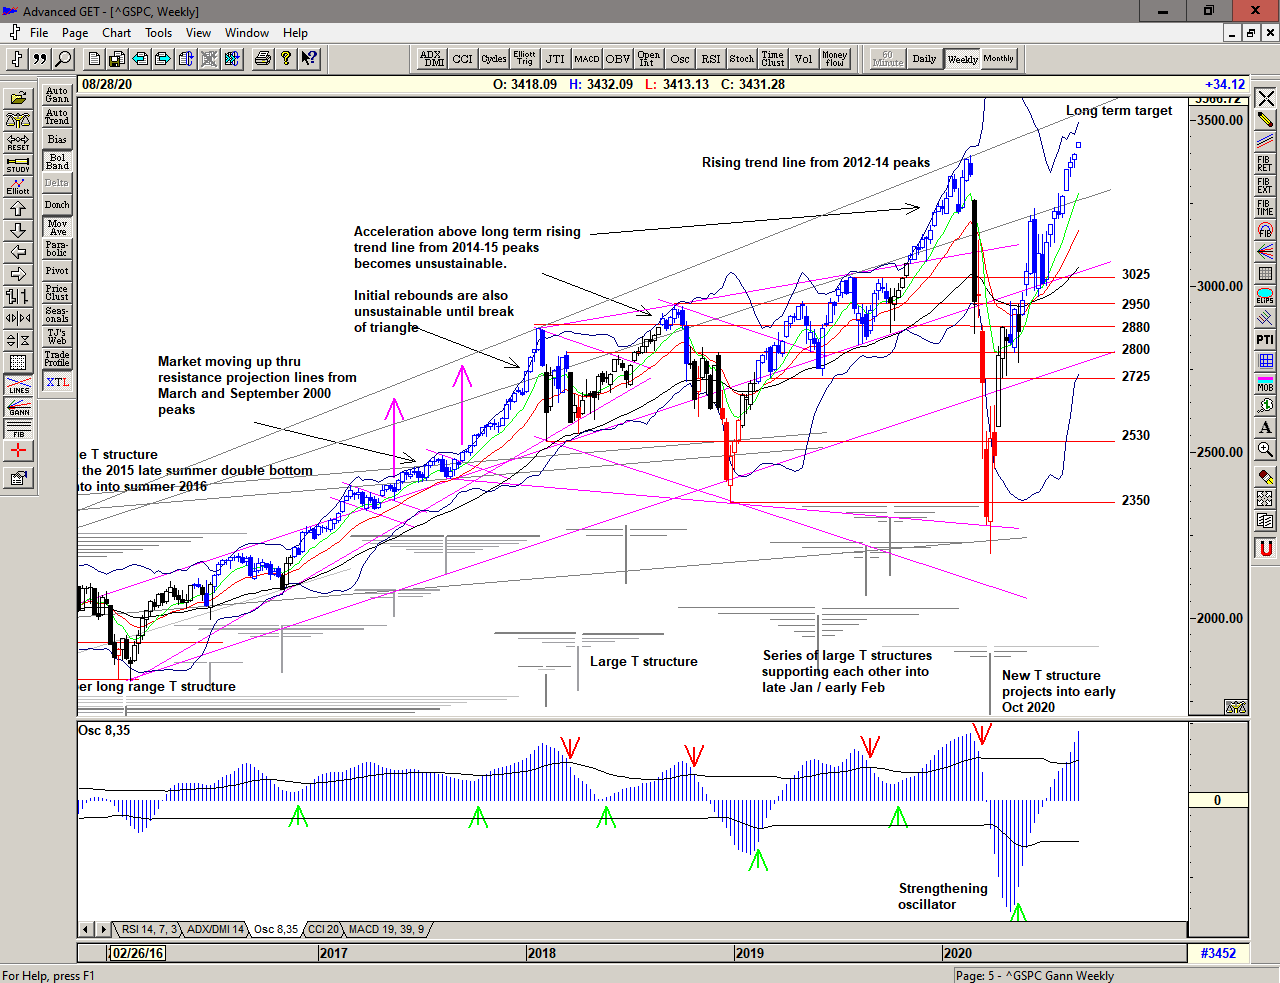
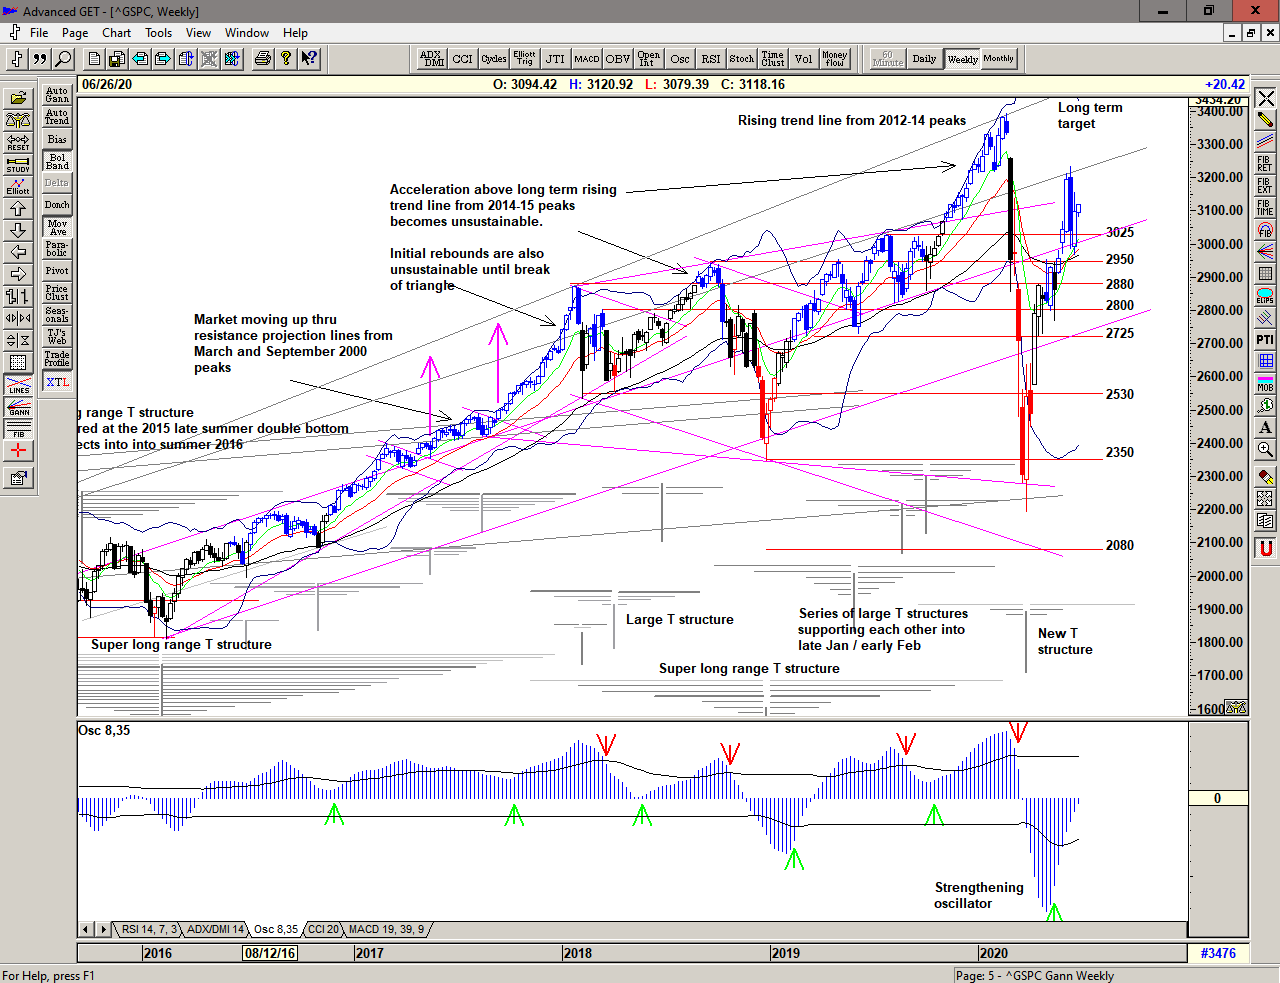
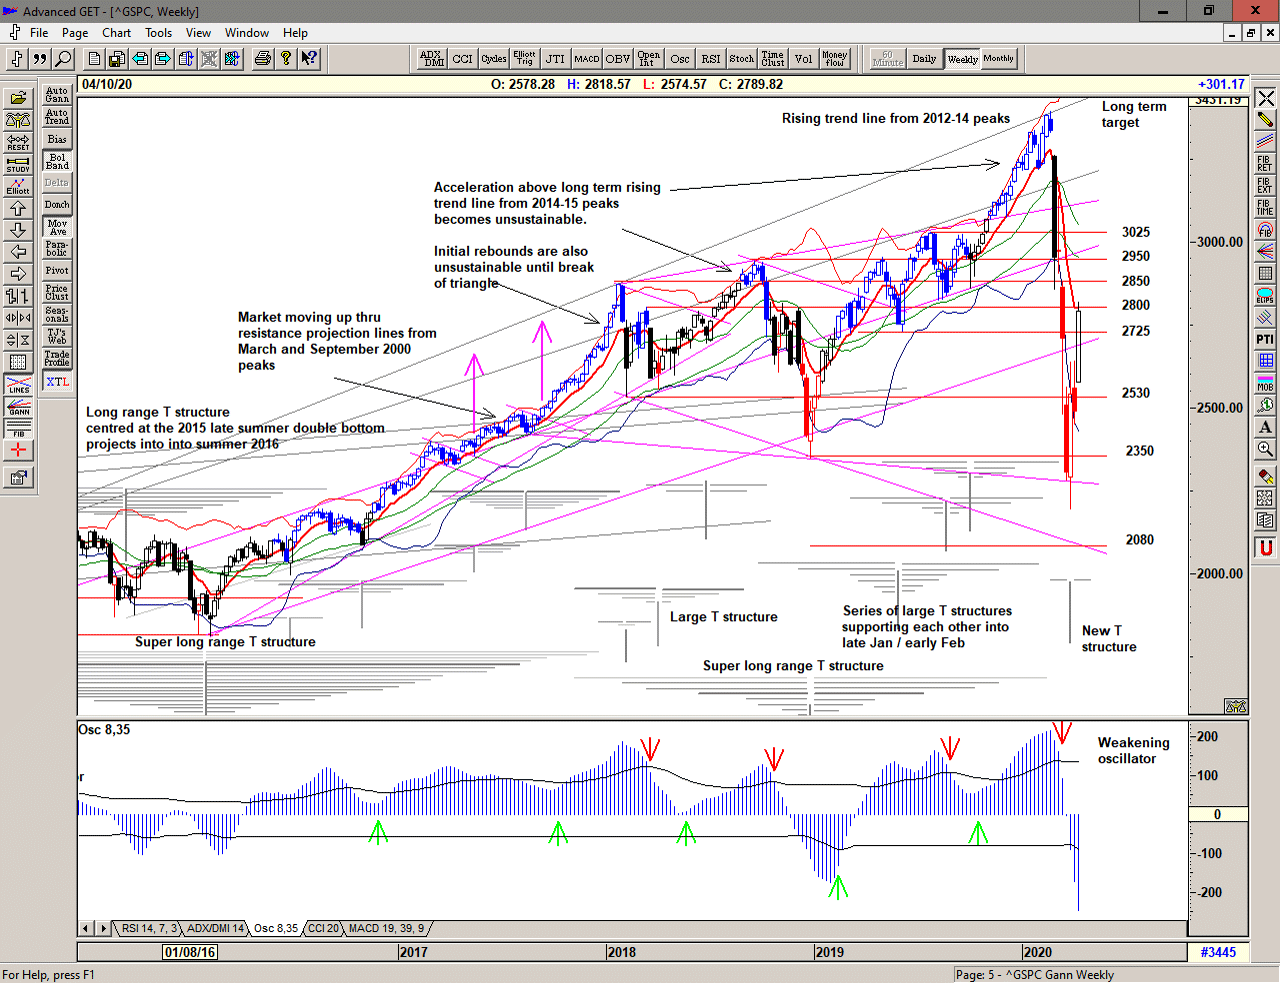
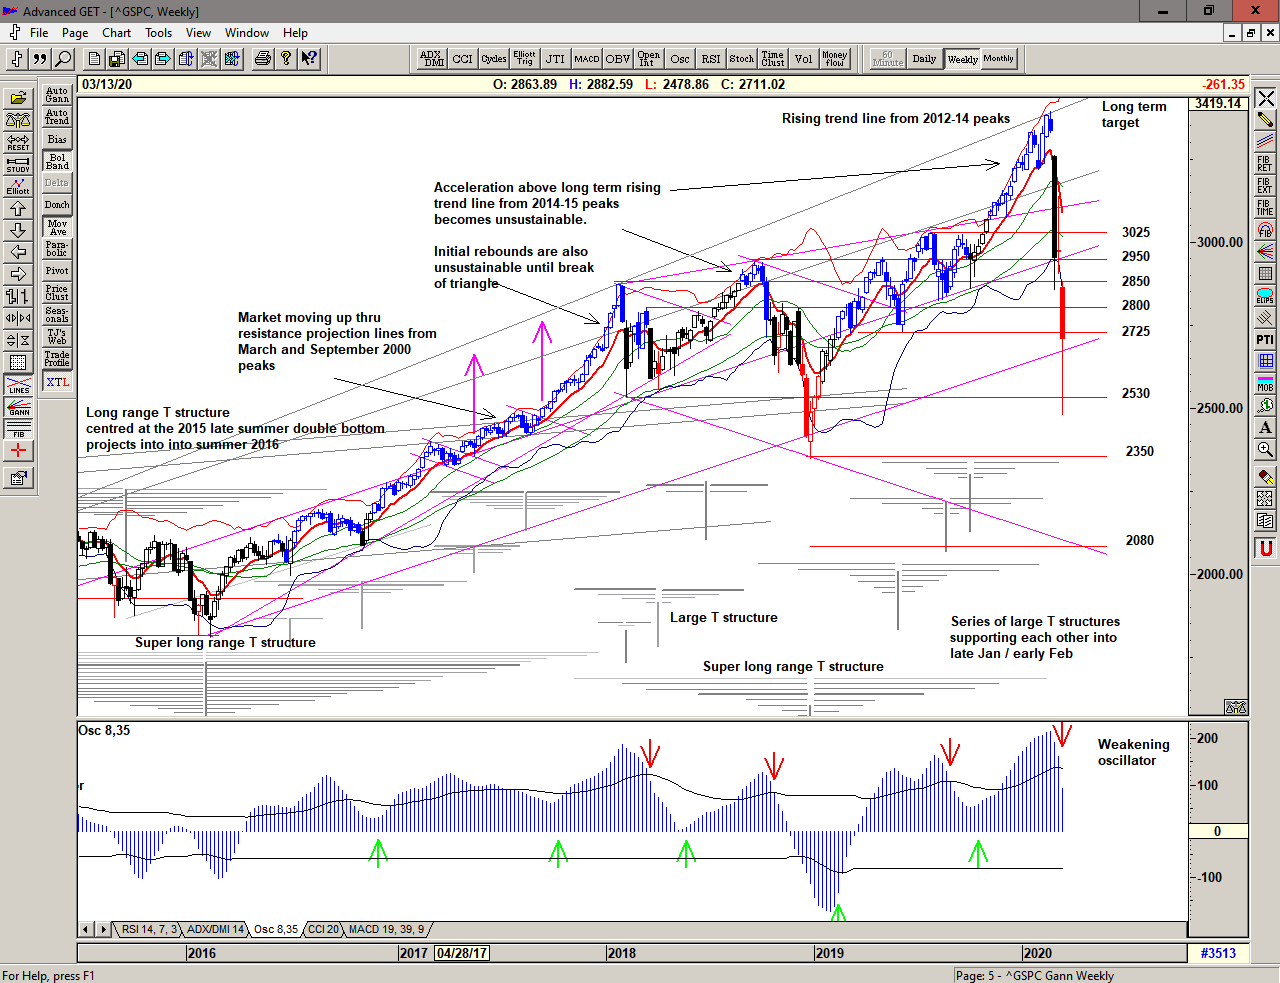
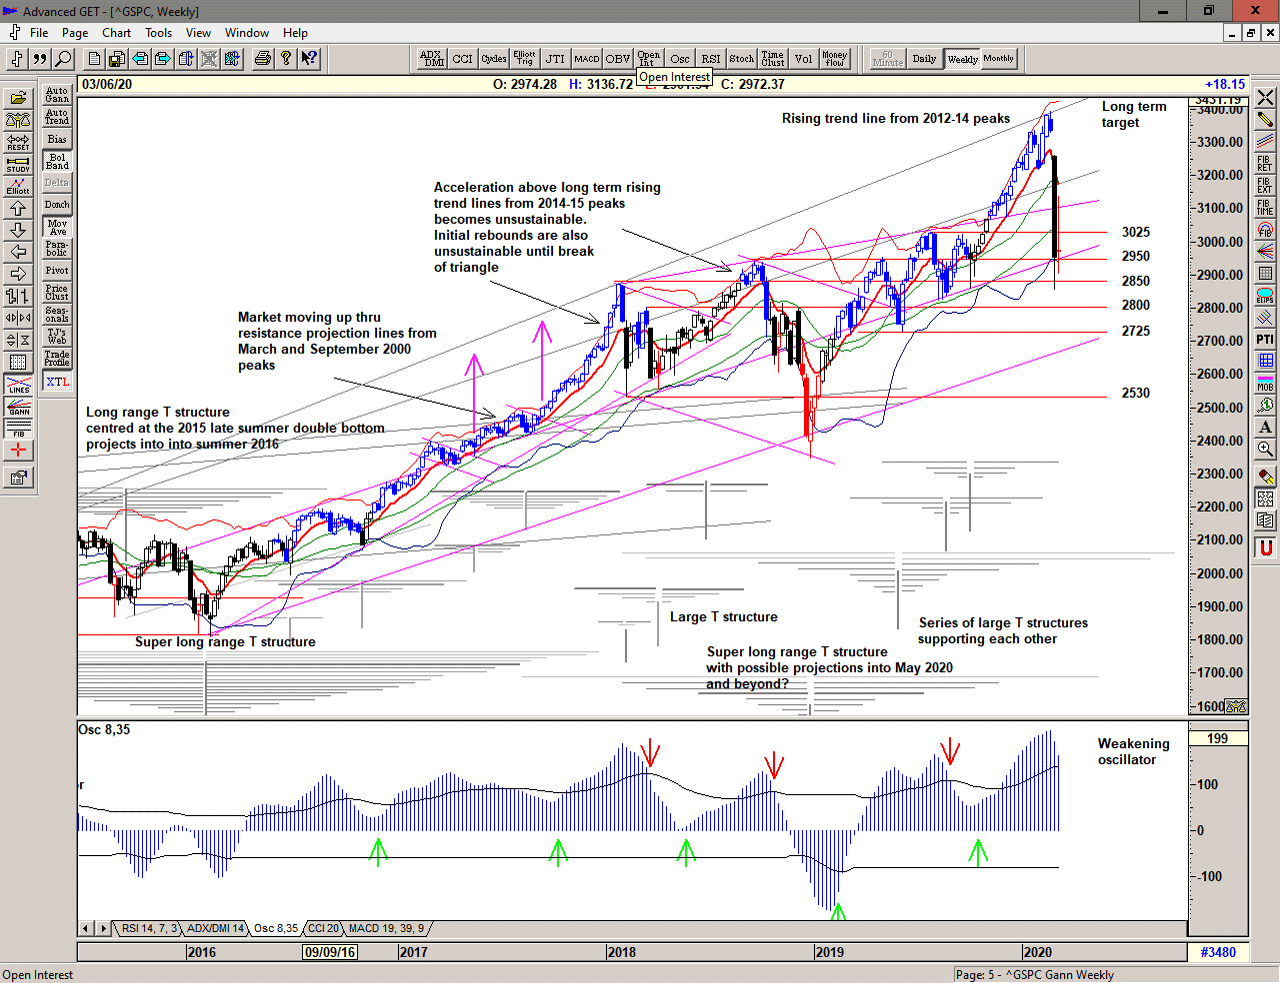
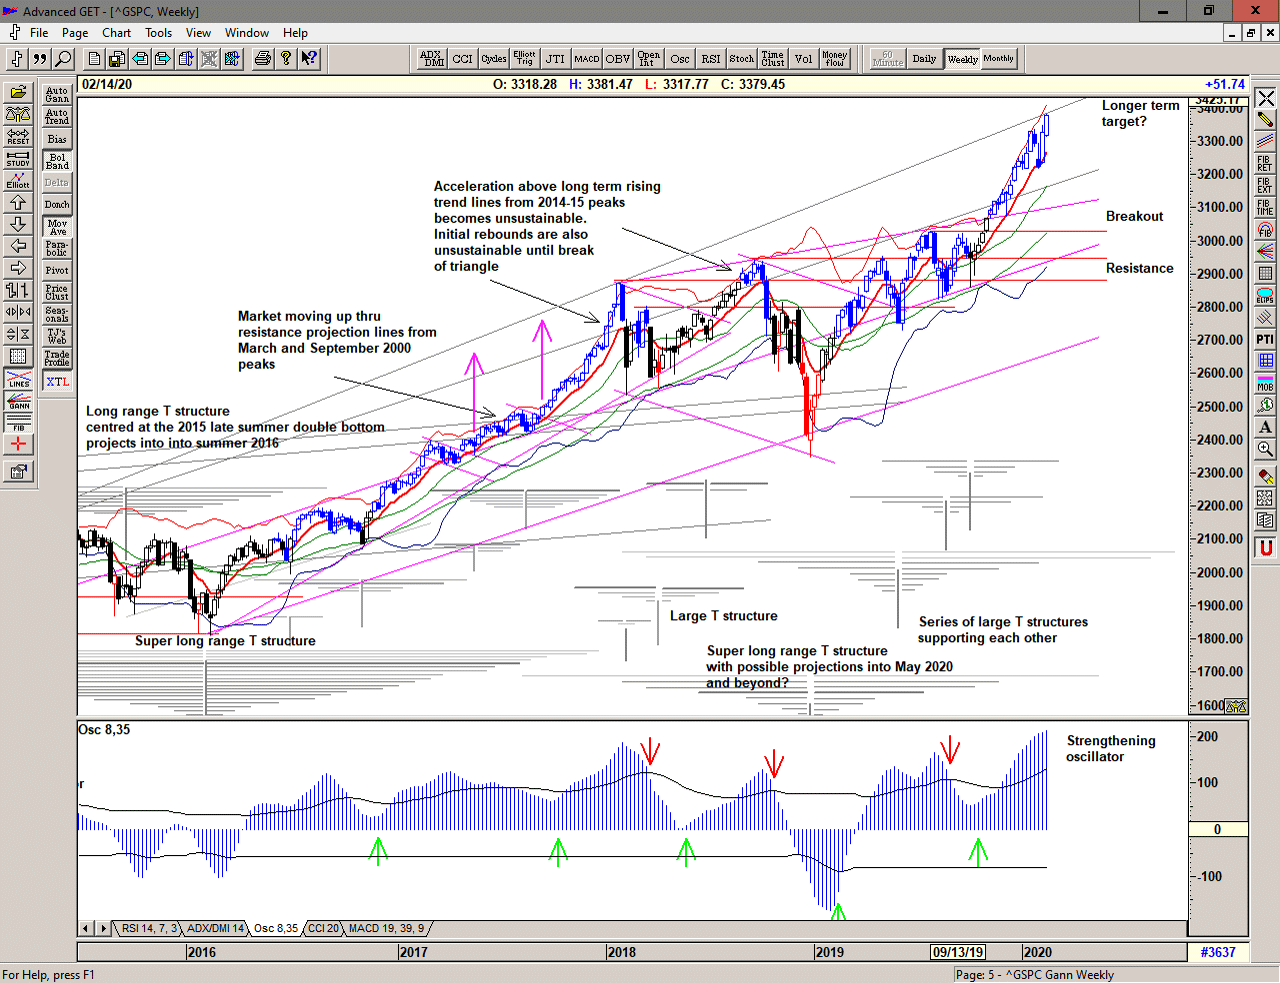
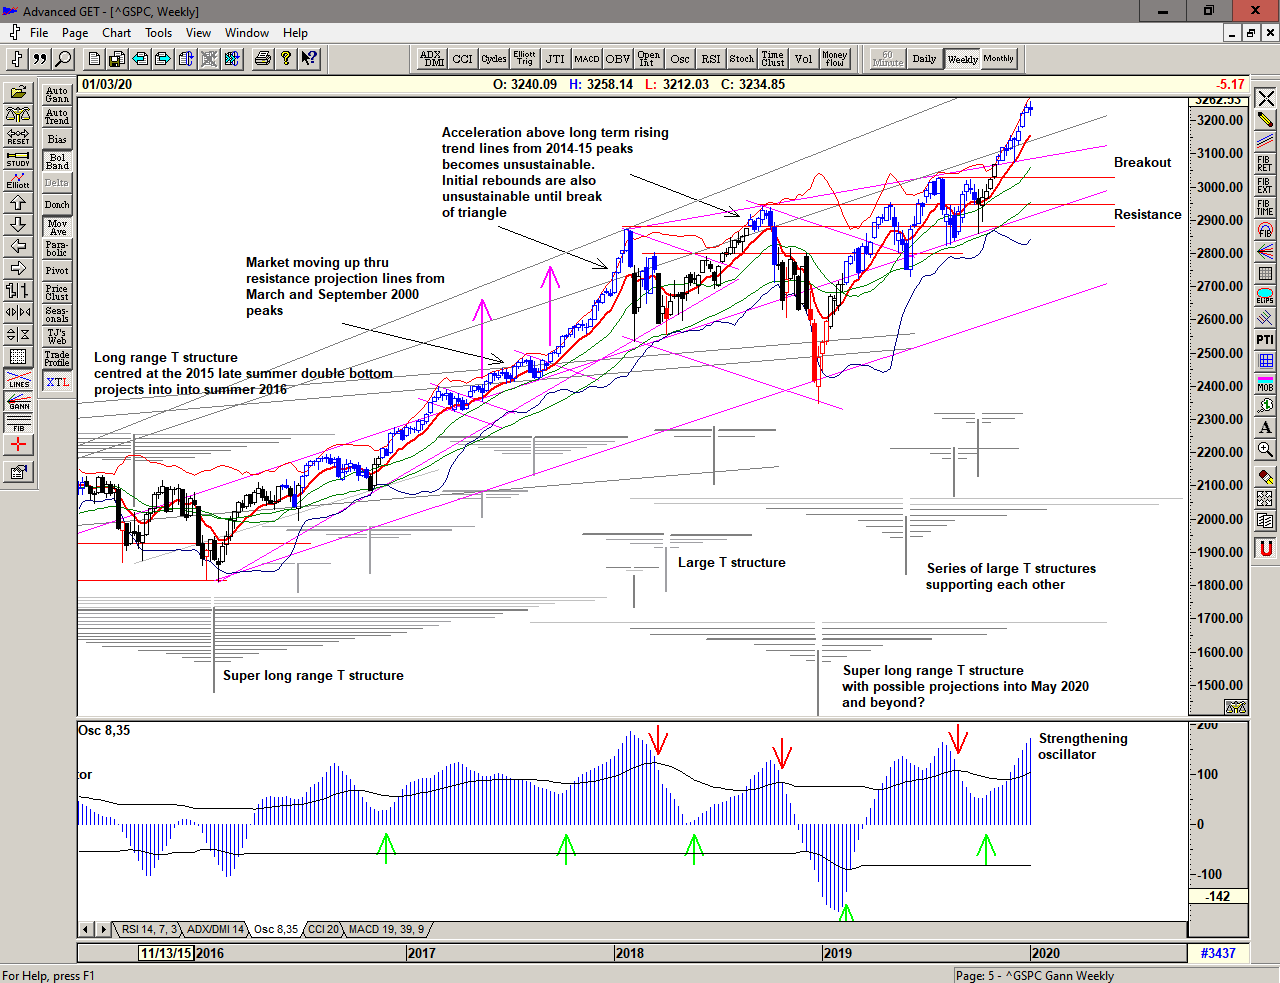
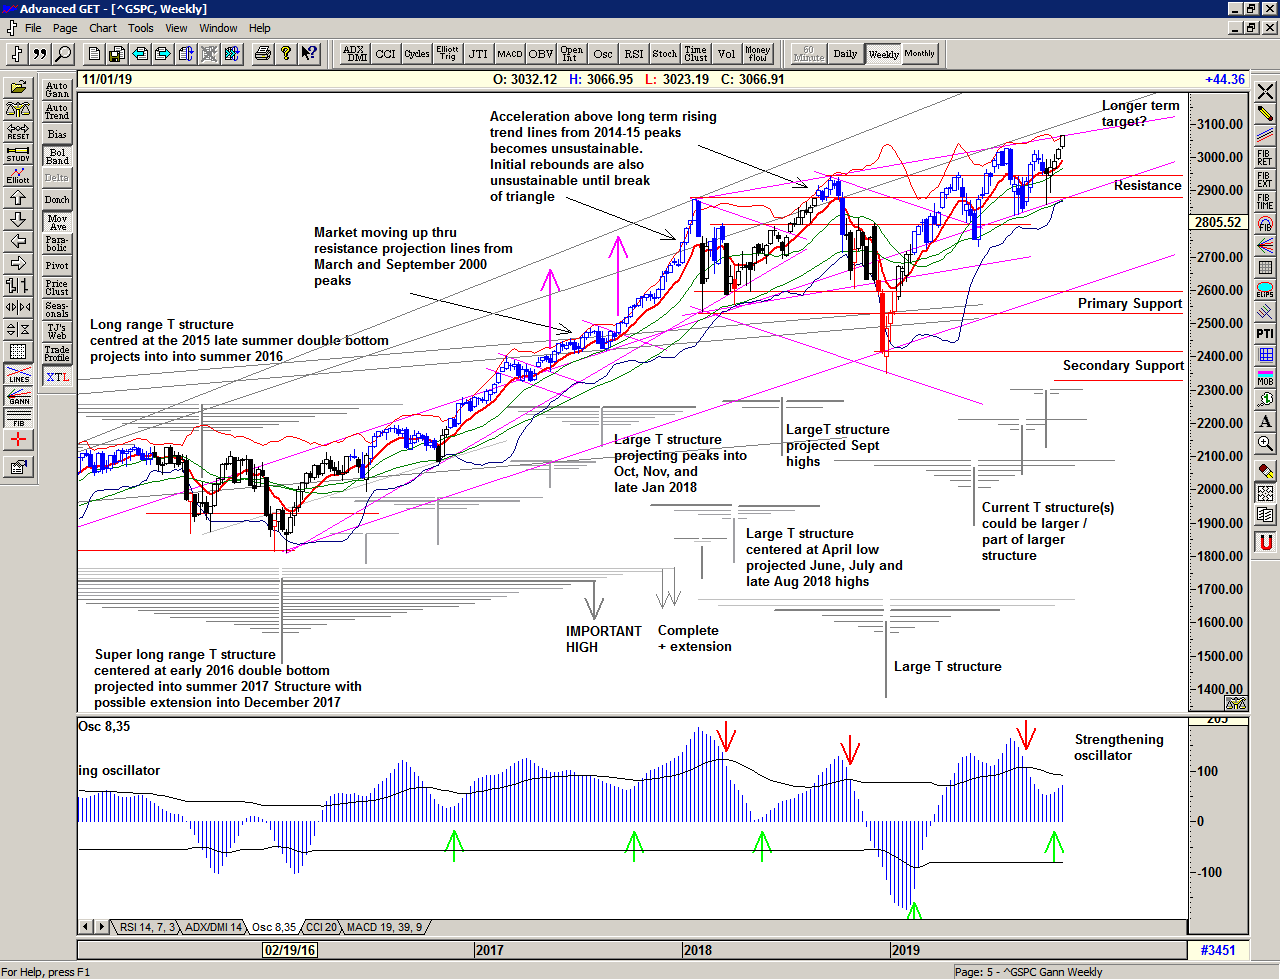
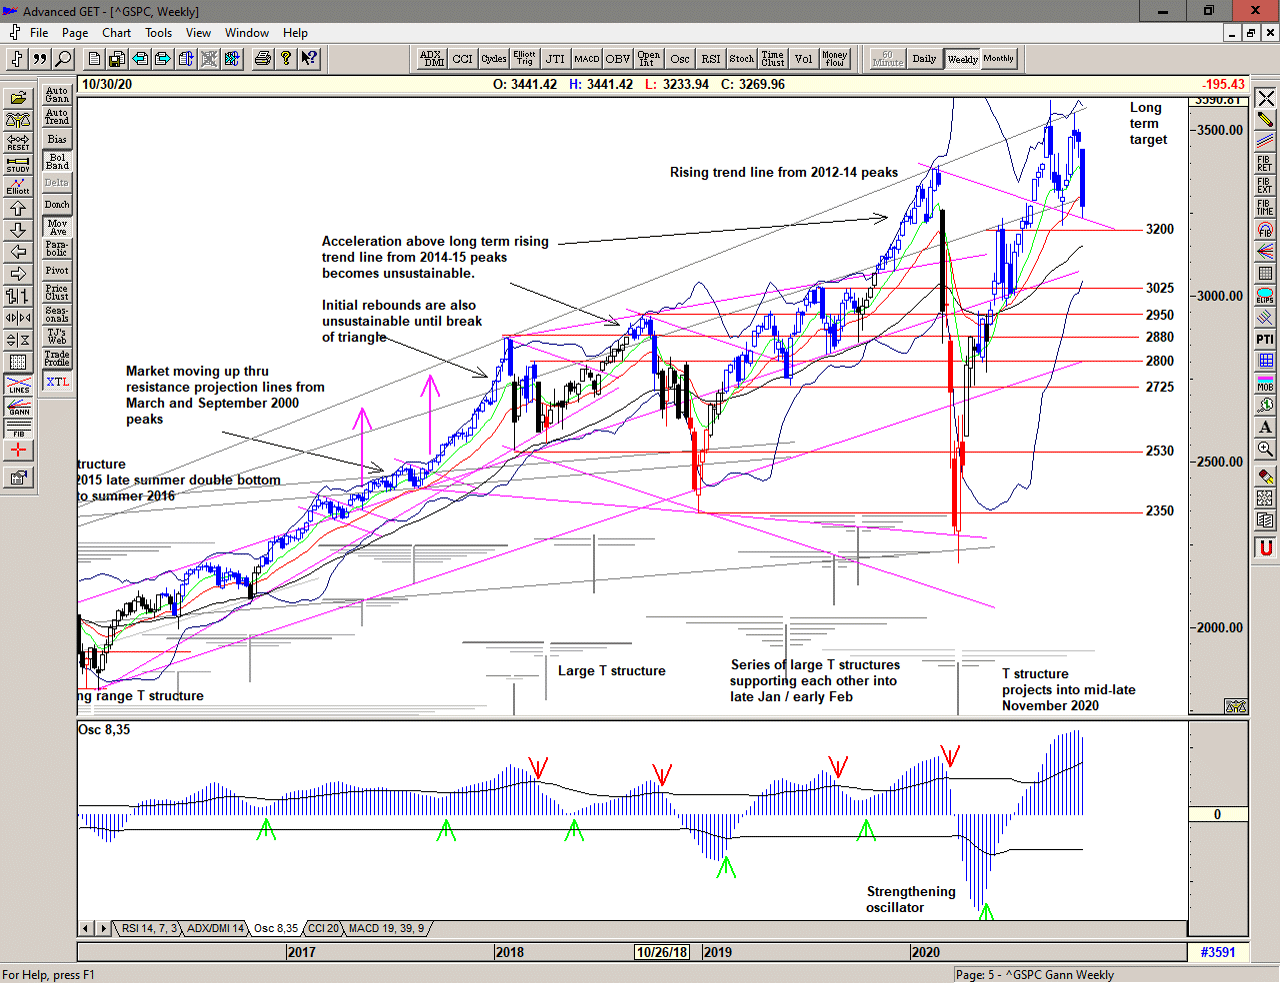
Zooming out to the weekly chart, we can see that price has dropped through the rising green support line in and is now just below the important red support line – an approximate area of support when approached from above for a bounce but also a dangerous area to penetrate with the potential for significantly lower prices once broken.
For now, a very ugly looking situation with a lower high or double top in play with possible support levels at previous highs and lows below. A strong recovery back above the green support line would be needed to change the picture.
The large weekly T structure centered on the March low did potentially project the October high (slightly early) and maybe projects into the week of November 20 – a post Election high? A recovery attempt? Perhaps a lower high? We shall see.
Save the image to your desktop to view a larger version
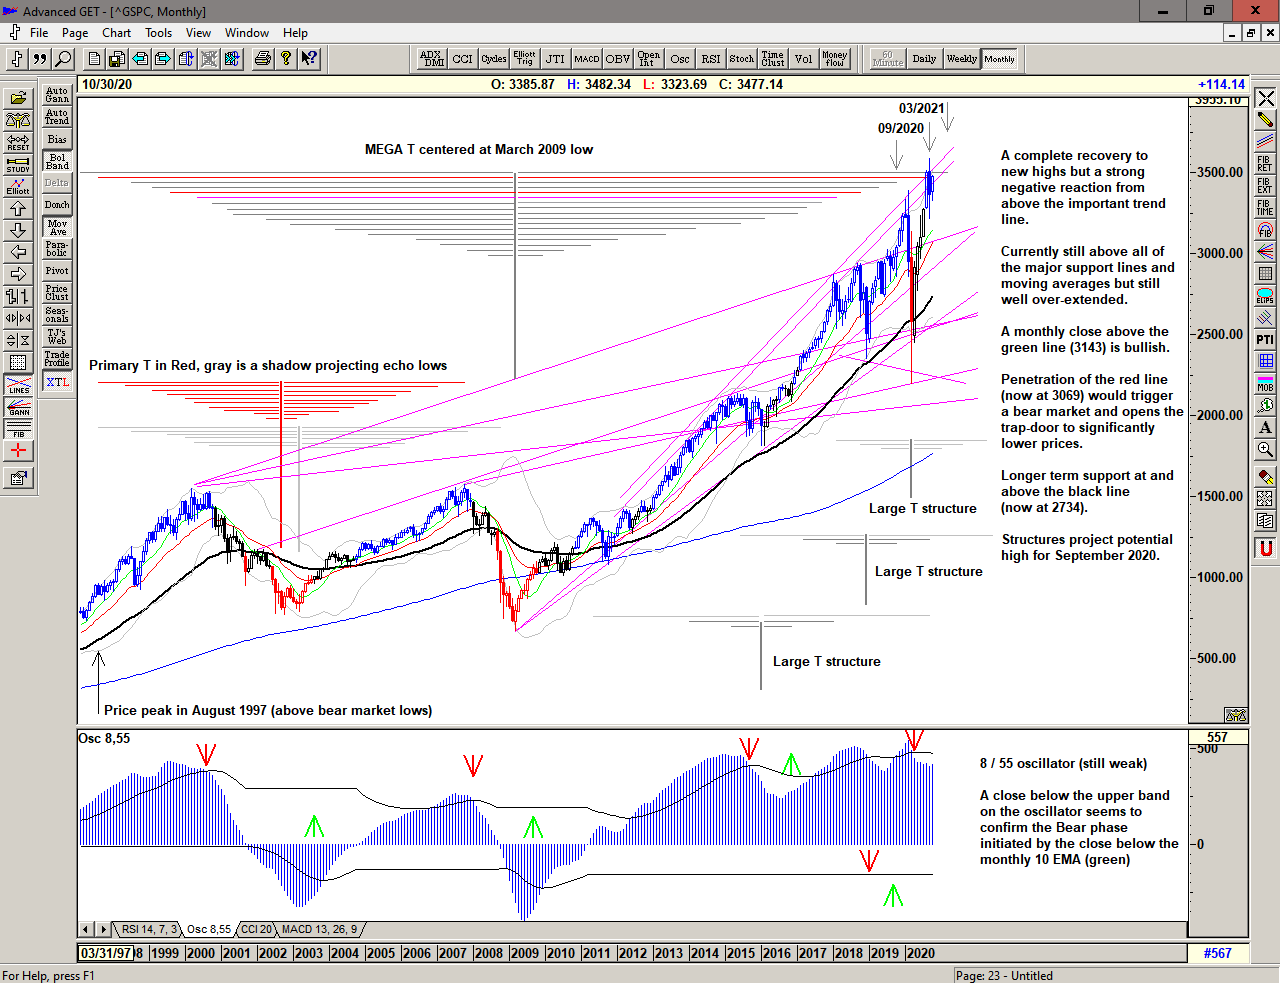
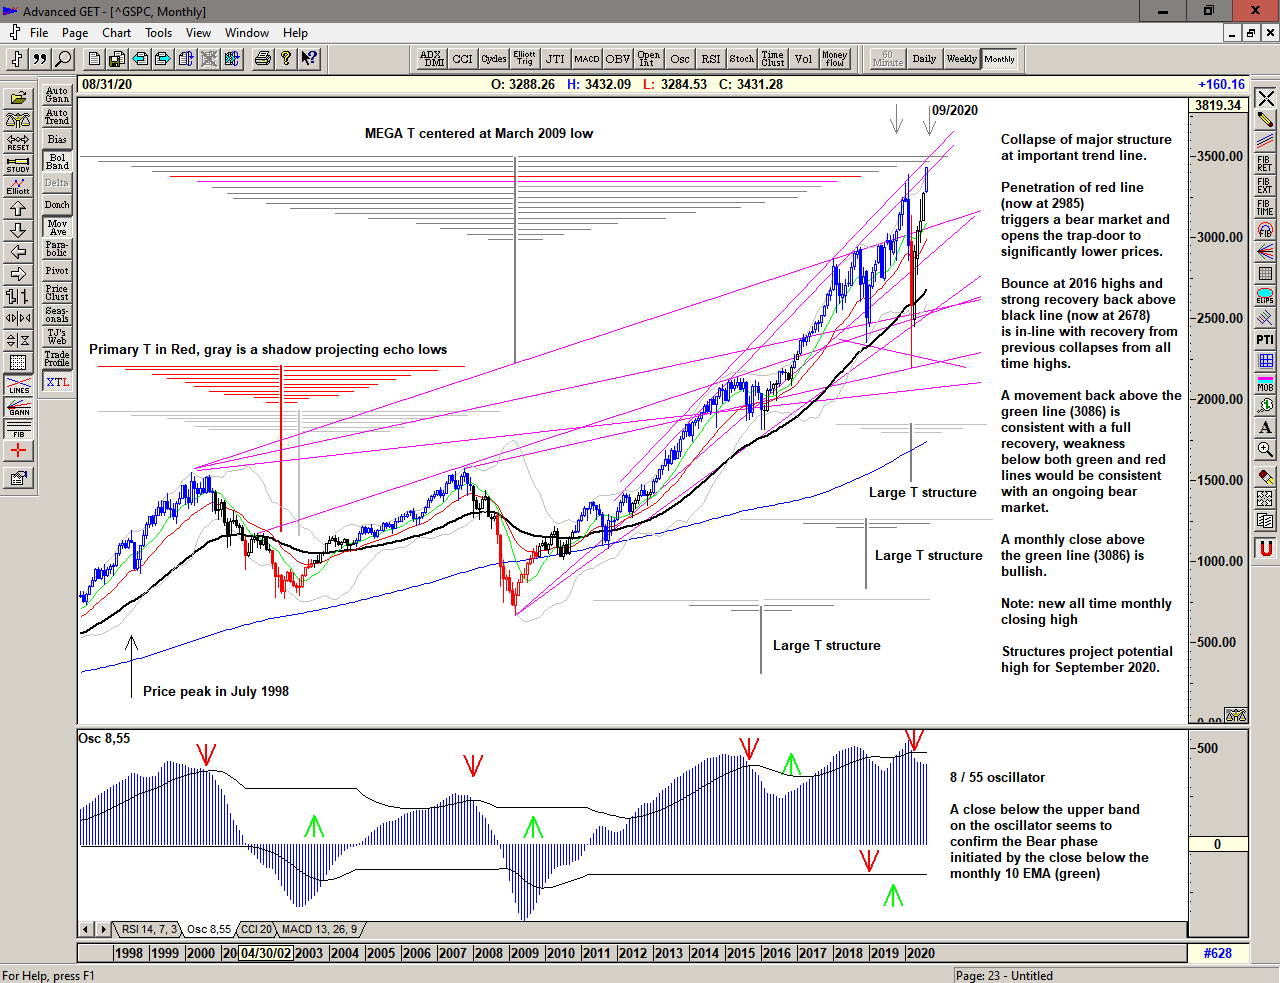
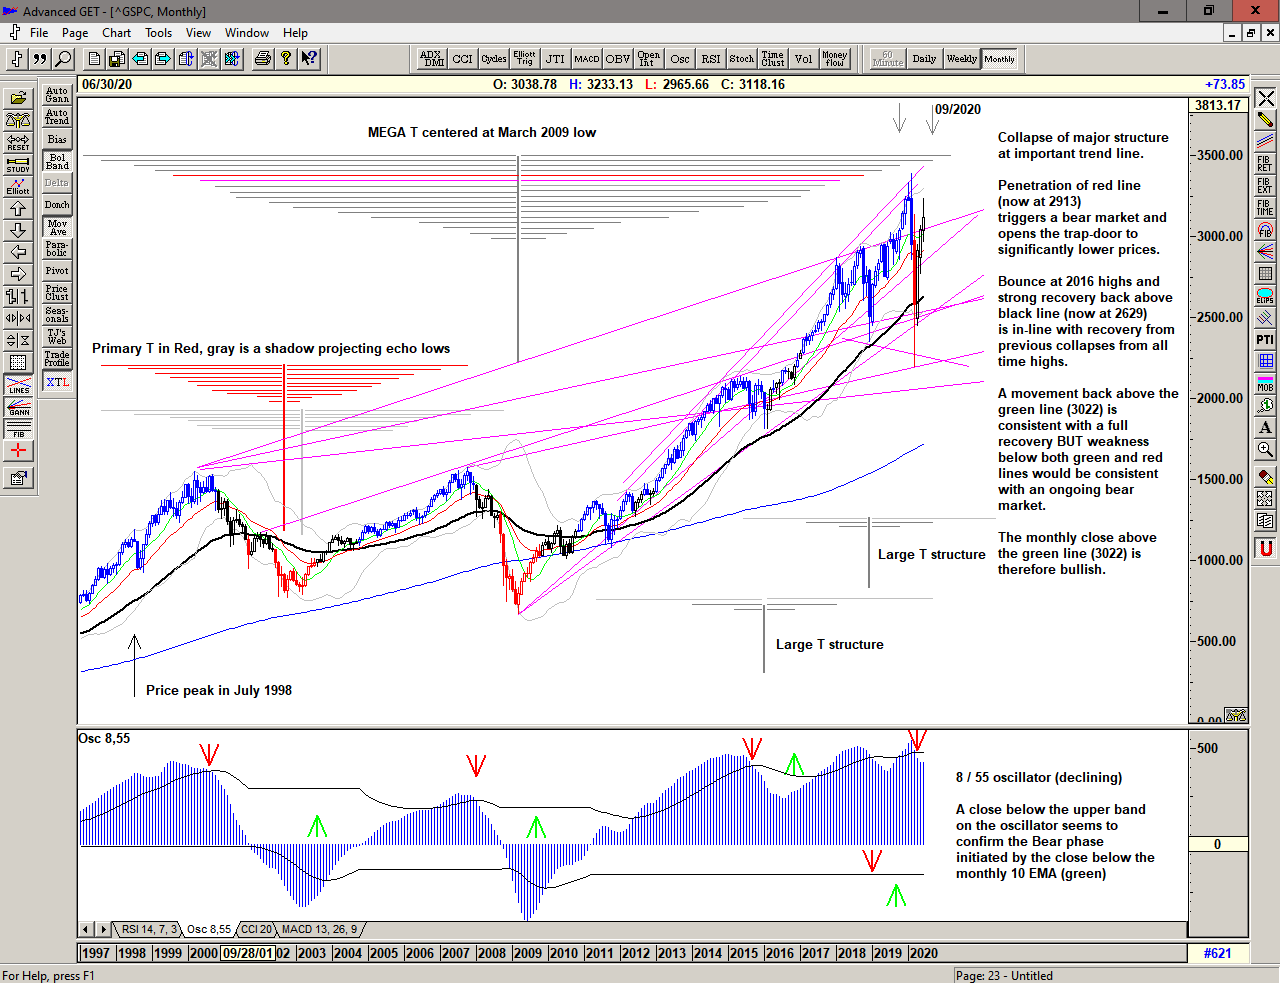
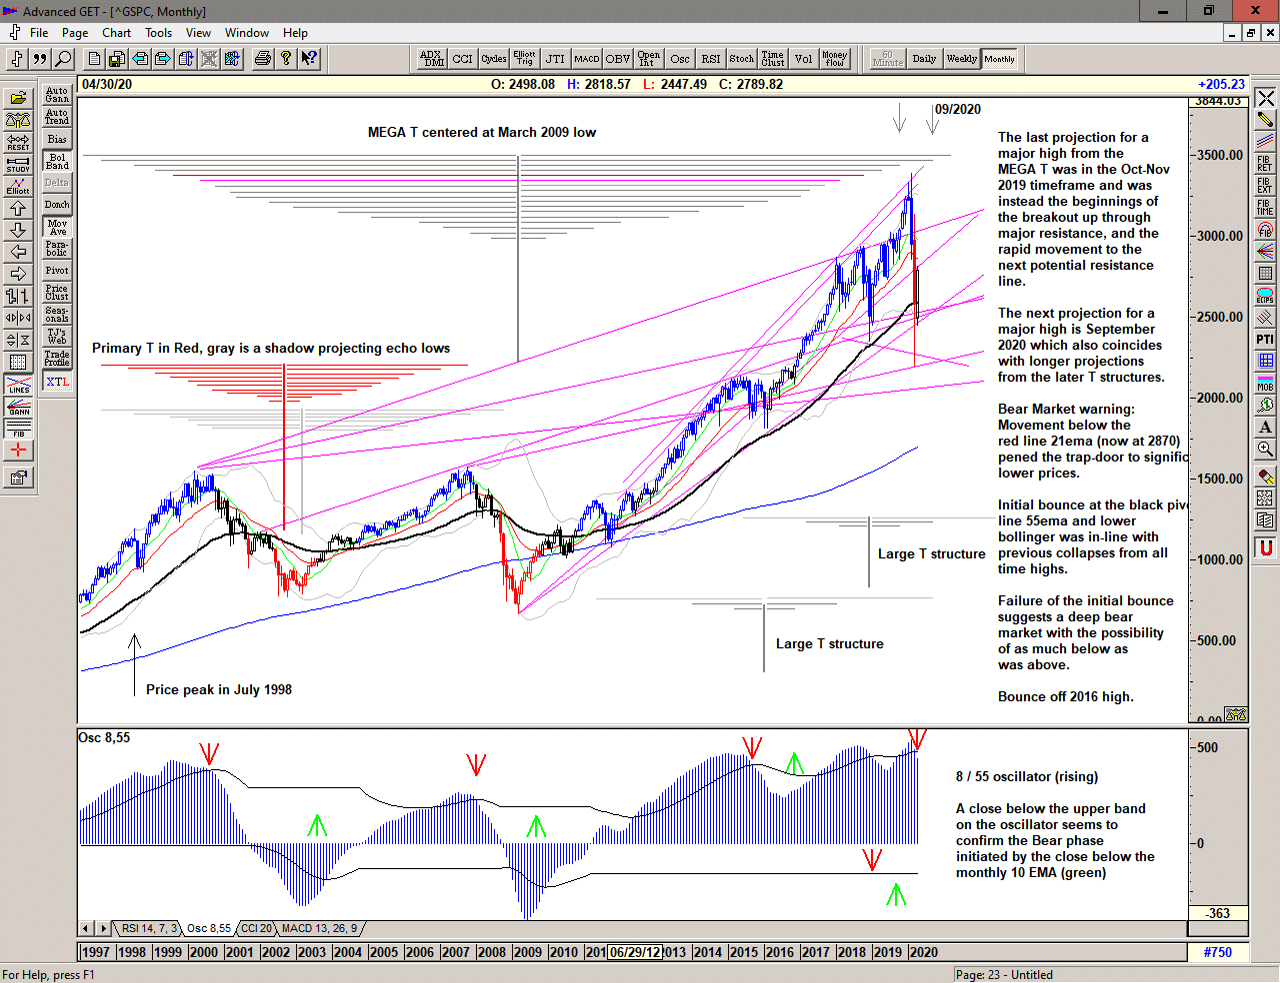
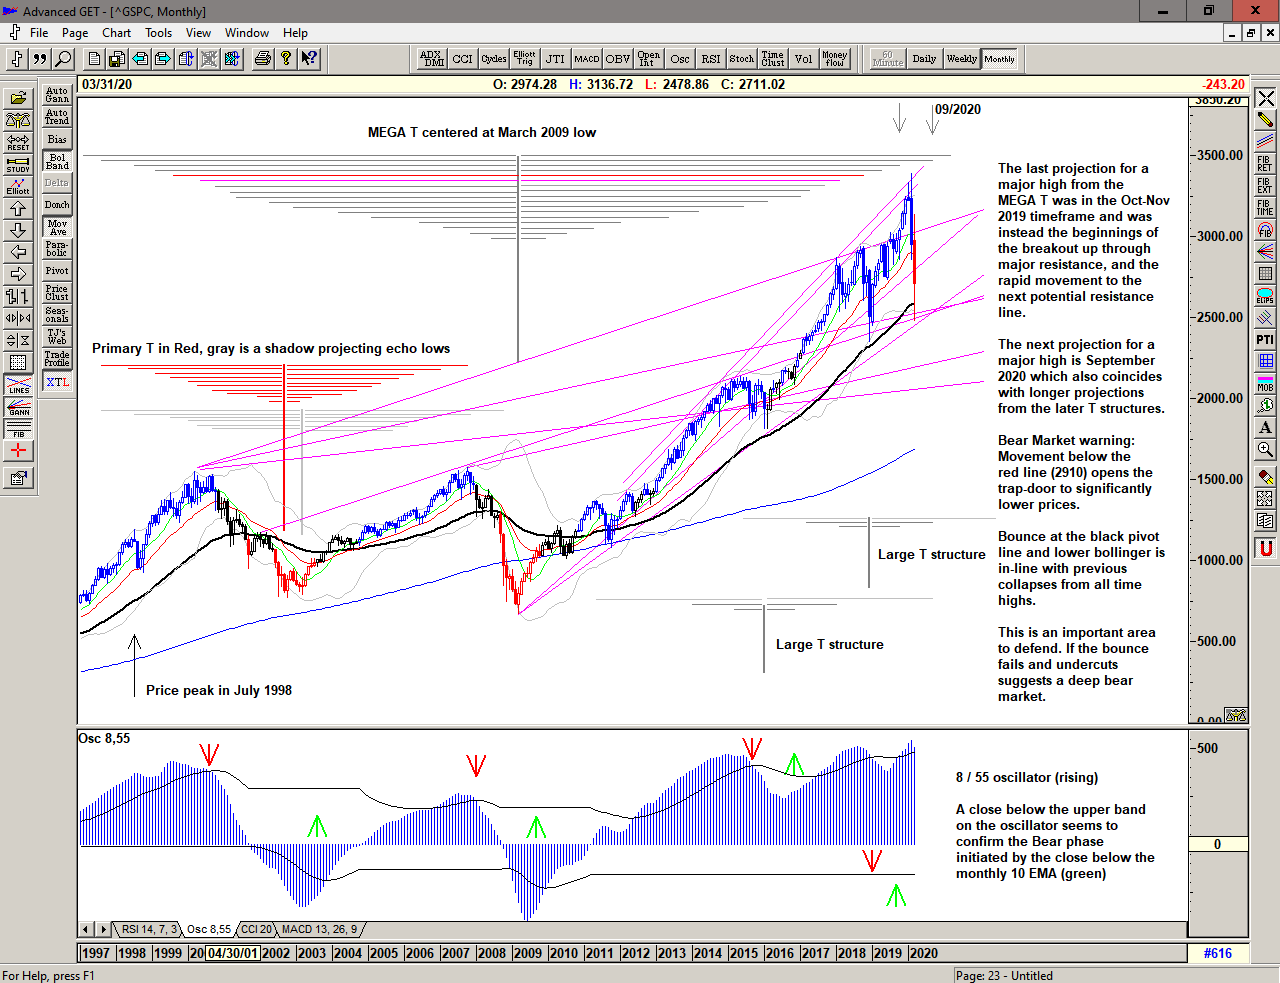
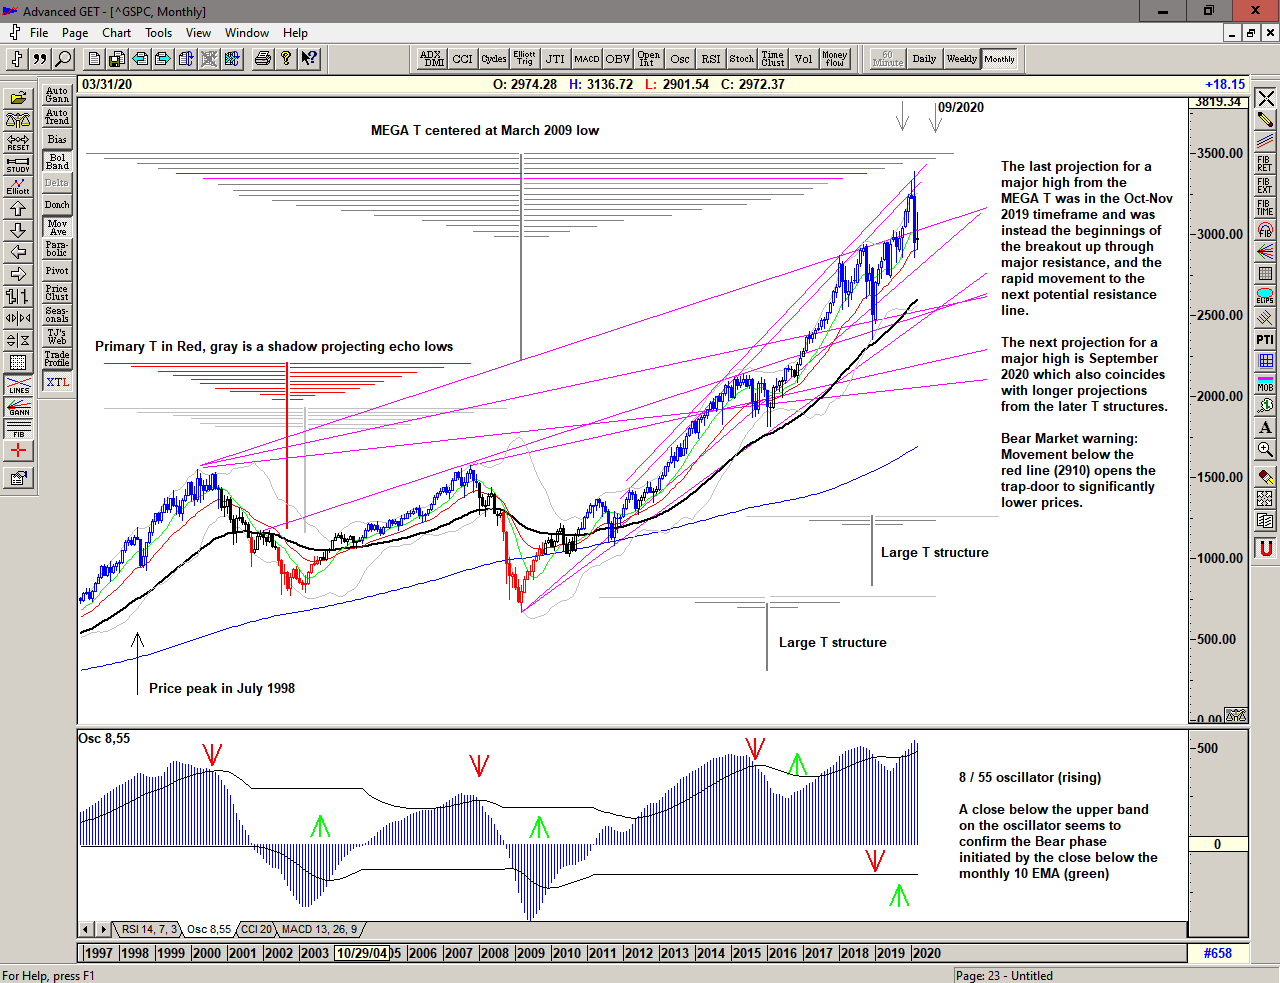
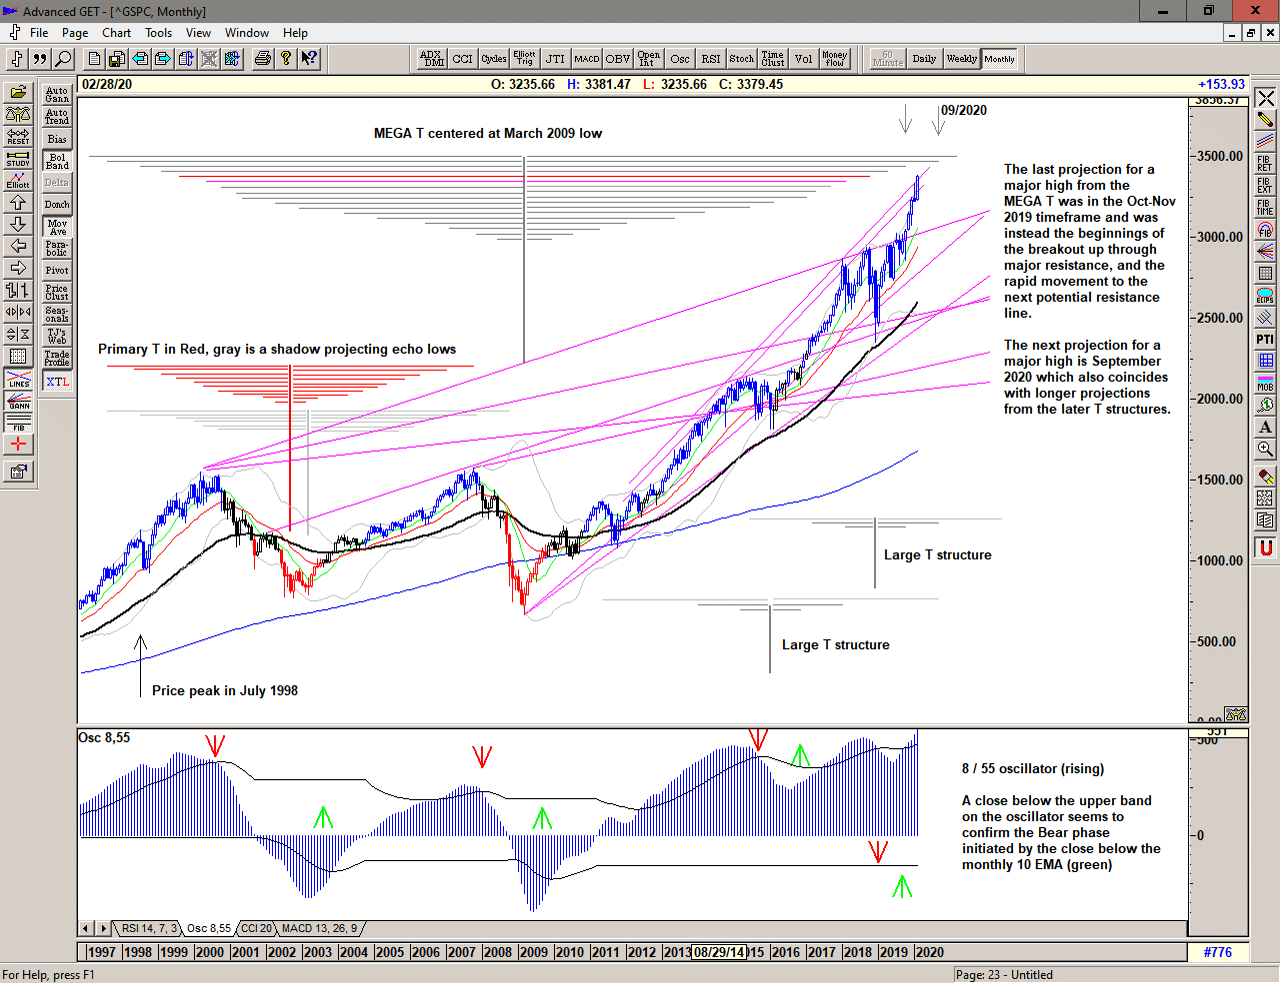
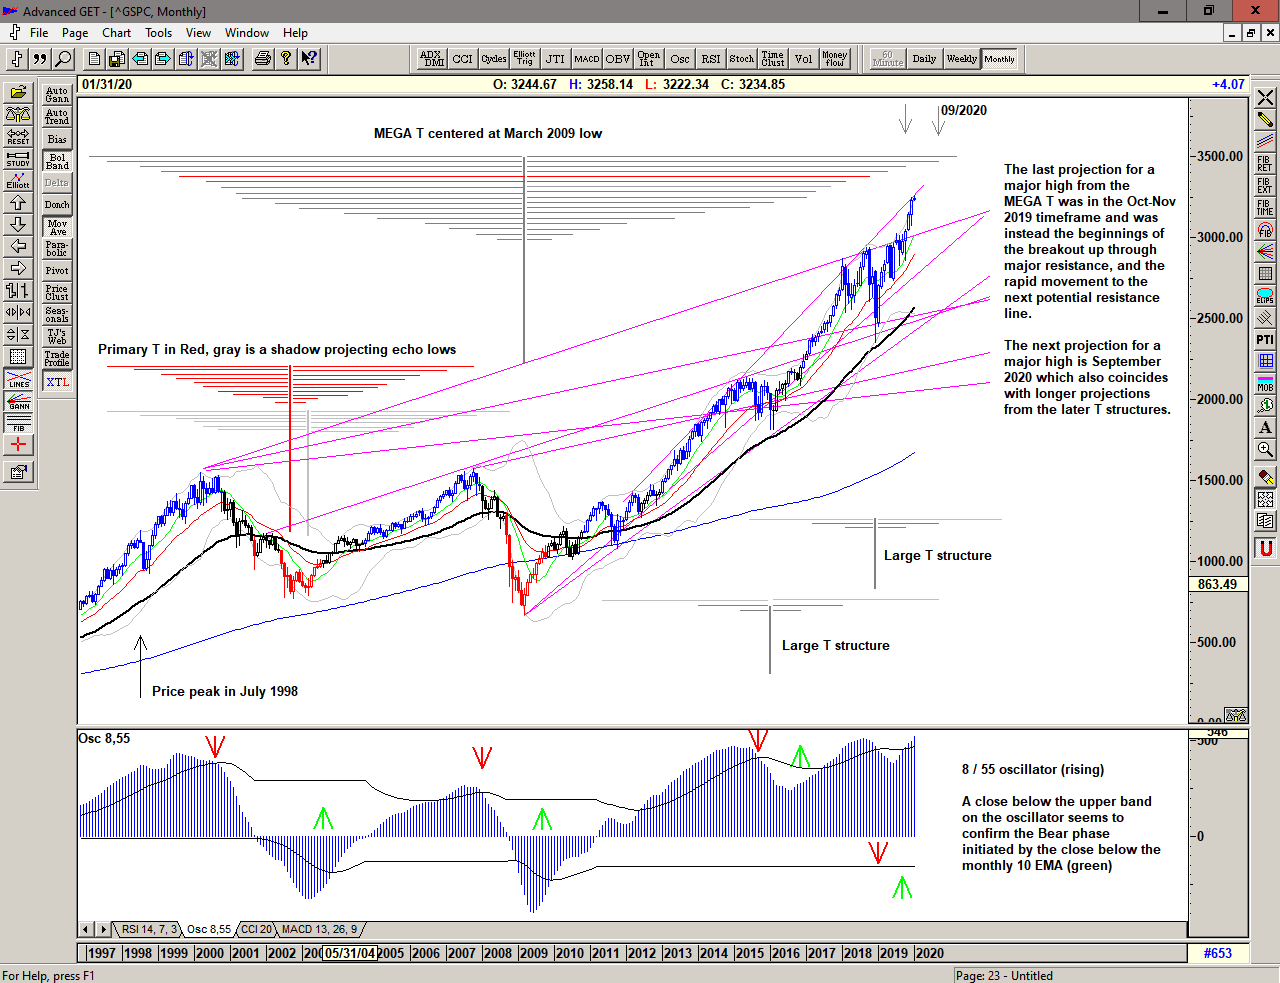
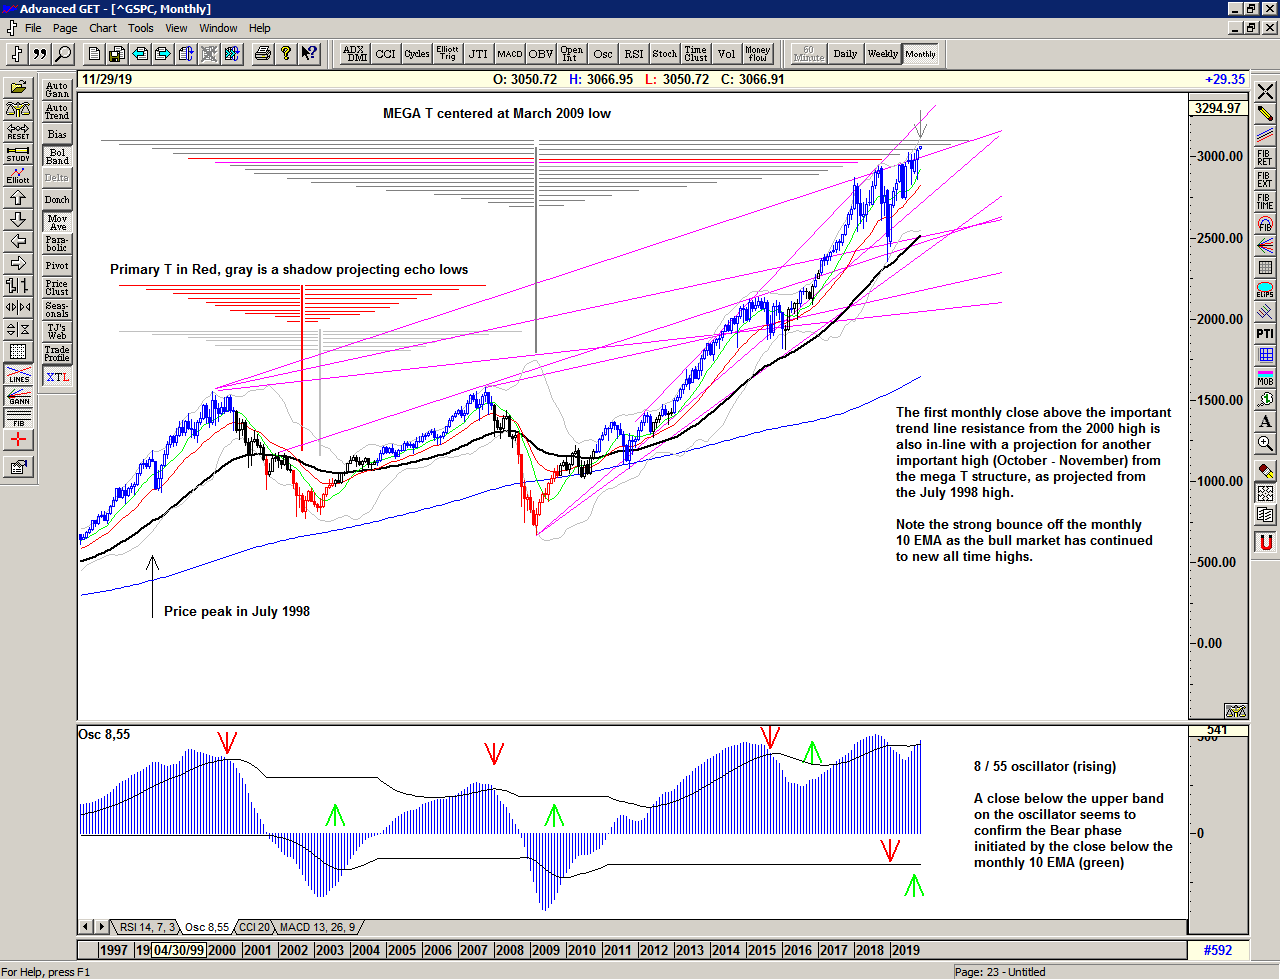
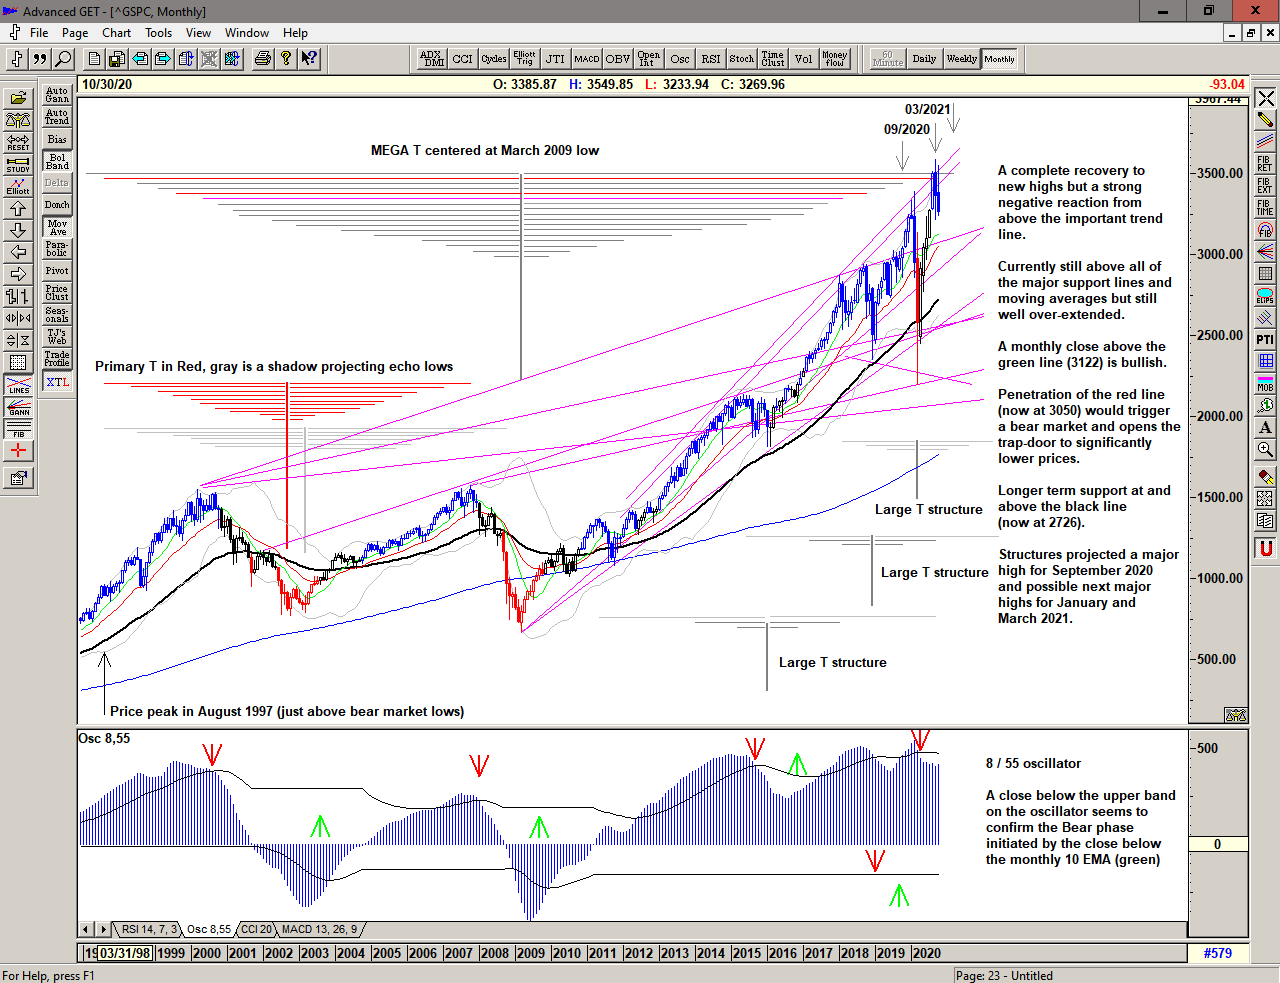
The monthly chart shows the rapid reversal from above the long term trendlines at the projection for an important high in September 2020. The re-test and subsequent failure at that high reinforces its importance.
Interestingly, the September high is at the projection for a possible final high in the Mega T structure centered at the 2009 low, that I have drawn in red from the price peak in August 1997 – also the starting point for the earlier T structure. August 1997 is the earliest most prominent peak that is above the bear market lows.
If this projection is correct, it is suggesting that the Bull market has completed its course, with the possibility of a less convincing high in March of 2021.
Save the image to your desktop to view a larger version
2020 has brought some fast and furious action in the market with a range that has become increasingly expansive since the move above 2500 in the Fall of 17. We can only assume that this will continue. This is a Brave New World.
–
Regardless of whether the market can continue higher or whether significant lows are ahead of us, the simplicity of the proprietary price based S/T Signalling System will continue to keep us on the correct side of the market, with price currently on a Sell Signal since moving below 3424 on 26 October 2020.
If you would like to learn more about using the S/T Signalling System please get in touch.
–
Be prepared for what is coming next and trade with confidence:
To receive detailed daily analysis, guidance and the updated daily Buy / Sell trigger levels being generated by the Trading the Line system before the market opens, and intraday alerts when appropriate, please become a Member and Sign up for Alerts & Observations – includes access to Members Area and the 'Explanatory Notes' for all of the concepts discussed as well as the new 'Notes on Daytrading' which provides insight into how to look for shorter term entries and exits within the context of the S/T Signalling System.
If you do not want to receive any more reports, please use the 'Unsubscribe' link below.