Vitus

A choppy session consolidating Friday's gains with a look at 3925 at the open and a re-test late morning.

Buy Signal continues.

Chart of S&P 500 for 28 June 2022

Sign up here for daily analysis with the updated Buy / Sell trigger levels being generated by the Trading the Line S/T System before the market opens. Trading the Line Membership – includes Explanatory Notes (pdf), Notes on Day Trading (pdf) and End of Day Snapshot of Day Trading Entries.

Disclaimer: This is the diary of a personal trading system, its methodology and the signals that it is producing. You are welcome to follow along but please understand that the information presented here is for educational purposes only. No recommendations are being made to buy, or sell stocks, options or futures contracts. Please consult your own financial advisor before making any investment decisions

Arialdo

A gap up and go, with a very strong thrust heading higher into the close at the end of recovery week.

Buy Signal continues

Chart of S&P500 for 26 June 2022

Sign up here for daily analysis with the updated Buy / Sell trigger levels being generated by the Trading the Line S/T System before the market opens. Trading the Line Membership – includes Explanatory Notes (pdf), Notes on Day Trading (pdf) and End of Day Snapshot of Day Trading Entries.

Disclaimer: This is the diary of a personal trading system, its methodology and the signals that it is producing. You are welcome to follow along but please understand that the information presented here is for educational purposes only. No recommendations are being made to buy, or sell stocks, options or futures contracts. Please consult your own financial advisor before making any investment decisions

Fortuna

A roller coaster day with a brief look at the Cover Signal line and then pushing higher into the close.

Buy Signal continues.

Chart of S&P500 for 24 June 2022

Sign up here for daily analysis with the updated Buy / Sell trigger levels being generated by the Trading the Line S/T System before the market opens. Trading the Line Membership – includes Explanatory Notes (pdf), Notes on Day Trading (pdf) and End of Day Snapshot of Day Trading Entries.

Disclaimer: This is the diary of a personal trading system, its methodology and the signals that it is producing. You are welcome to follow along but please understand that the information presented here is for educational purposes only. No recommendations are being made to buy, or sell stocks, options or futures contracts. Please consult your own financial advisor before making any investment decisions

Golowan

An overnight challenge to the Buy Signal but with strong buying from the opening gap lower and reaching 3800 before dropping back into the close.

Buy Signal continues for now.

Chart of S&P500 for 23 June 2022

Sign up here for daily analysis with the updated Buy / Sell trigger levels being generated by the Trading the Line S/T System before the market opens. Trading the Line Membership – includes Explanatory Notes (pdf), Notes on Day Trading (pdf) and End of Day Snapshot of Day Trading Entries.

Disclaimer: This is the diary of a personal trading system, its methodology and the signals that it is producing. You are welcome to follow along but please understand that the information presented here is for educational purposes only. No recommendations are being made to buy, or sell stocks, options or futures contracts. Please consult your own financial advisor before making any investment decisions

Windrush

Strong buying from the open, quickly above the Cover Short Signal line at 3738 and triggering a Buy Signal at 3756

An S/T Buy Signal at 3756.

Chart of S&P500 for 22 June 2022

Sign up here for daily analysis with the updated Buy / Sell trigger levels being generated by the Trading the Line S/T System before the market opens. Trading the Line Membership – includes Explanatory Notes (pdf), Notes on Day Trading (pdf) and End of Day Snapshot of Day Trading Entries.

Disclaimer: This is the diary of a personal trading system, its methodology and the signals that it is producing. You are welcome to follow along but please understand that the information presented here is for educational purposes only. No recommendations are being made to buy, or sell stocks, options or futures contracts. Please consult your own financial advisor before making any investment decisions


Spectrum

All numbers refer to SPX

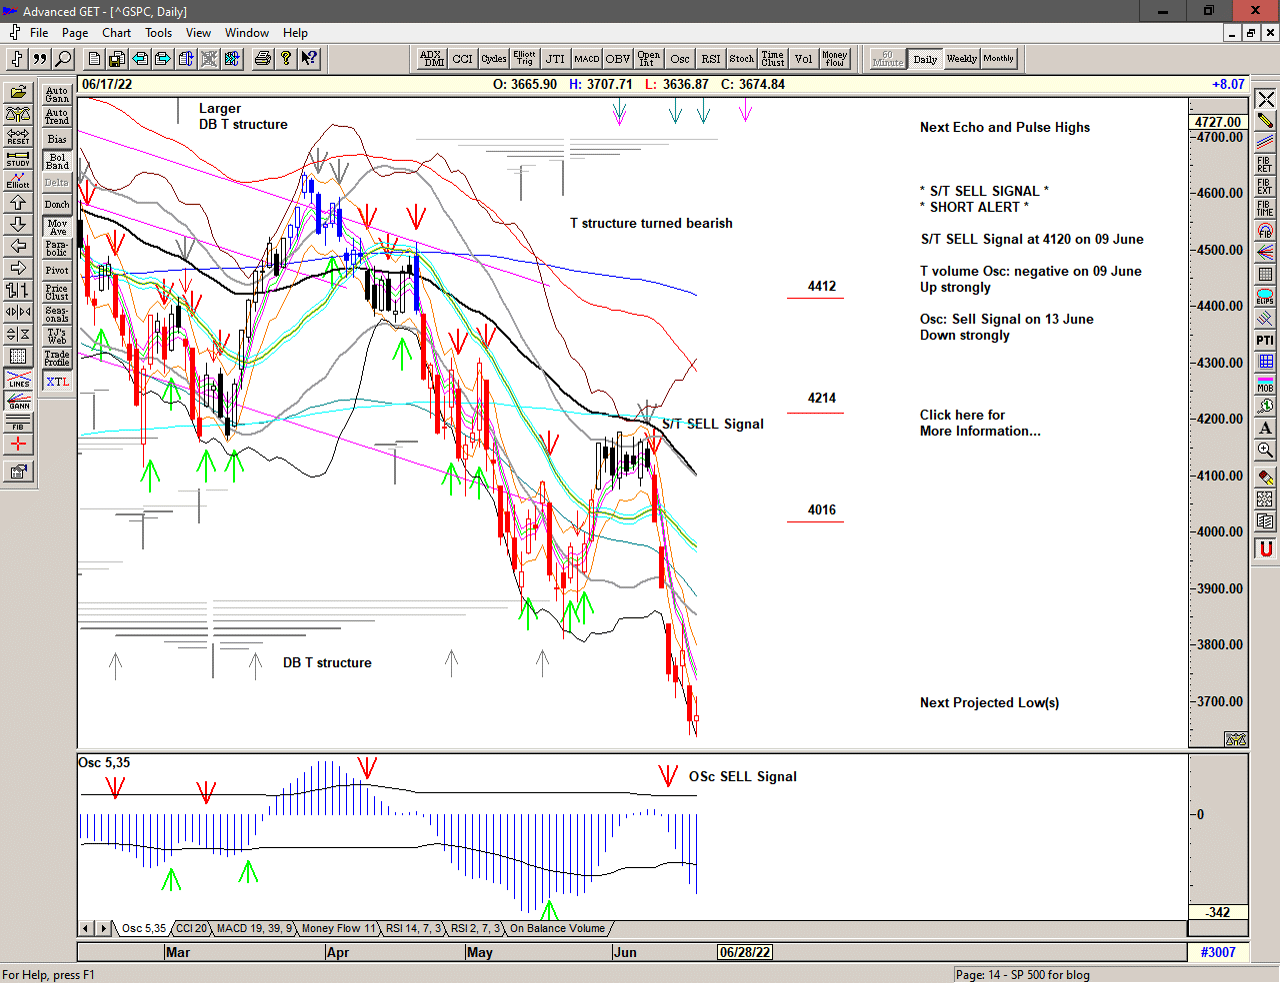
The Bear Market of 2022 continues with volatile and dangerous conditions and some extremely rapid moves in both directions with selling into recovery advances and stepping lower becoming the norm.

Daily chart of S&P 500 for 21 June 2022

Save the image to your desktop to view a larger version

The theme of price collapse continues with drops into deeper lows followed by strong recoveries to previous points of 'disappointment'.

June continues with another rapid and destructive decline from the late May recovery into the early June highs – coincidently the site of the March lows and the point of previous strong buying for the recovery into the late March high. Now looking like an important pivot point.

Chart of S&P 500 with T volume oscillator for 20 June 2022

Save the image to your desktop to view a larger version

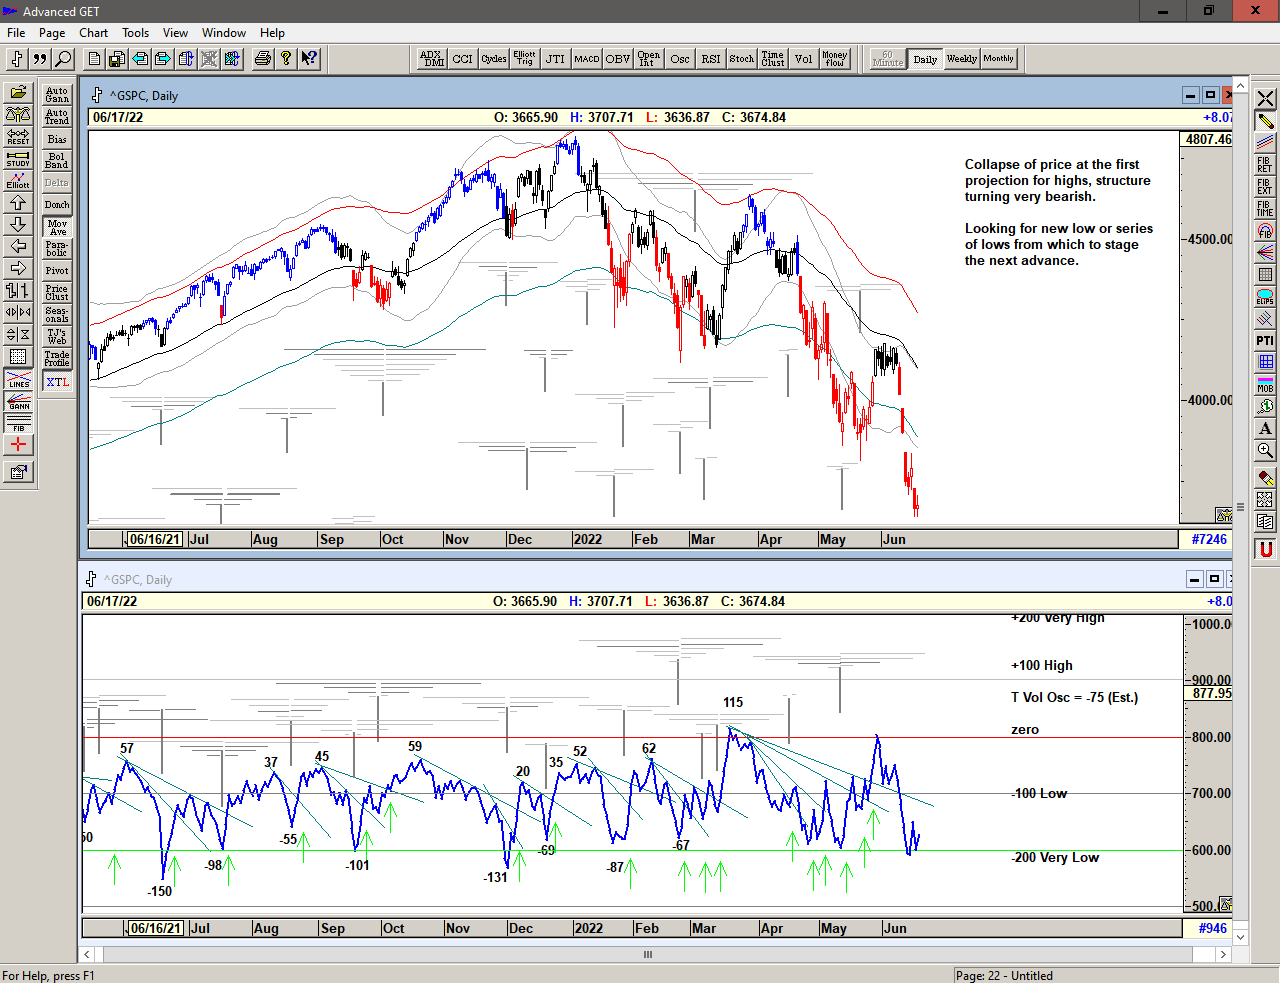
The T volume oscillator 1 made another series of Buy Signals in the late April – early May timeframe and this led to the strong thrust higher into the late May high. The rapid and ugly decline from the initial projections for a high indicate that the overall structure continues to be extremely bearish and that the market is ultimately looking for a deep low or series of deep lows – a platform – from which to stage the next advance.

We are looking for some real signs of stabilization, a 'v' or 'w' pattern in price and oscillator and given the bearish price action we should look for the market to take out a previous high with strength, preferably with the T volume oscillator moving upwards through the long declining cash build up line 2.

When that occurs we should see a significant lasting move back higher.

We are therefore prepared for a recovery but still mindful of the potential for lower prices from this level.

1 The T volume oscillator is an indication of Buying Power within the market as a whole
2 The cash build-up line is a declining line drawn above a series of lower highs made in the oscillator.

Weekly chart of S&P 500 for20 June 2022

Save the image to your desktop to view a larger version

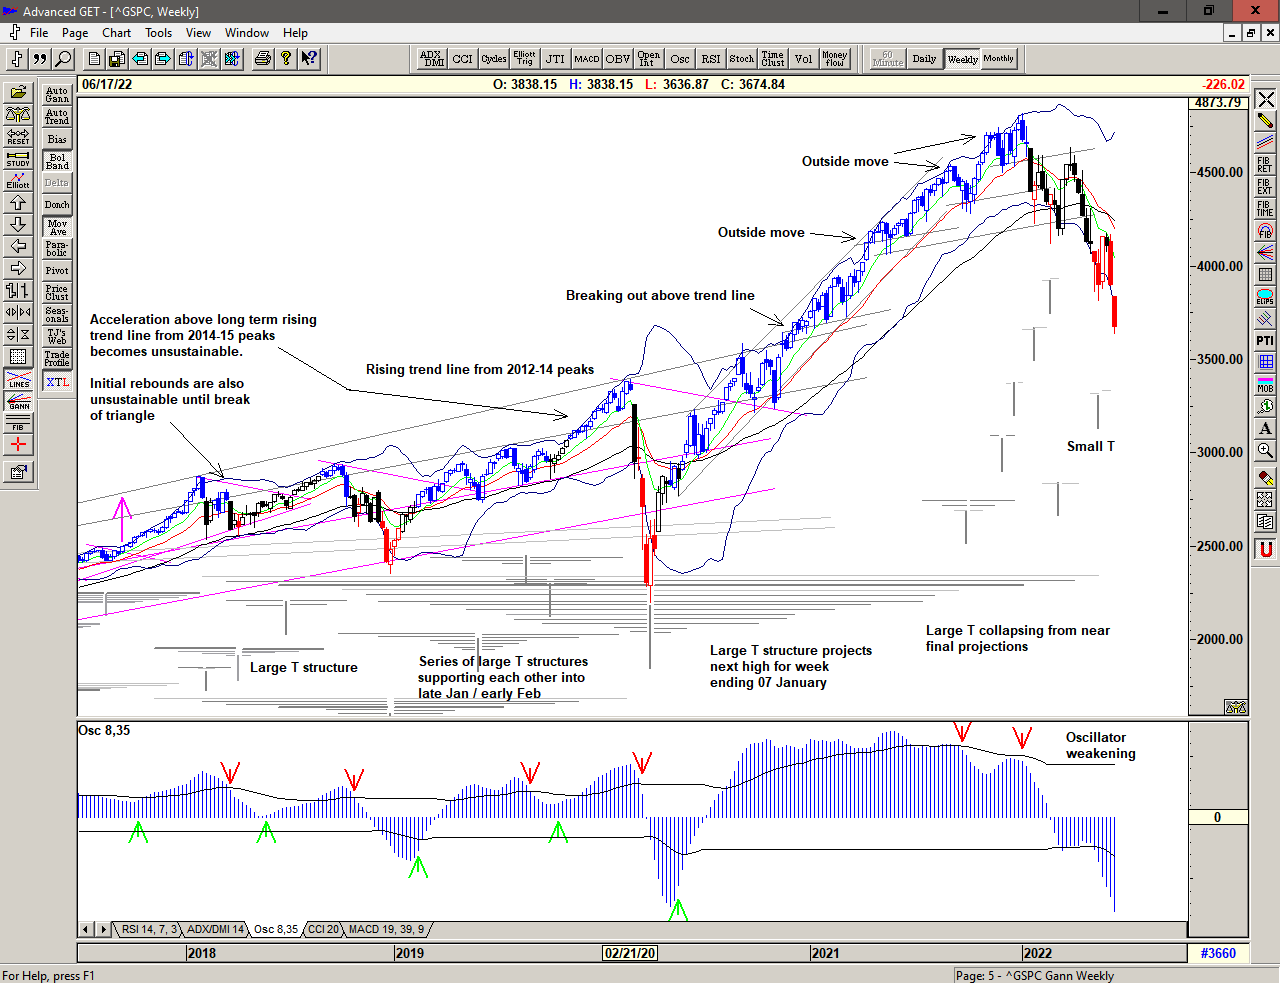
The weekly chart provides a bigger picture of the current Large structure centered at the March 2020 low and projected the important early January high from the price peak in mid June 2018.

The collapse of this structure is looking increasingly bearish as price looks for a significant support level which of course could still be a lot lower.

We are of course looking at the left-hand side of a large T structure, still in its early development with its center yet to be defined.

Monthly chart of S&P 500 for 20 June 2022

Save the image to your desktop to view a larger version

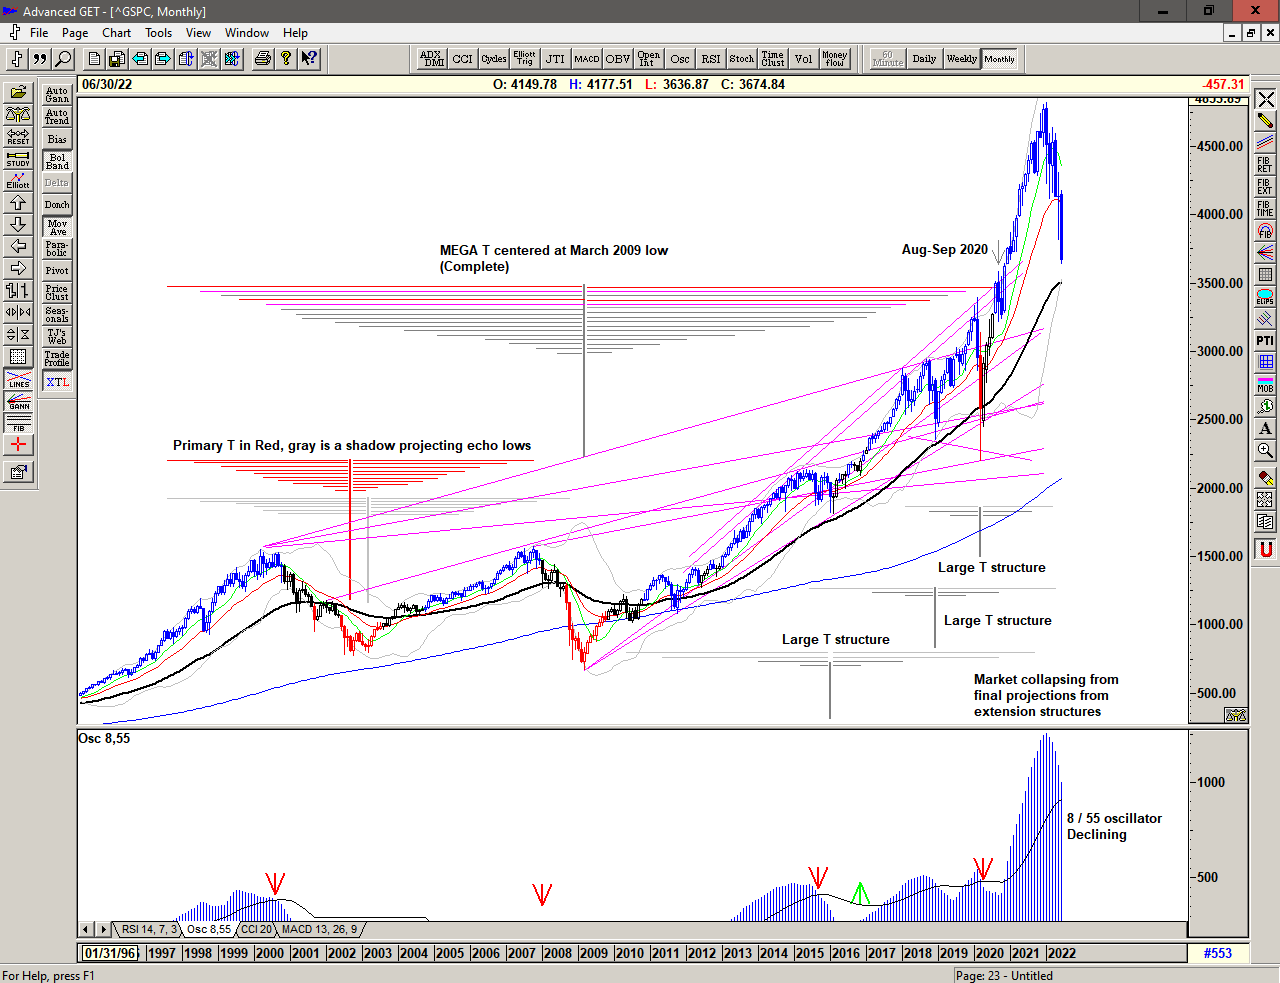
The monthly chart shows the series of Large structures that were collectively projecting highs for March and April 2022 and were extending the much larger Mega T structure. The collapse from the New Year high was rather ominous and was suggesting that the projections came in a little early, in which case the market is looking for a much more important low or series of lows for the next larger structure.

That could of course still be much lower.

2022 continues with price dropping sharply from the top of a range that has become increasingly expansive since the move above 2500. With price moving below the extremely volatile range from 4100-4600 we can only assume that this expansive price action will continue – in both directions – and that the important 2020 highs around 3385 and 3500 may now become the target. This is a Brave New World and we should trade accordingly.

Regardless of whether the market can move higher or whether significant lows are ahead of us, the simplicity of the proprietary price based S/T Signalling System will continue to keep us on the correct side of the market, currently indicating a Sell Signal since 09 June at 4120.

Although the market is keeping me extremely busy, I intend to launch a Mentoring Service in 2022 that will complement and expand upon the Trading the Line Subscription Service. Topics will include: T Theory, Position Trading, Day Trading, Price action, and Trading Psychology, and the intention is to provide traders with the full educational support that they may need to become successful.

If you would like to learn more about the S/T Signalling System , using T Theory or would be interested in the Mentoring Service , please get in touch.

Be prepared for what is coming next and trade with confidence:

Spectrum

A day of stabilization attempting to hold the new low at 3640.

Sell Signal continues.

Dangerous market conditions.

Chart of S&P500 for 21 June 2022

Sign up here for daily analysis with the updated Buy / Sell trigger levels being generated by the Trading the Line S/T System before the market opens. Trading the Line Membership – includes Explanatory Notes (pdf), Notes on Day Trading (pdf) and End of Day Snapshot of Day Trading Entries.

Disclaimer: This is the diary of a personal trading system, its methodology and the signals that it is producing. You are welcome to follow along but please understand that the information presented here is for educational purposes only. No recommendations are being made to buy, or sell stocks, options or futures contracts. Please consult your own financial advisor before making any investment decisions

Botolph

Another huge drop and more persistent selling – market in real trouble.

Sell Signal continues.

Dangerous market conditions.

Chart of S&P500 for 17 June 2022

Sign up here for daily analysis with the updated Buy / Sell trigger levels being generated by the Trading the Line S/T System before the market opens. Trading the Line Membership – includes Explanatory Notes (pdf), Notes on Day Trading (pdf) and End of Day Snapshot of Day Trading Entries.

Disclaimer: This is the diary of a personal trading system, its methodology and the signals that it is producing. You are welcome to follow along but please understand that the information presented here is for educational purposes only. No recommendations are being made to buy, or sell stocks, options or futures contracts. Please consult your own financial advisor before making any investment decisions


Ford

A day of stabilization and a volatile recovery to 3837 before dropping back.

Sell Signal continues for now.

Dangerous market conditions.

Arms Index suggesting that a panic low is close to hand.

Chart of S&P500 for 16 June 2022

Sign up here for daily analysis with the updated Buy / Sell trigger levels being generated by the Trading the Line S/T System before the market opens. Trading the Line Membership – includes Explanatory Notes (pdf), Notes on Day Trading (pdf) and End of Day Snapshot of Day Trading Entries.

Disclaimer: This is the diary of a personal trading system, its methodology and the signals that it is producing. You are welcome to follow along but please understand that the information presented here is for educational purposes only. No recommendations are being made to buy, or sell stocks, options or futures contracts. Please consult your own financial advisor before making any investment decisions


Trillo

An attempt to recover is met with more persistent selling.

Sell Signal continues.

Chart of S&P 500 for 15 June 2022

Sign up here for daily analysis with the updated Buy / Sell trigger levels being generated by the Trading the Line S/T System before the market opens. Trading the Line Membership – includes Explanatory Notes (pdf), Notes on Day Trading (pdf) and End of Day Snapshot of Day Trading Entries.

Disclaimer: This is the diary of a personal trading system, its methodology and the signals that it is producing. You are welcome to follow along but please understand that the information presented here is for educational purposes only. No recommendations are being made to buy, or sell stocks, options or futures contracts. Please consult your own financial advisor before making any investment decisions