All numbers refer to SPX
…
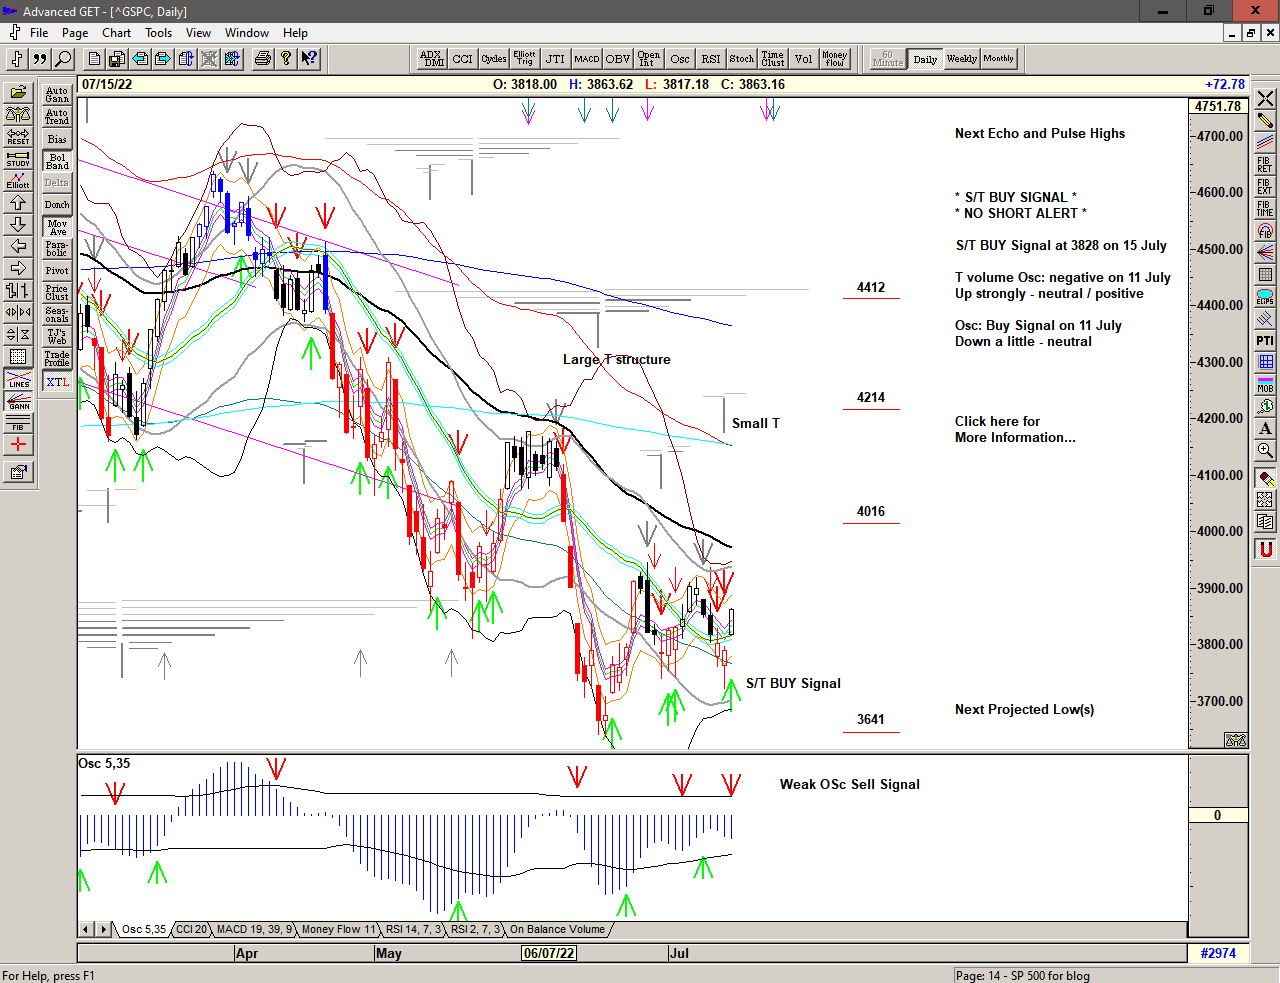
The sharp shake out drop after Independence is bought with a renewed S/T Buy Signal at 3809 pushing up into the previous highs just above 3900.
Save the image to your desktop to view a larger version
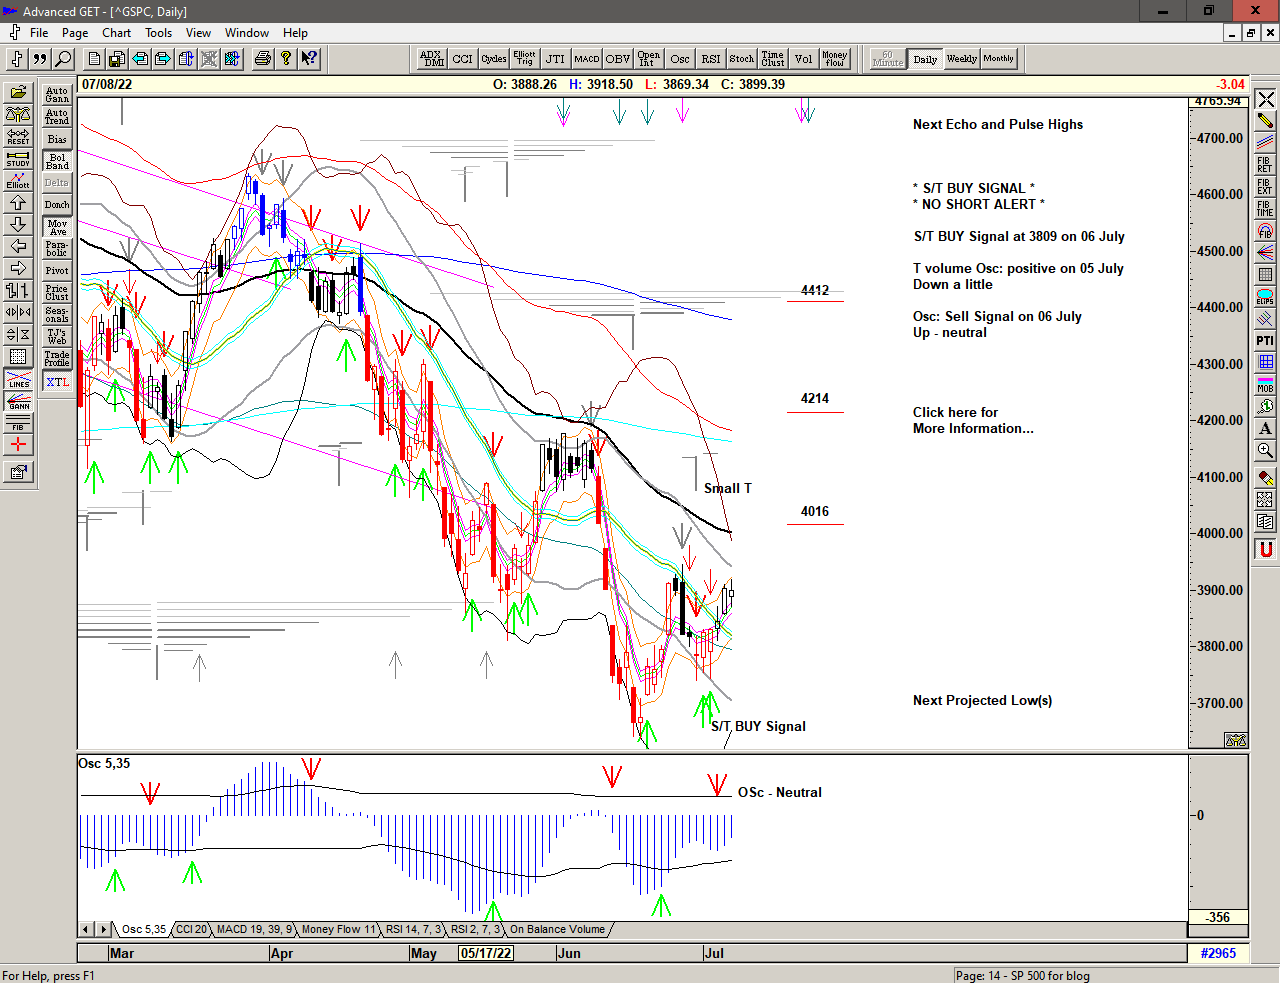
A second attempt to recover the June losses, perhaps the beginings of a more sustainable advance from a higher low.
For now there is a major 'pivot' in the 3900 area which may well need some more working off, but strength above this area should unleash considerable buying power and the possibility of another attempt on 4175.
Save the image to your desktop to view a larger version
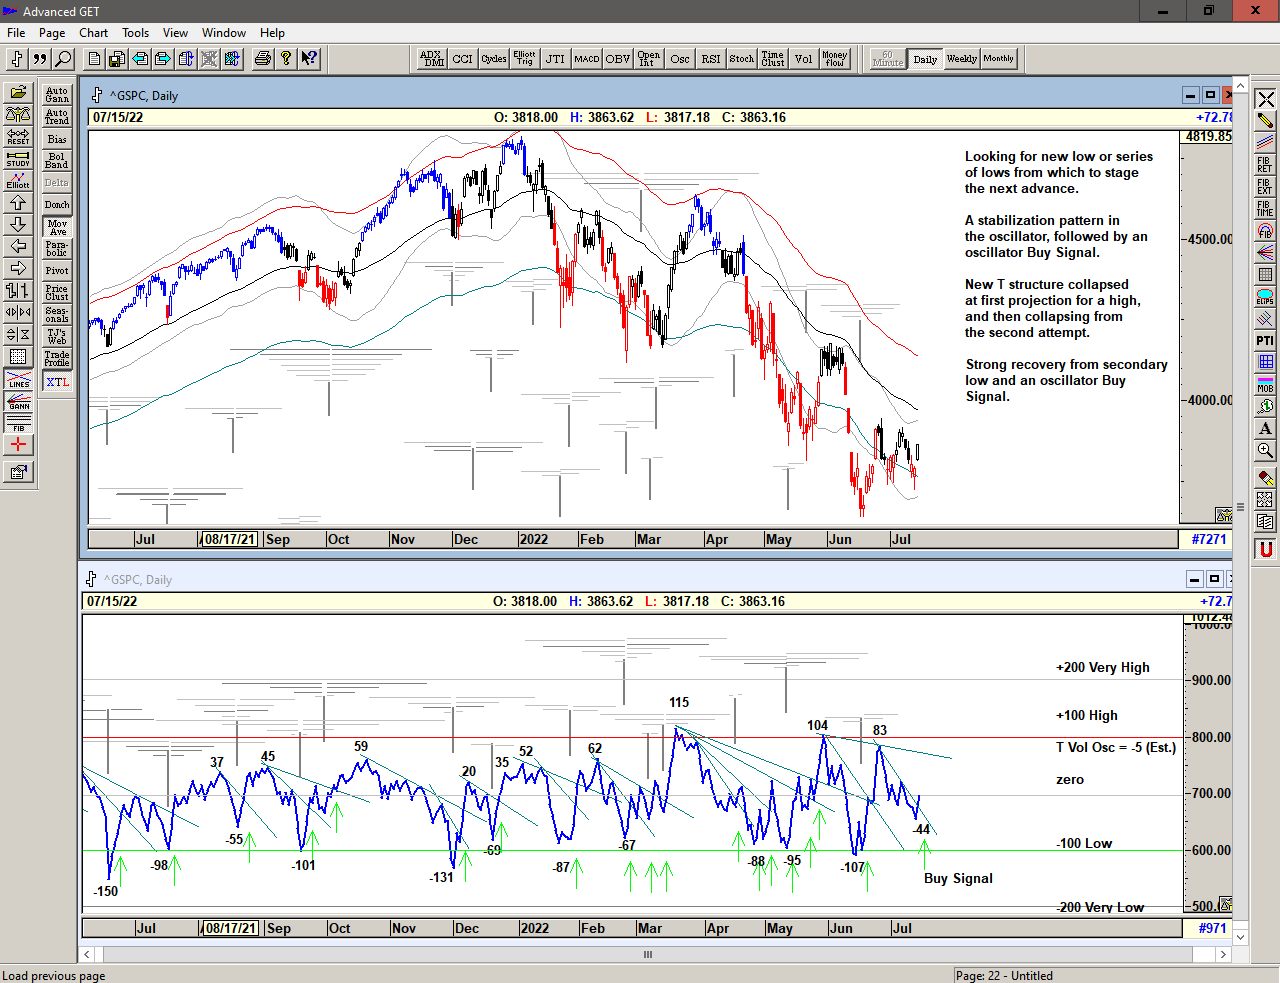
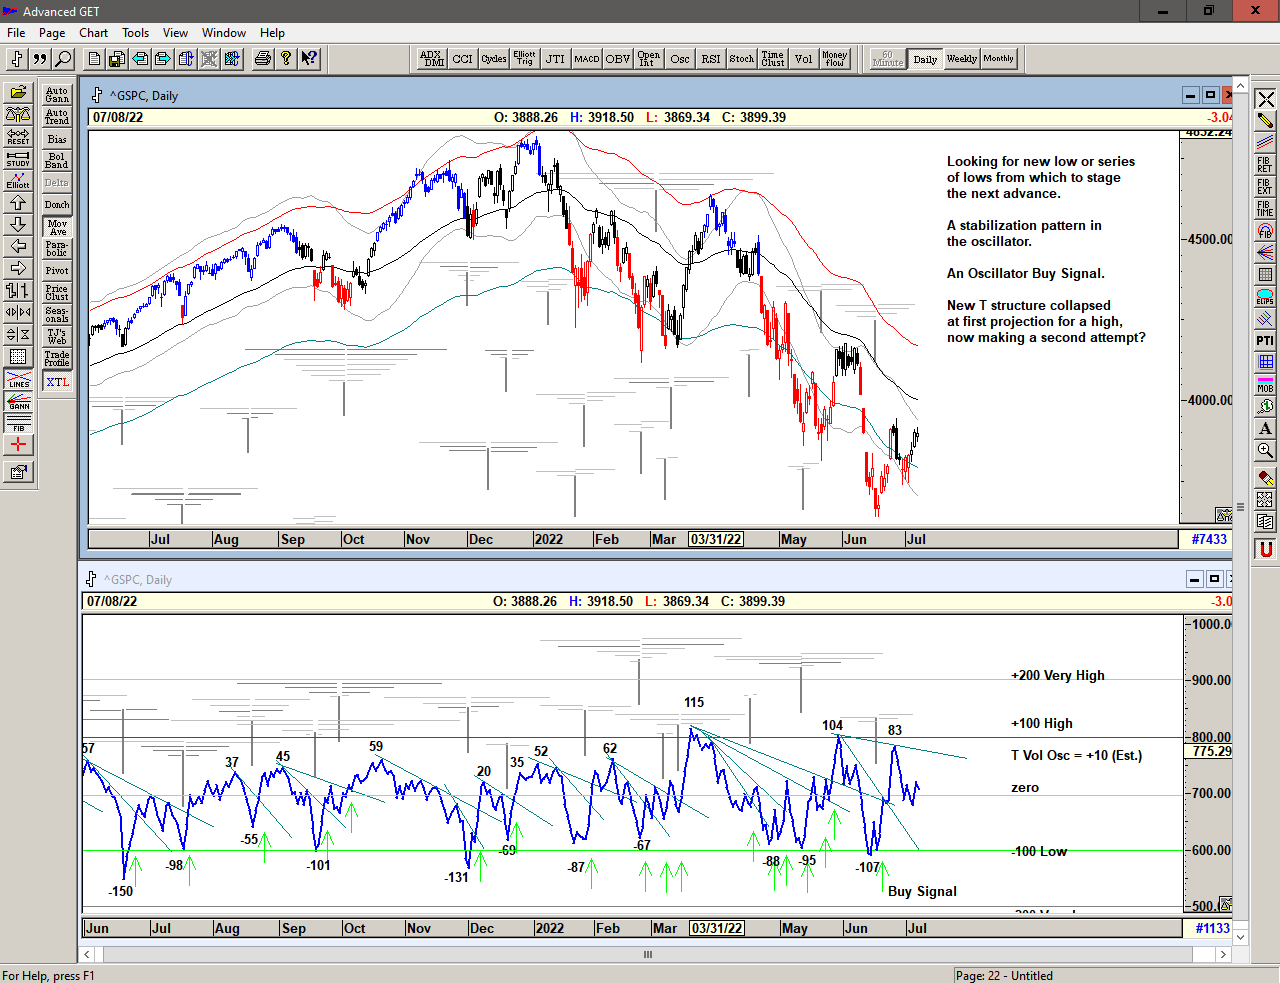
The T volume oscillator 1 made a strong Buy Signal in the days after the June low, with a 'w' pattern and a movement in the oscillator upwards through a steep cash build up line 2.
The stabilization and retracement of the late June decline suggests that that Buy Signal is still active.
Given the bearish price action of the last few months, we should look for the market to take out the previous high with strength.
When that occurs we should see a significant lasting move back higher.
We are therefore prepared for a recovery but still mindful of the potential for lower prices from this level.
1 The T volume oscillator is an indication of Buying Power within the market as a whole
2 The cash build-up line is a declining line drawn above a series of lower highs made in the oscillator.
Save the image to your desktop to view a larger version
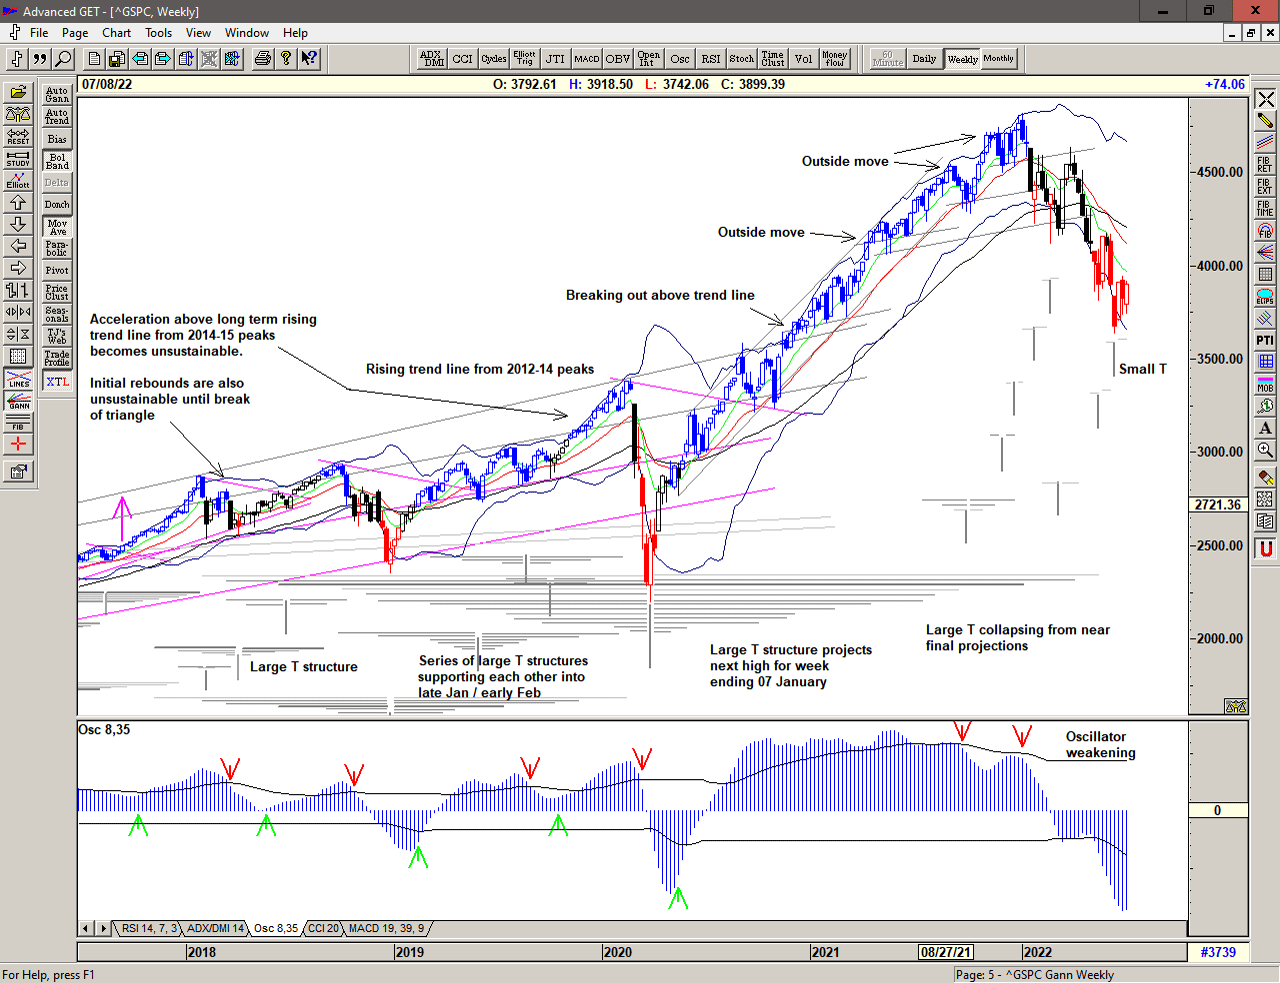
The weekly chart continues to provide a bigger picture of the Large structure centered at the March 2020 low and projected the important early January high from the price peak in mid June 2018.
The collapse of this structure with price stepping lower from subsequent attempts to recover has looked increasingly bearish, but the recent attempt to hold above the low at 3636 is looking more promising.
We are of course looking at the left-hand side of a large T structure, still in its early development with its center yet to be confirmed. Holding onto weekly and then monthly gains would be required to change that perspective and would activate considerable power to the upside.
Save the image to your desktop to view a larger version
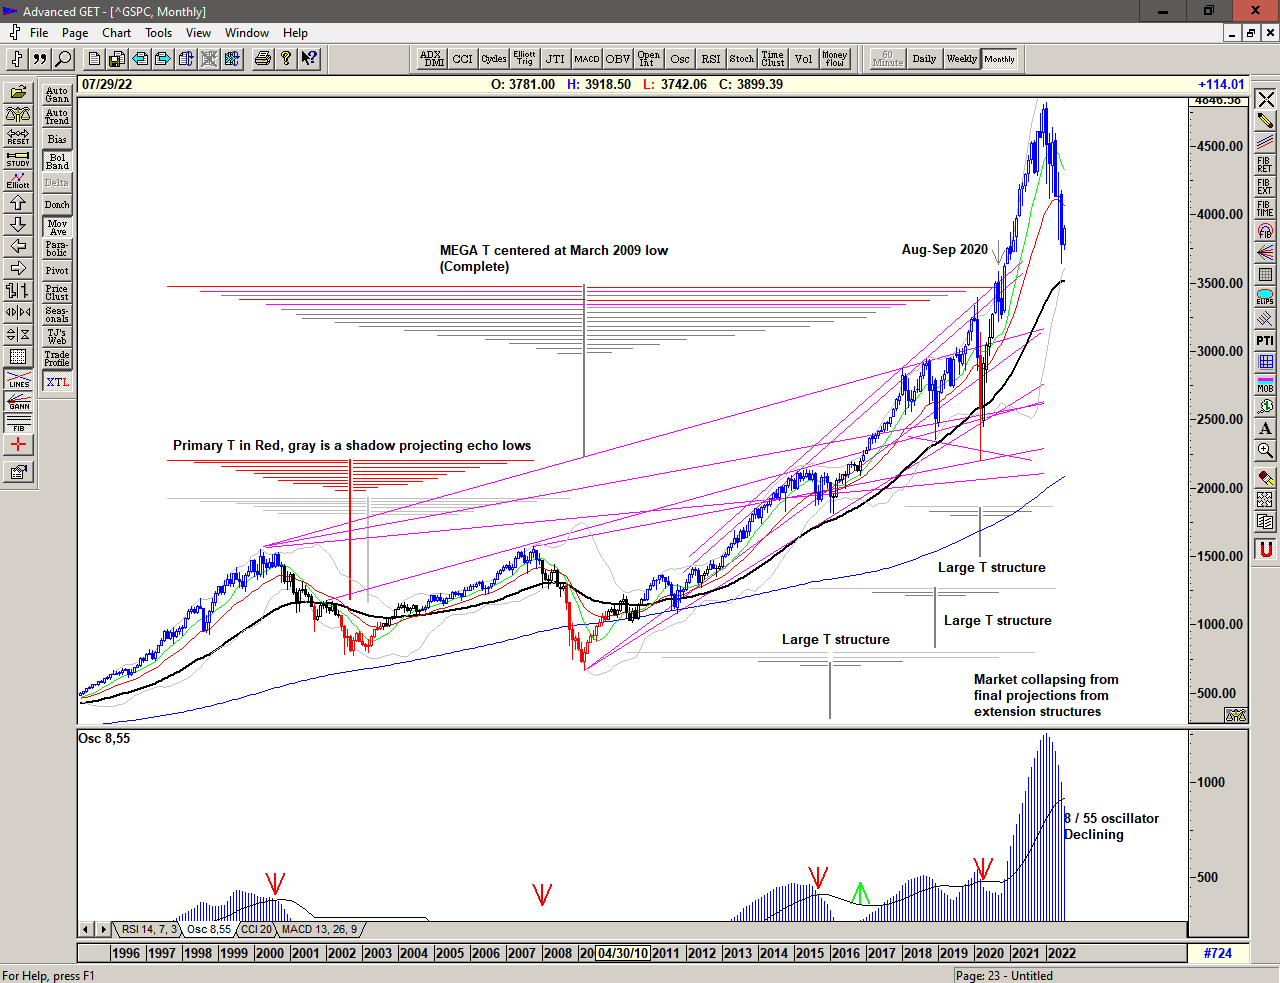
The monthly chart shows the series of Large structures that were collectively projecting highs for March and April 2022 and were extending the much larger Mega T structure. The collapse from the New Year high was rather ominous and was suggesting that the projections came in a little early, in which case the market has been looking for an important low or series of lows for the next larger structure.
Although last month's spike low is encouraging, we may need to see further tests or a deeper low in due course.
…
2022 continues with price dropping sharply from the top of a range that has become increasingly expansive since the move above 2500. With price moving below the extremely volatile range from 4100-4600 we can only assume that this expansive price action will continue – in both directions – and that the important 2020 highs around 3385 and 3500 may still become the target. This is a Brave New World and we should trade accordingly.
–
Regardless of whether the market can move higher or whether significant lows are ahead of us, the simplicity of the proprietary price based S/T Signalling System will continue to keep us on the correct side of the market, currently indicating a Buy Signal since 05 July at 3809.
–
Although the market is keeping me extremely busy, I intend to launch a Mentoring Service in 2022 that will complement and expand upon the Trading the Line Subscription Service. Topics will include: T Theory, Position Trading, Day Trading, Price action, and Trading Psychology, and the intention is to provide traders with the full educational support that they may need to become successful.
If you would like to learn more about the S/T Signalling System , using T Theory or would be interested in the Mentoring Service , please get in touch.
–
Be prepared for what is coming next and trade with confidence:
–
Sign up here for daily analysis with the updated Buy / Sell trigger levels being generated by the Trading the Line S/T System before the market opens. Trading the Line Membership – includes Explanatory Notes (pdf), Notes on Day Trading (pdf) and End of Day Snapshot of Day Trading Entries.
Disclaimer: This is the diary of a personal trading system, its methodology and the signals that it is producing. You are welcome to follow along but please understand that the information presented here is for educational purposes only. No recommendations are being made to buy, or sell stocks, options or futures contracts. Please consult your own financial advisor before making any investment decisions.