Posted inS&P500 daily update
Spike down
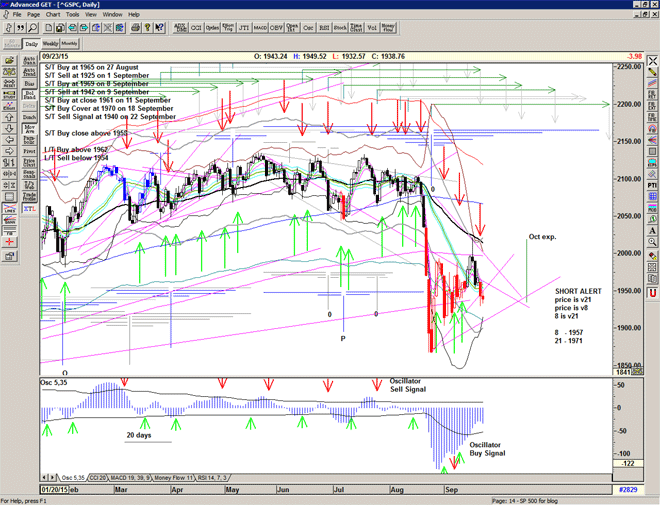
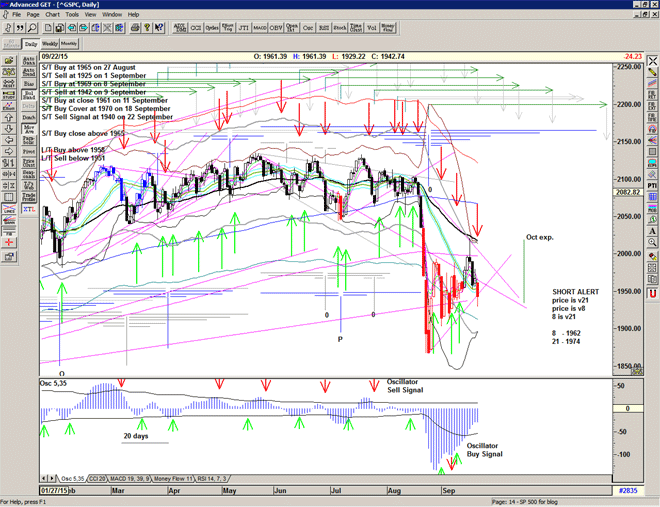
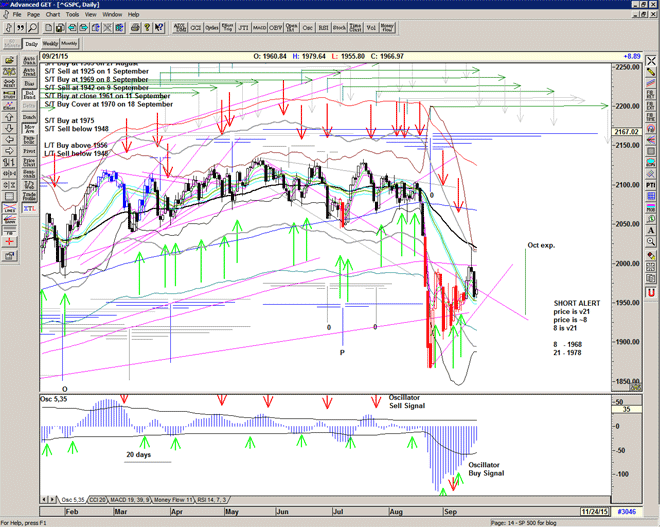
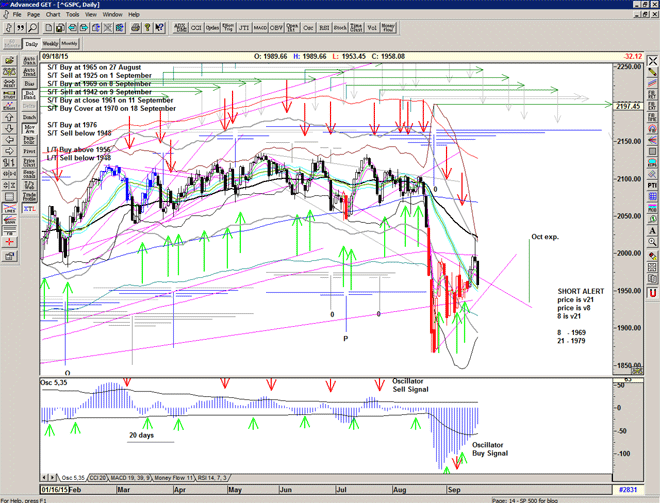
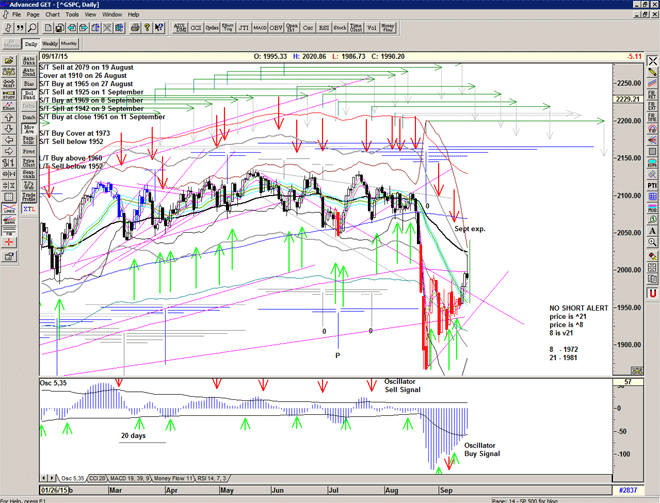
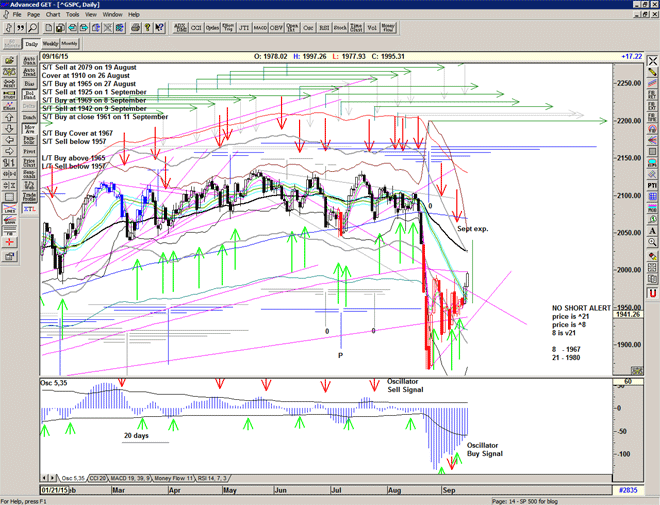
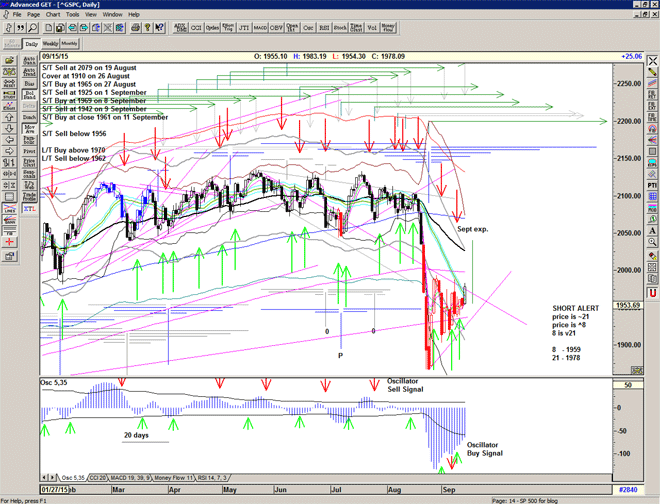
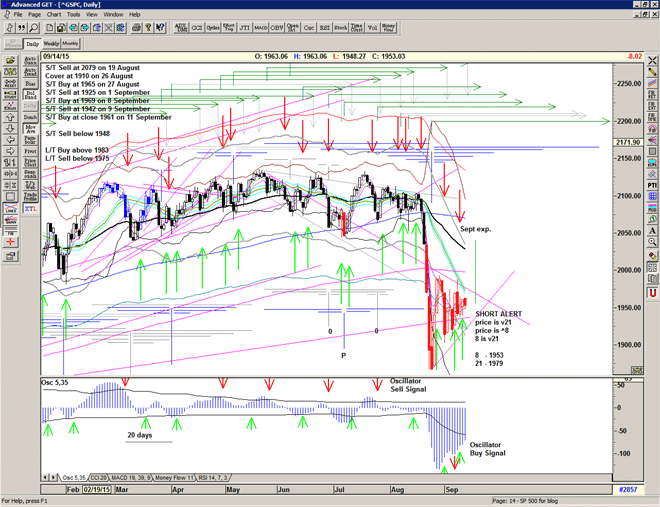
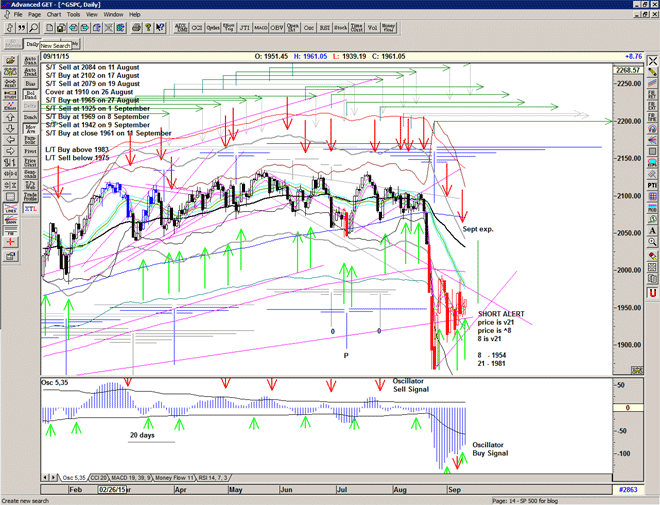
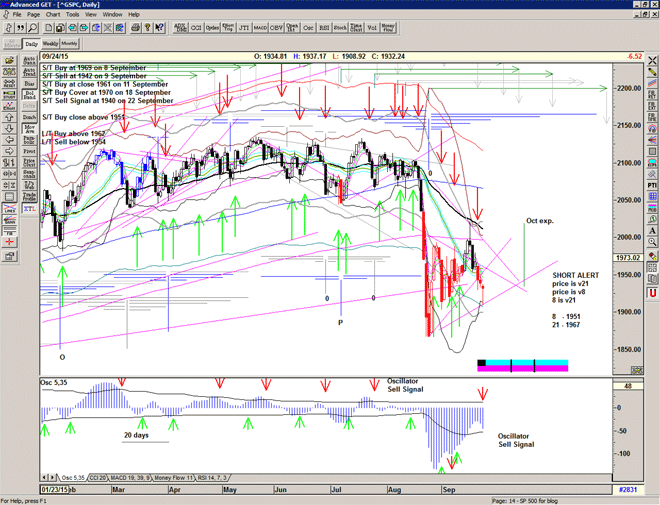
Found support on the next Gann line down at 1909.
Expect sideways and upwards into the next arm of the T structure – end of september.
T structure is turning bearish and suggestative of a break-down into the target MOB area of 1830 for an October low.
Posted by
 No Comments
No Comments