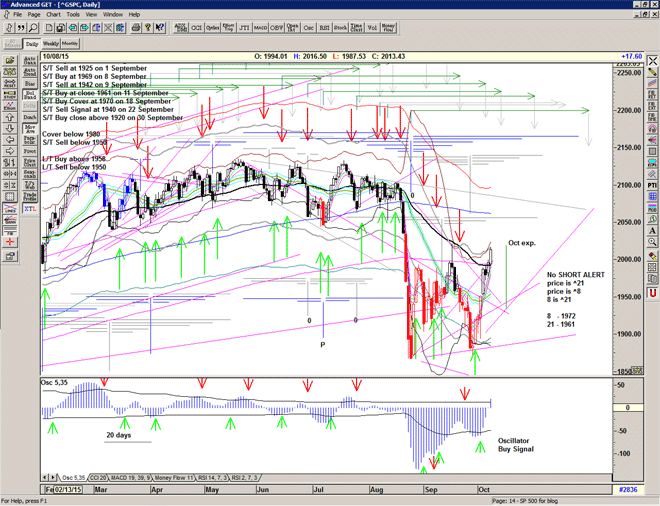
Above the 55

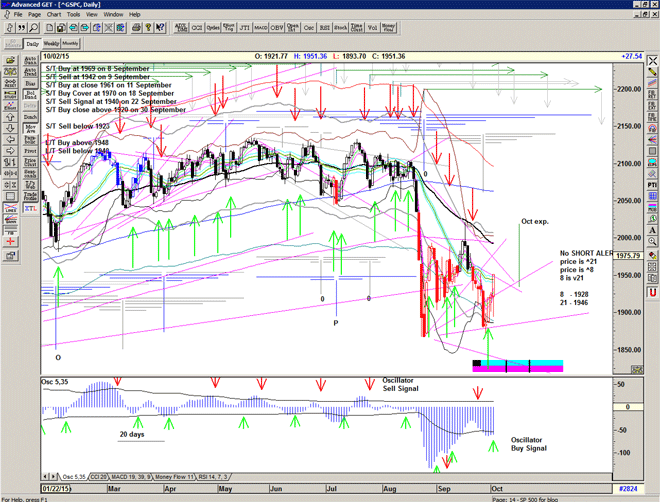
S&P pokes through the 55ema which is a very encouraging sign and suggestative of a recovery into the congestion area of 2050-2100.

T volume OSC hits another high at 126 confirming the strength of the recent move.

Chart of S&P500 for 8 October 2015

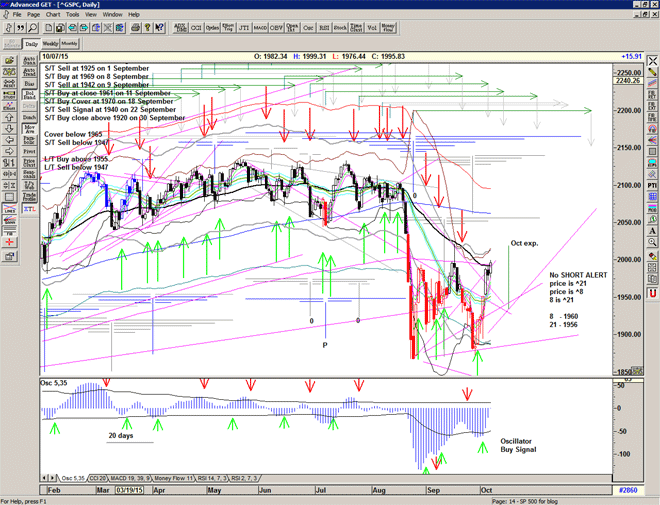
Safe to go back in ?

Maybe.
We do appear to have broken some of the downward angles suggesting that we could now start grinding back to the all time high.
The T volume OSC is hitting new highs since the October 2014 recovery suggesting that a long cash build up is now available for a long T structure projecting into summer 2016.
Weekly and monthly charts are still signalling a bear market.
Perhaps everyone is just too bearish right now.
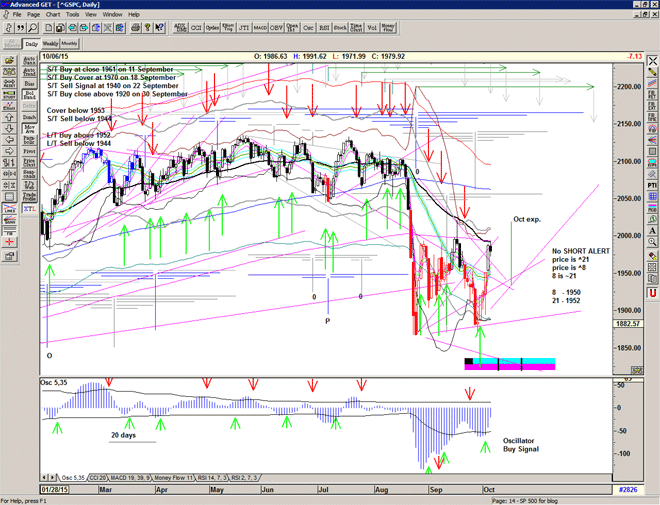
Now we are severely overbought (rsi 2 = 97) and just below the 55 ema, and close to the top of the gray channel, and near the end of the fist arm of the small T structure. A pull back here would make sense.

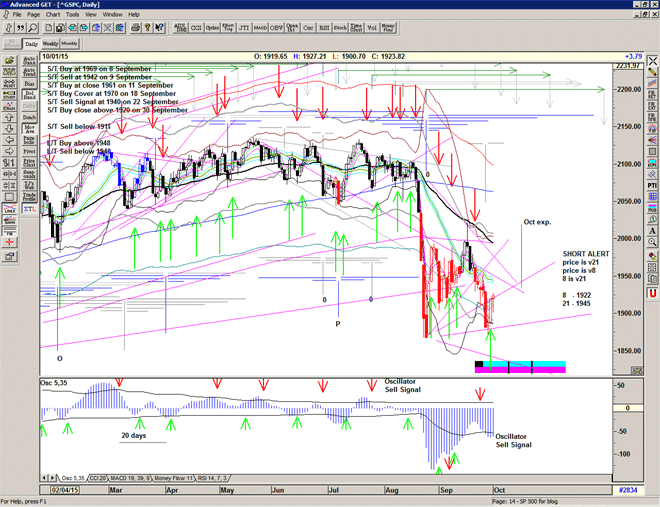
Chart of S&P500 for 6 October 2015

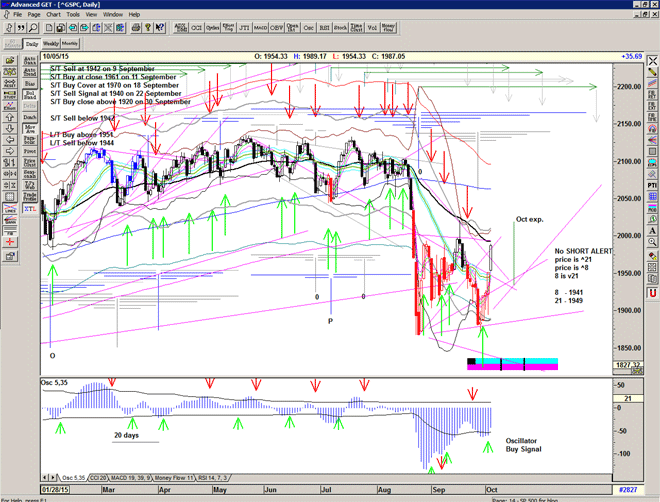
Recovery

Recovery within first 2 hours of move below 1911 cancelled the potential short signal and the result was strong move up. Small T structure definitely in operation and move above the mid channel is encouraging.

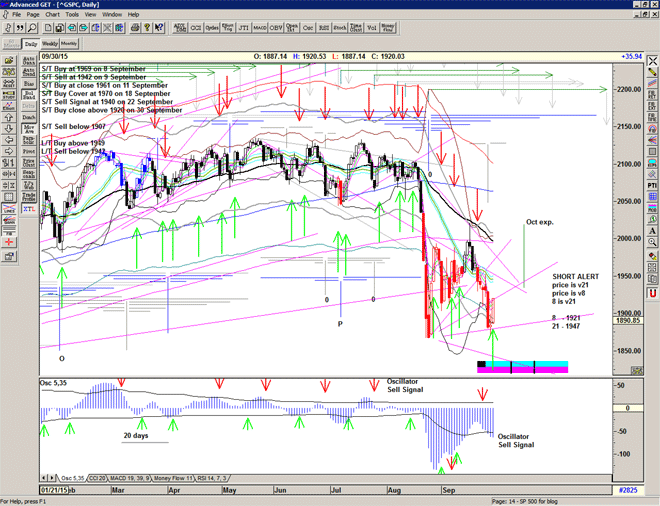
Chart of S&P500 for 5 October 2015

more pain

Another failure with the drop below 1951 in the afternoon.

It does look as though the market is starting to stabilise but maybe we need a new low to set up some bullish divergence.

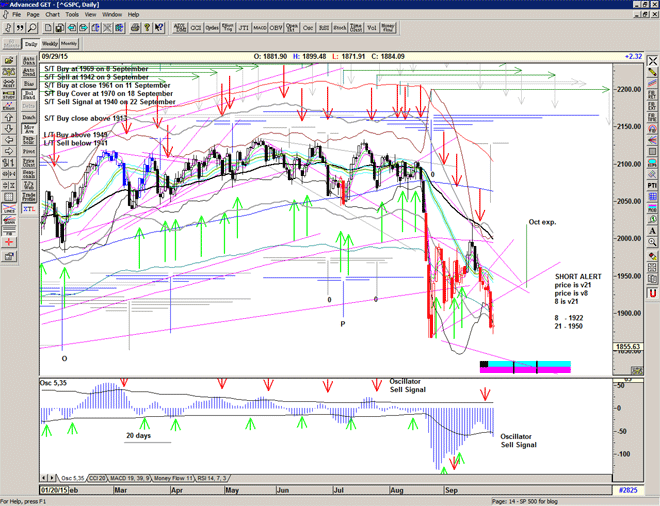
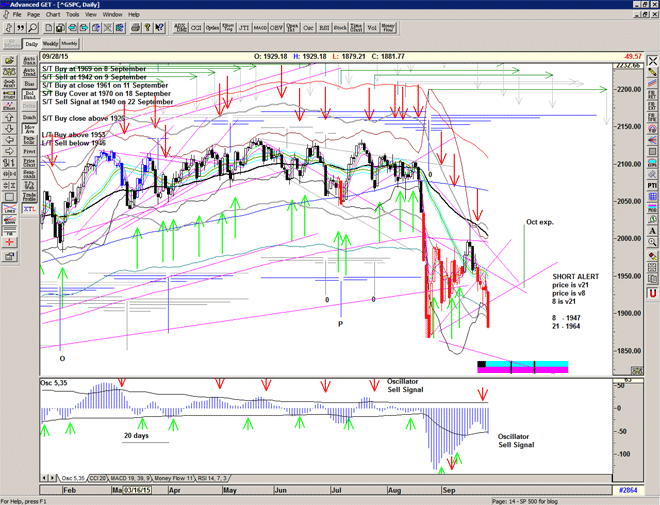
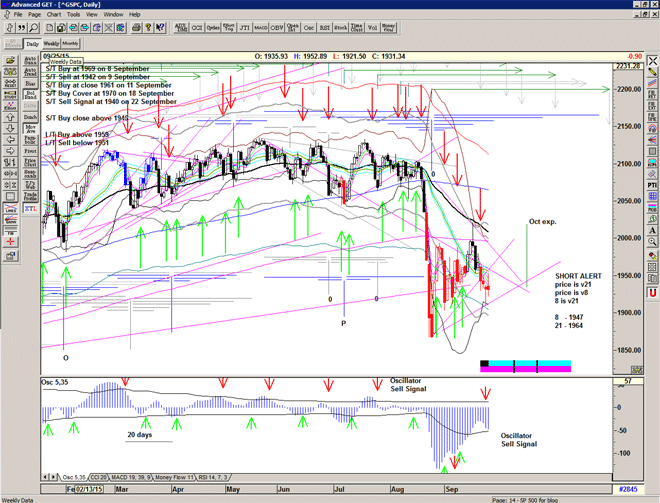
Chart of S&P500 for 27 September 2015