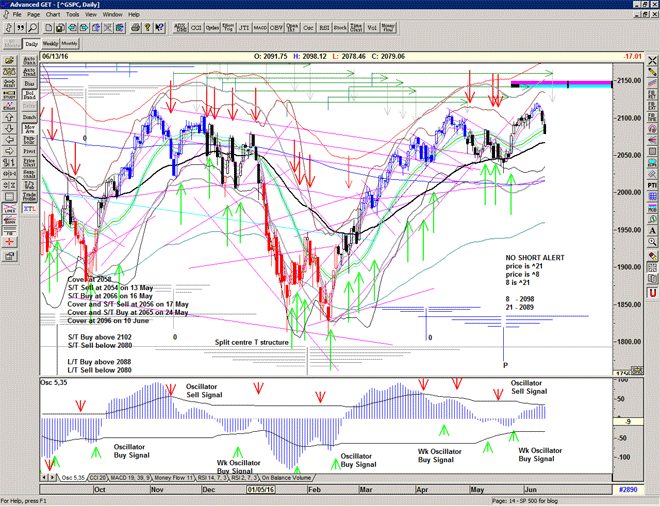
Brexit schmexit

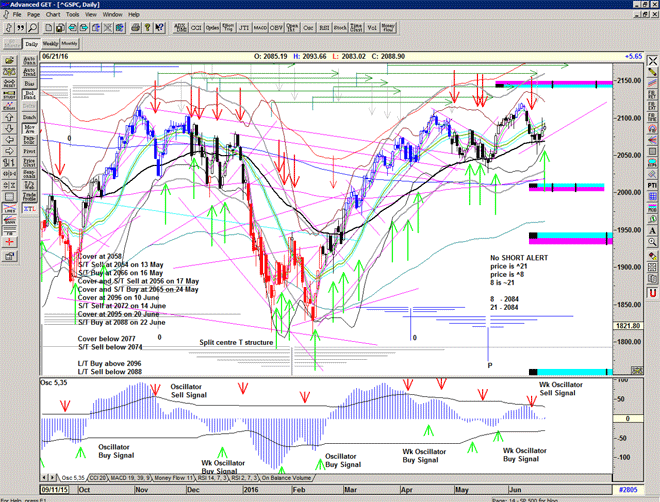
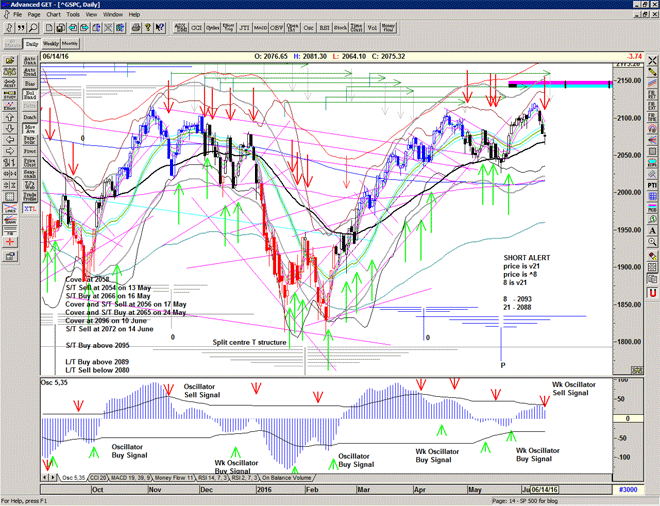
Another 'failure' to move beyond 2100 as we wait for the Brexit vote.
Notice that the bollingers are squeezing tight, indication that an outsized move is in preparation.
I suspect we may see a quick move in one direction followed by its reversal.
A fake out shake out.
Still on a BUY with a tight stop, keep a close eye on the rising Gann support line.
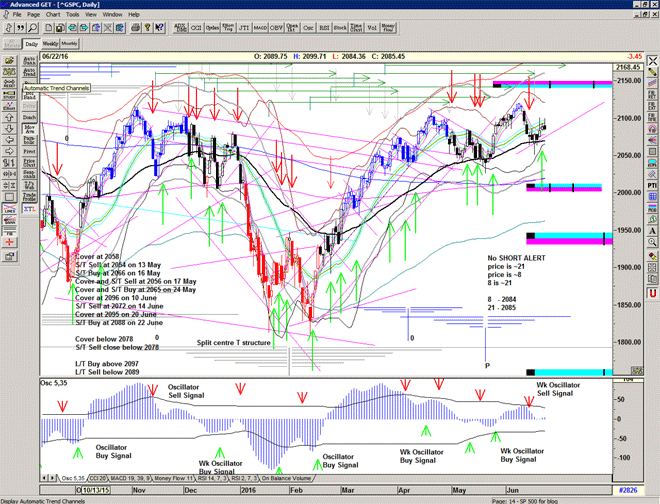
Chart of S&P500 for 23 June 2016

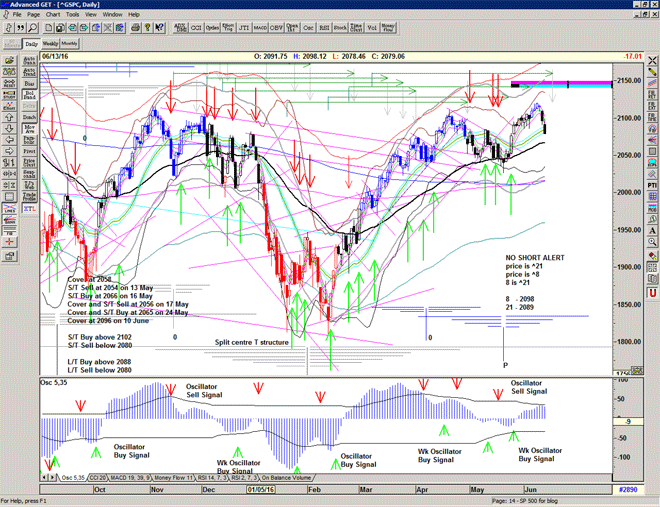
Midsummer madness

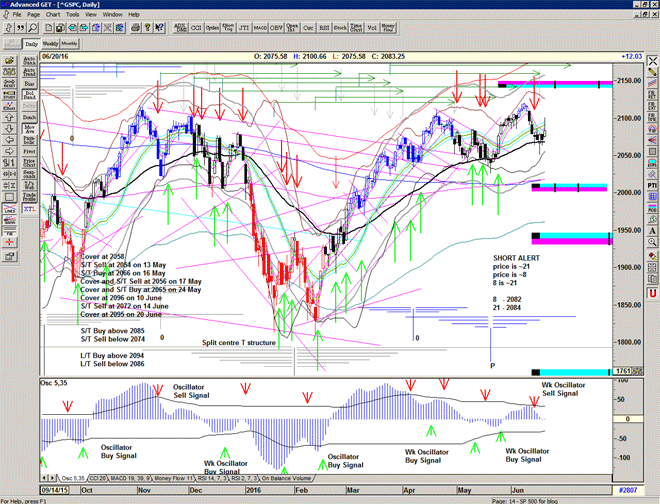
Covered short position at 2095, just can't argue with the market.
Not completely surprised that the market sold into that move (high Skew).

A coin toss whether to enter long or not at the close of 2083. I decided not to, due to perceived risk. (high skew).

Strength today would give more credence to yesterday's 'Buy Signal'.

Chart of S&P500 for 21 June 2016

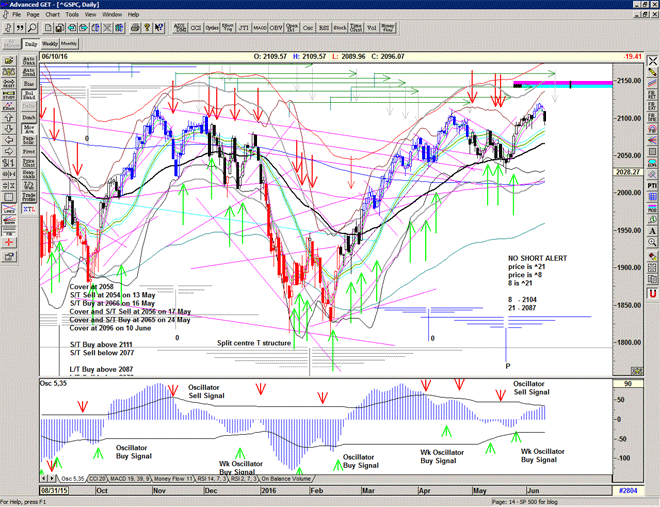
Long Spike recovery

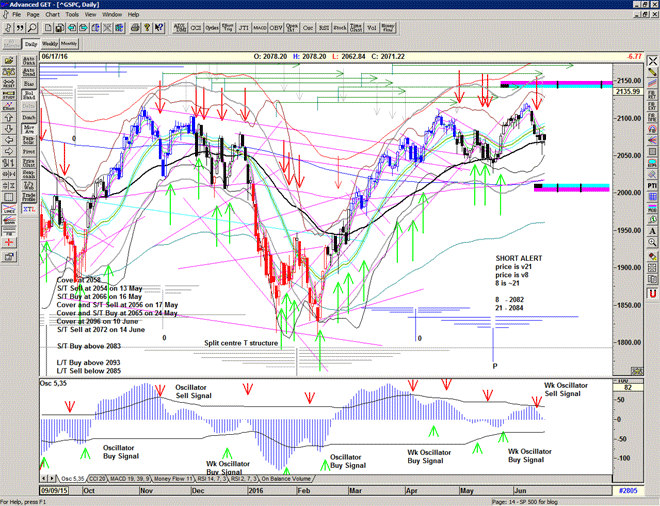
A long spike recovery at what may be the end of a small T structure.
Ideally we need to see some strength above 2090 to be convinced of a recovery though.

* We haven't seen SKEW at this level since New Year – increased perceived risk of a Black Swan event ie Brexit

Chart of S&P500 for 17 June 2016