Bastille

Joyeux Quatorze Juillet

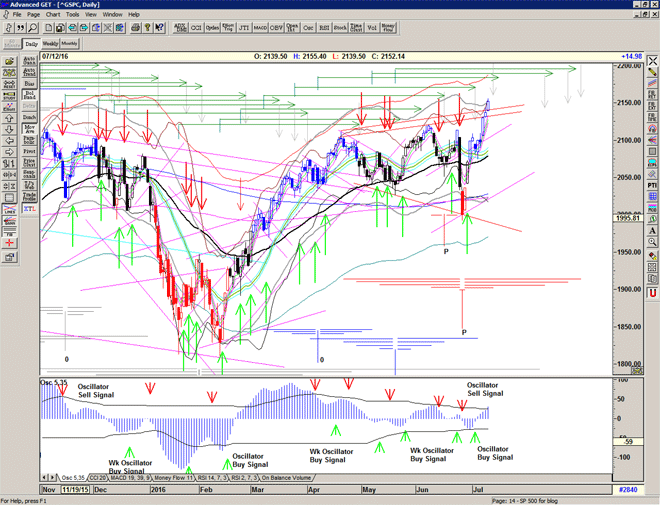
Time for a pause, waiting for expiration and ready for a pullback.

Today/tomorrow we are at the end of the first arm of the T structure suggesting that we are probably at the end of this initial strong push higher.
It would be logical to see a pullback to the breakout level and determine whether resistance can now become support.

Chart of S&P500 for 14 July 2016

For more detailed analysis, please Sign up for Alerts & Observations

Disclaimer: This is the diary of a personal trading system, its methodology and the signals that it is producing. You are welcome to follow along but please understand that the information presented here is for educational & entertainment purposes only. No recommendations are being made to buy, or sell stocks, options or futures contracts. Please consult your own financial advisor before making any investment decisions. 


This train stops for no-one

Yet we are all aboard…

(Words from THIS TRAIN by David Lynch, John Neff and Chrysta Bell)

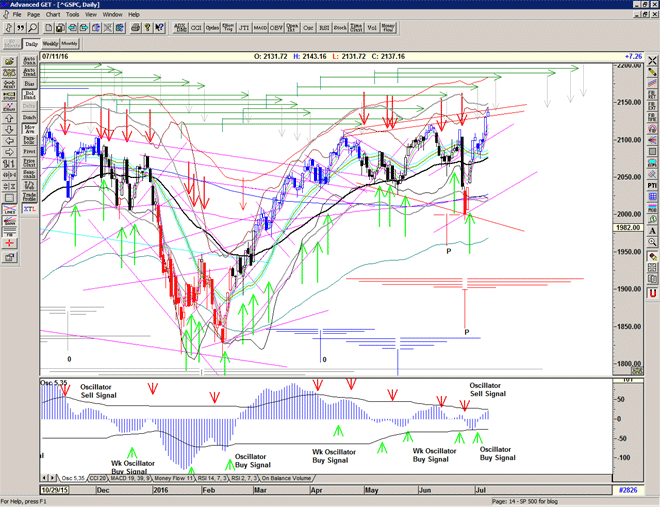
At the top of my gray channel and at the upper bollinger band

Like a runaway train and looks like a measured move similar to late February…

Chart of S&P500 for 13 July 2016

For more detailed analysis, please Sign up for Alerts & Observations

Disclaimer: This is the diary of a personal trading system, its methodology and the signals that it is producing. You are welcome to follow along but please understand that the information presented here is for entertainment purposes only. No recommendations are being made to buy, or sell stocks, options or futures contracts. Please consult your own financial advisor before making any investment decisions. 


Hooray for new highs

Short term target acheived, now it gets interesting.

Untitled-2

For more detailed analysis, please Sign up for Alerts & Observations

Disclaimer: This is the diary of a personal trading system, its methodology and the signals that it is producing. You are welcome to follow along but please understand that the information presented here is for entertainment purposes only. No recommendations are being made to buy, or sell stocks, options or futures contracts. Please consult your own financial advisor before making any investment decisions. 


Movin on up…

A strong push higher that activates the longer arms of this T structure pointing to late August highs.

Significant resistance indicated by the MOB lurking just above in the 2140-2150 area just above at all time highs, and so this is presumably the current target, with 2180 – 2200 the longer-term target above that.

Chart of S&P500 for 11 July 2016

For more detailed analysis, please Sign up for Alerts & Observations

Disclaimer: This is the diary of a personal trading system, its methodology and the signals that it is producing. You are welcome to follow along but please understand that the information presented here is for entertainment purposes only. No recommendations are being made to buy, or sell stocks, options or futures contracts. Please consult your own financial advisor before making any investment decisions. 


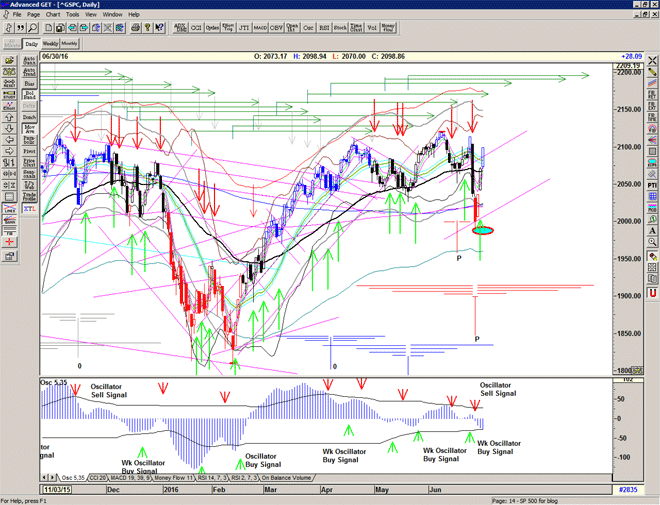
Smells like contagion

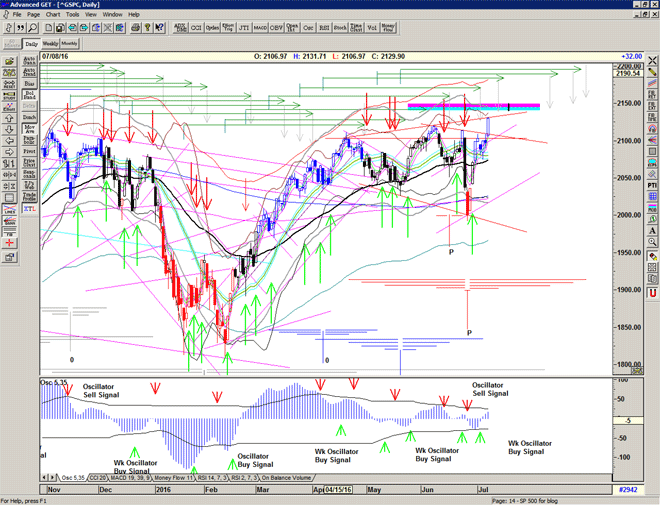
Smells like contagion with Italian banks in trouble, and treasury bonds going parabolic.
Maybe the market wont focus on it just yet but its out there.

Still climbing the wall of worry.

Chart of S&P500 for 8 July 2016


For more detailed analysis, please Sign up for Alerts & Observations

Disclaimer: This is the diary of a personal trading system, its methodology and the signals that it is producing. You are welcome to follow along but please understand that the information presented here is for entertainment purposes only. No recommendations are being made to buy, or sell stocks, options or futures contracts. Please consult your own financial advisor before making any investment decisions. 


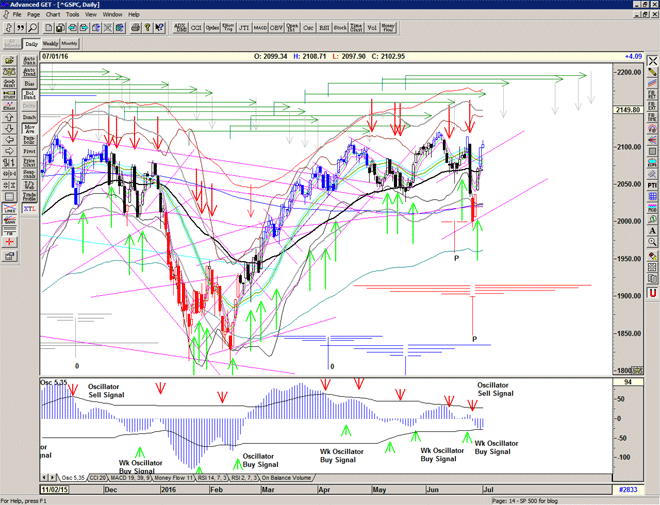
Push into green

Market played with the idea of going down, but found significant support in the 2070s.
Looks like green light for next push upwards.

Chart of S&P500 for 7 July 2016

For more detailed analysis, please Sign up for Alerts & Observations

Disclaimer: This is the diary of a personal trading system, its methodology and the signals that it is producing. You are welcome to follow along but please understand that the information presented here is for entertainment purposes only. No recommendations are being made to buy, or sell stocks, options or futures contracts. Please consult your own financial advisor before making any investment decisions. 


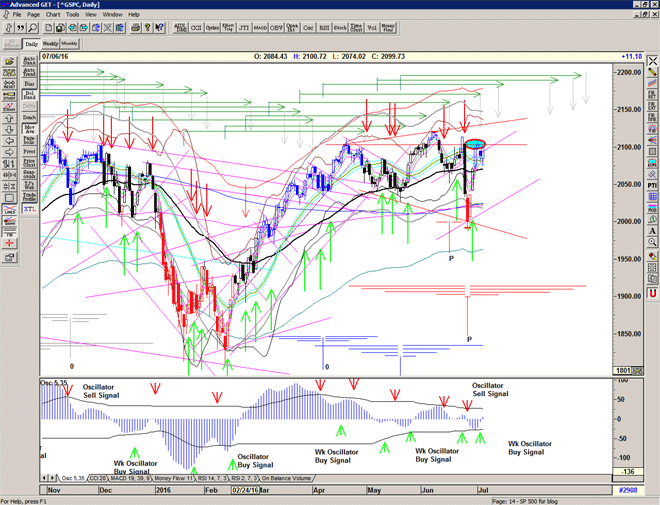
After party

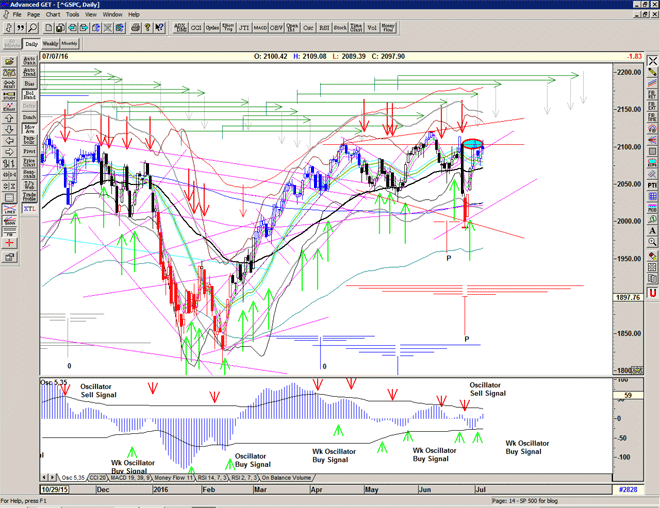
A little 'profit-taking' after the strength last week, and found support at the mid-point.
Held well above the stop line. Nothing out of the orderinary there.

On the negative side, the blue ellipse indicates that the bounce from the low has been contained, further weakness may suggest a re-test of the recent low and/or the rising angle from it.

Chart of S&P500 for 6 July 2016

For more detailed analysis, please Sign up for Alerts & Observations

Disclaimer: This is the diary of a personal trading system, its methodology and the signals that it is producing. You are welcome to follow along but please understand that the information presented here is for entertainment purposes only. No recommendations are being made to buy, or sell stocks, options or futures contracts. Please consult your own financial advisor before making any investment decisions. 


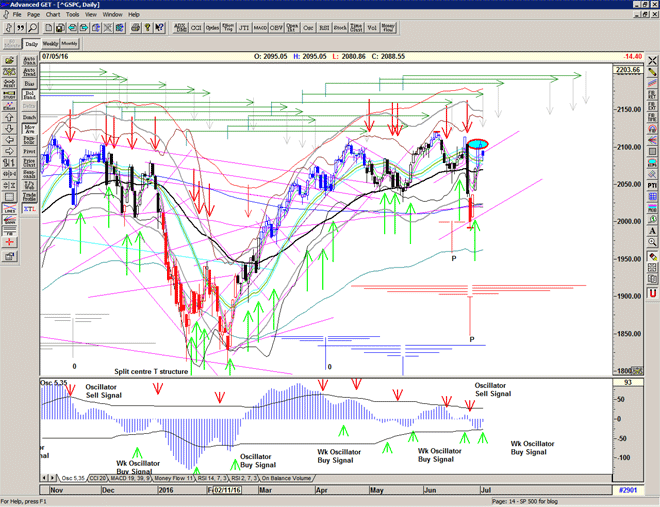
Independence

Everything looking good, tho we may need a small pullback here after the big push up from the recent low, and it also coincides with a minor high indicated.

Continued strength above the mid-channel and gann angle should project this higher into a mid July high.

A very happy Independence Day everyone.

Chart of S&P500 for 5 July 2016

For more detailed analysis and price trigger levels, please Sign up for Alerts & Observations