Nerva

A pull-back after an echo high and after very short term projection for a high (small T).

Just holding onto the current Buy Signal.

Chart of S&P 500 for 18 September 2018

Be prepared for whatever is coming next, and trade with confidence:

To receive detailed daily analysis, guidance and the updated daily Buy / Sell trigger levels being generated by the Trading the Line system before the market opens, and intraday alerts when appropriate, please become a Member and Sign up for Alerts & Observations – includes access to Members Area and the Explanatory Notes for all of the concepts discussed.

Disclaimer: This is the diary of a personal trading system, its methodology and the signals that it is producing. You are welcome to follow along but please understand that the information presented here is for educational purposes only. No recommendations are being made to buy, or sell stocks, options or futures contracts. Please consult your own financial advisor before making any investment decisions.


Drips away

I got that feeling, that bad feeling that you don't know
I don't even know her but I hope that she comforts you tonight
Nobody here that keeps you in the shade and ever owned you
Some sentimental tears or someone else's girl that drips away

Massive Attack, The Spoils, 2016

Songwriter: Grant Marshall, Hope Sandoval, Stew Jackson

The current Buy signal continues with some consoldation above 2895 and some hesitation at the rising line looking back to late June, but assume grinding higher until price breaks below rising support indicates otherwise.

The OSc oscillator improves and is now neutral, whilst the T volume oscillator also remains in neutral.

Chart of S&P500 for 17 September 2018

Be prepared for whatever is coming next, and trade with confidence:

To receive detailed daily analysis, guidance and the updated daily Buy / Sell trigger levels being generated by the Trading the Line system before the market opens, and intraday alerts when appropriate, please become a Member and Sign up for Alerts & Observations – includes access to Members Area and the Explanatory Notes for all of the concepts discussed.

Disclaimer: This is the diary of a personal trading system, its methodology and the signals that it is producing. You are welcome to follow along but please understand that the information presented here is for educational purposes only. No recommendations are being made to buy, or sell stocks, options or futures contracts. Please consult your own financial advisor before making any investment decisions.


Snowball

I love your eyes, my darling friend, their play so light and brightening. When a sudden stare up you send, and like a heaven-blown lightning, it'd take in all from end to end. But there's nothing more that I admire; your eyes when they are downcast. In bursts of love inspired fire, and through the eyelash goes fast – a longing, dull call of desire.

Dir: Andrei Tarkovsky, Stalker, 1979
Screenplay: Boris and Arkady Strugatsky

The market continues higher with a gap up, up above the channel and above recent congestion.

Improvement in the oscillators supports the move and the current Buy Signal continues.

Chart of S&P 500 for 14 September 2018

Be prepared for whatever is coming next, and trade with confidence:

To receive detailed daily analysis, guidance and the updated daily Buy / Sell trigger levels being generated by the Trading the Line system before the market opens, and intraday alerts when appropriate, please become a Member and Sign up for Alerts & Observations – includes access to Members Area and the Explanatory Notes for all of the concepts discussed.

Disclaimer: This is the diary of a personal trading system, its methodology and the signals that it is producing. You are welcome to follow along but please understand that the information presented here is for educational purposes only. No recommendations are being made to buy, or sell stocks, options or futures contracts. Please consult your own financial advisor before making any investment decisions.


Dahl

Those who don't believe in magic will never find it.
Roald Dahl, The Minpins, 1991

Some profit-taking within the channel and a look-see at 2895.

The T volume oscillator moves up displaying improvement and defines a small T centered at the recenty low which suggests a push higher into the end of the week, and an echo high is scheduled for today.

Chart of S&P 500 for 13 September 2018

Be prepared for whatever is coming next, and trade with confidence:

To receive detailed daily analysis, guidance and the updated daily Buy / Sell trigger levels being generated by the Trading the Line system before the market opens, and intraday alerts when appropriate, please become a Member and Sign up for Alerts & Observations – includes access to Members Area and the Explanatory Notes for all of the concepts discussed.

Disclaimer: This is the diary of a personal trading system, its methodology and the signals that it is producing. You are welcome to follow along but please understand that the information presented here is for educational purposes only. No recommendations are being made to buy, or sell stocks, options or futures contracts. Please consult your own financial advisor before making any investment decisions.


Marathon

A straight up day from a gap down, moving up through the S/T BUY signal line at 2888, and through the recent declining resistance.

The re-emergence of superior price performance yesterday suggests a continuation of the advance. Watch to see if this is also supported by the oscillators in the next few days.

Chart of S&P 500 for 12 September 2018

Be prepared for whatever is coming next, and trade with confidence:

To receive detailed daily analysis, guidance and the updated daily Buy / Sell trigger levels being generated by the Trading the Line system before the market opens, and intraday alerts when appropriate, please become a Member and Sign up for Alerts & Observations – includes access to Members Area and the Explanatory Notes for all of the concepts discussed.

Disclaimer: This is the diary of a personal trading system, its methodology and the signals that it is producing. You are welcome to follow along but please understand that the information presented here is for educational purposes only. No recommendations are being made to buy, or sell stocks, options or futures contracts. Please consult your own financial advisor before making any investment decisions.


dystopia

In memory of all those who died 17 years ago

The market gaps up into declining resistance at the top of the channel and drifts lower.

Still waiting for a signal.

Chart of S&P500 for 11 September 2018

Be prepared for whatever is coming next, and trade with confidence:

To receive detailed daily analysis, guidance and the updated daily Buy / Sell trigger levels being generated by the Trading the Line system before the market opens, and intraday alerts when appropriate, please become a Member and Sign up for Alerts & Observations – includes access to Members Area and the Explanatory Notes for all of the concepts discussed.

Disclaimer: This is the diary of a personal trading system, its methodology and the signals that it is producing. You are welcome to follow along but please understand that the information presented here is for educational purposes only. No recommendations are being made to buy, or sell stocks, options or futures contracts. Please consult your own financial advisor before making any investment decisions.


Pinkie

An attempt to move higher from an a gap down is also sold into as the market continues to decline in a relatively orderly manner.

The market continues to look for a support level prior to the next advance.

Chart of S&P 500 for 10 September 2018

Be prepared for whatever is coming next, and trade with confidence:

To receive detailed daily analysis, guidance and the updated daily Buy / Sell trigger levels being generated by the Trading the Line system before the market opens, and intraday alerts when appropriate, please become a Member and Sign up for Alerts & Observations – includes access to Members Area and the Explanatory Notes for all of the concepts discussed.

Disclaimer: This is the diary of a personal trading system, its methodology and the signals that it is producing. You are welcome to follow along but please understand that the information presented here is for educational purposes only. No recommendations are being made to buy, or sell stocks, options or futures contracts. Please consult your own financial advisor before making any investment decisions.

Boxer

The weakness continues and confirms Wednesday's 'cover' signal as the market takes a look at 2868 before a strong afternoon recovery.

Market very much still within a declining channel.

The Osc oscillator makes a Sell Signal.

  Chart of S&P 500 for 07 September 2018

Be prepared for whatever is coming next, and trade with confidence:

To receive detailed daily analysis, guidance and the updated daily Buy / Sell trigger levels being generated by the Trading the Line system before the market opens, and intraday alerts when appropriate, please become a Member and Sign up for Alerts & Observations – includes access to Members Area and the Explanatory Notes for all of the concepts discussed.

Disclaimer: This is the diary of a personal trading system, its methodology and the signals that it is producing. You are welcome to follow along but please understand that the information presented here is for educational purposes only. No recommendations are being made to buy, or sell stocks, options or futures contracts. Please consult your own financial advisor before making any investment decisions.


September

I hope that you have enjoyed the summer.

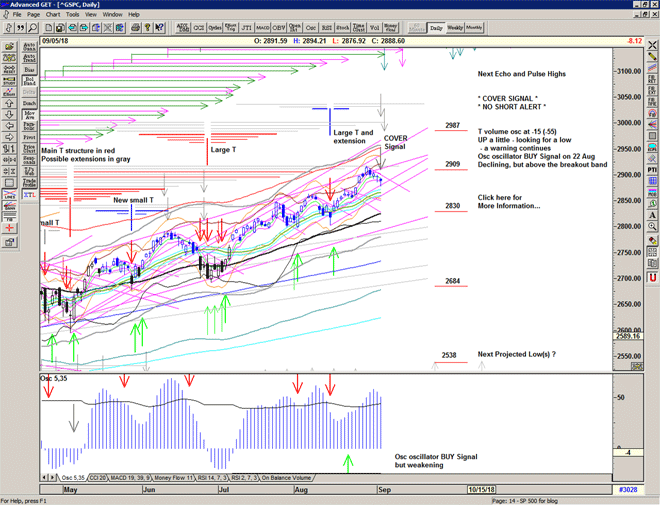
The market has continued to rise throughout the summer months with the July highs superceeded by August's assault on 2900.
Although at times there have been warnings of complacency with low put/call ratios and relative weakness evident, each of the declines has generated new highs with the T structures supporting and overlapping each other.

As you can see the summer advance projected some highs at or just after the Labor Day holiday, and the market is currently testing important rising support just below 2900. As the majority of participants get back into the swing of things it would make sense to see some consolidation at these levels or perhaps a bit lower, and prove whether the recent breakout to new all time highs is justified or not.

Chart of S&P 500 for 6 September 2018

Save the image to your desktop to view a larger version

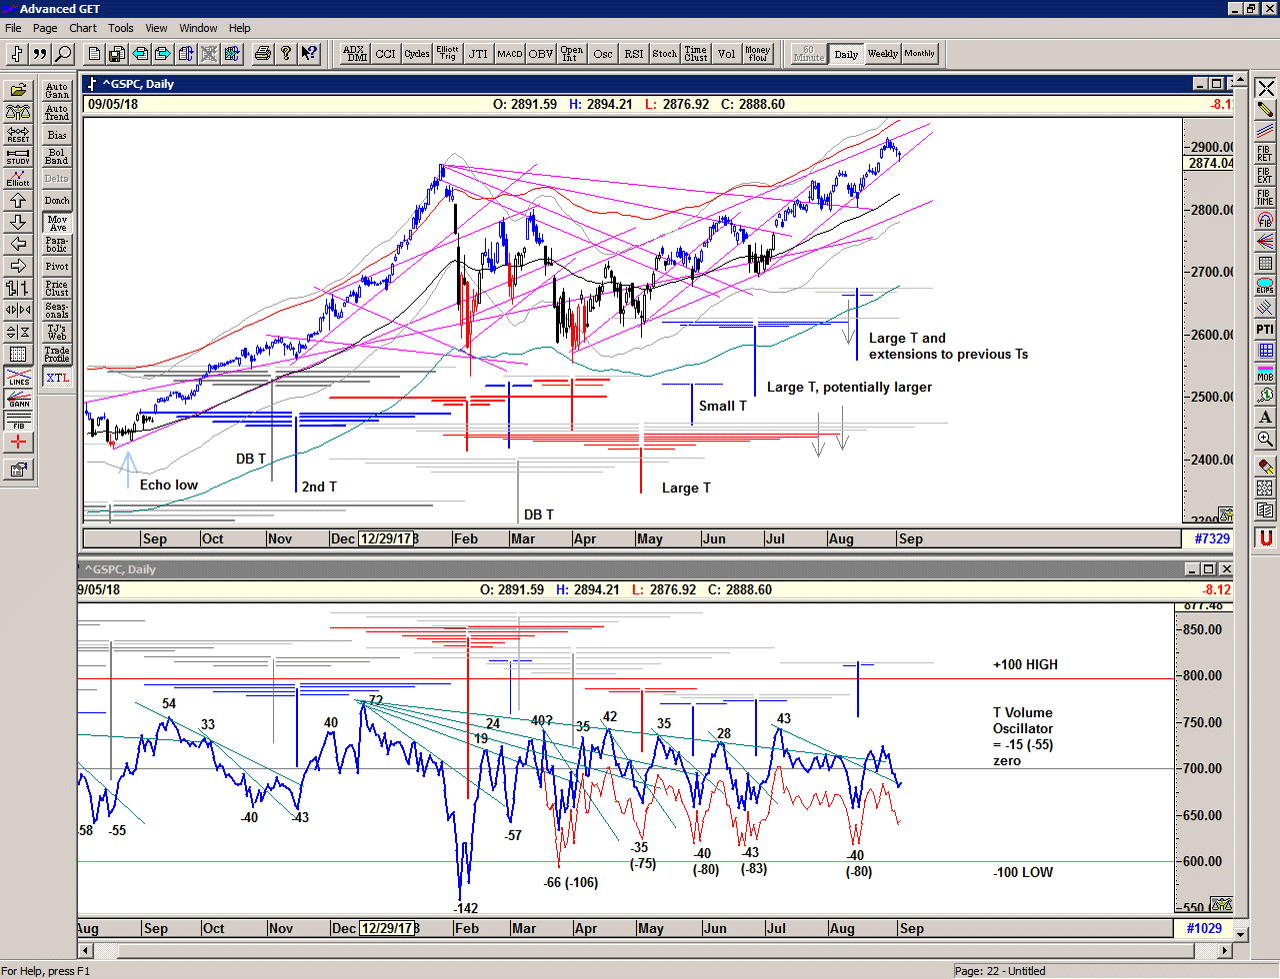
Zooming out to a one year chart, below, we can see that once the market had broken the triangular structure and the series of declining angles from the January high it was able to resume its previous trajectory. This is especially evident since the July lows.

The break away move since the July low was accompanied with a strong move up in the T volume oscillator from a stabilisation pattern and this in turn activated a new large T structure projecting highs in August and possibly also into this week.

After projections of major T structures it is usual to see a significant drop in buying power and the market subsequently looks for the price to stabilise at a level where value is perceived. The T volume oscillator is derived from the NYSE advance / decline volumes and is therefore a good representation of the overall flow of buying power within the market as a whole.

Chart of S&P 500 for 06 September 2018

Save the image to your desktop to view a larger version

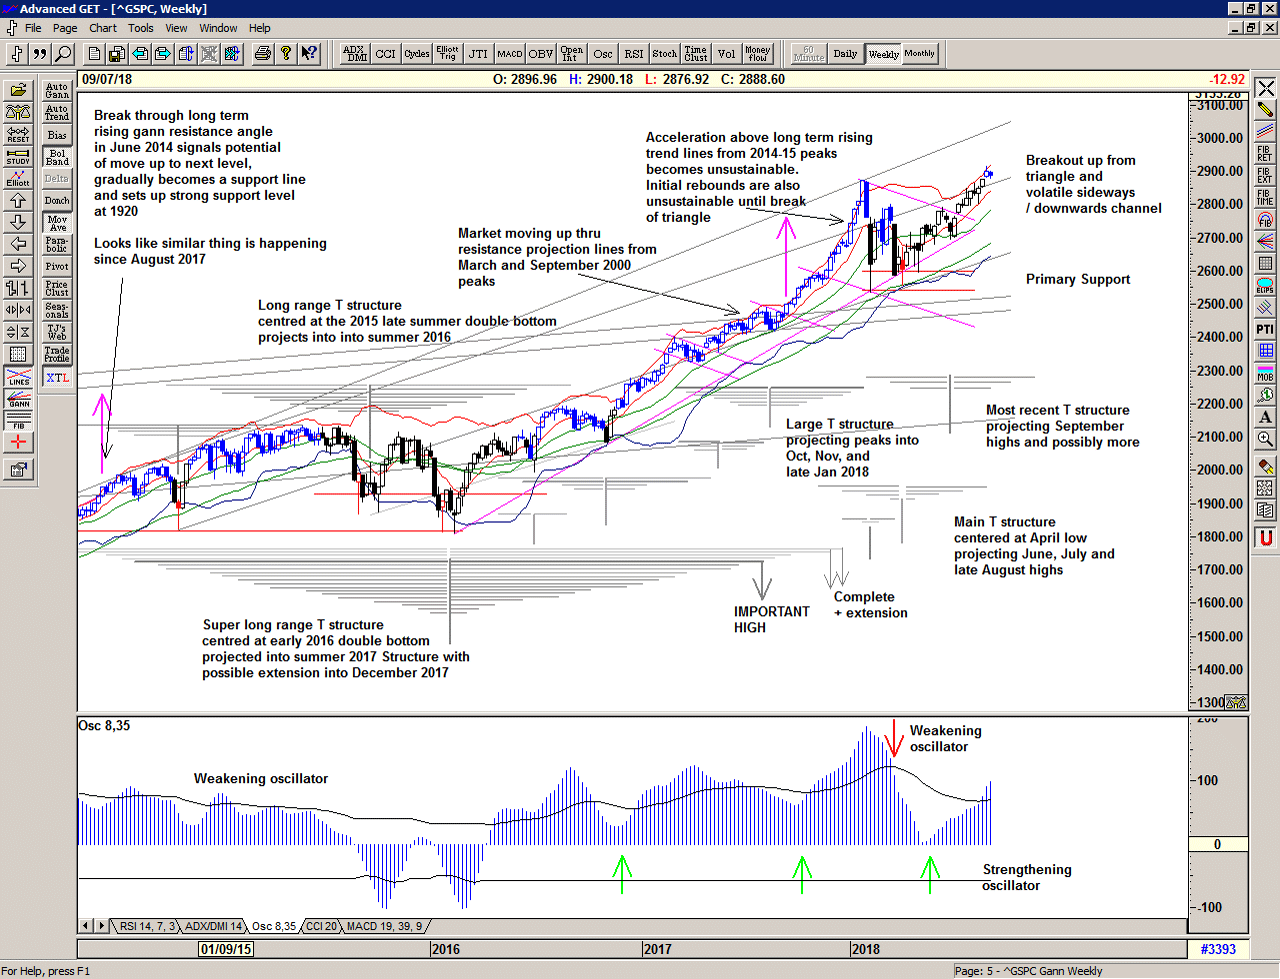
In the weekly chart we can see that the volatile range-bound action of the first 4-5 months of the year eventually gave way to the continuation of the search for new all time highs.

Movement up above the long-term trendline along with the projection for early September highs has apparently triggered some selling as the market looks to stabilise itself again after its recovery to new all time highs

Weekly chart of S&P 500 for 06 September 2018

Save the image to your desktop to view a larger version

All in all 2018 continues to be an exciting year bringing with it some excellent opportunity and a range that is far beyond the experience of recent years.

Along with the expansion of automated trading systems, artificial intelligence, a greater use of hedging and volatility products, as price moves higher itself range itself appears to becoming greater, and the greater the range, the greater the opportunity. This is a Brave New World. We should expect it to continue and trade accordingly.

Regardless of whether the market can sustain its trajectory for higher highs or whether another, perhaps deep, low is ahead of us, the simplicity of the proprietary price based S/T Signalling System continues to keep us on the correct side of the market, as of yesterday providing a timely Cover signal, for now.

If you would like to learn more about using the S/T Signalling System please get in touch.

Be prepared for whatever is coming next, and trade with confidence:

To receive detailed daily analysis, guidance and the updated daily Buy / Sell trigger levels being generated by the Trading the Line system before the market opens, and intraday alerts when appropriate, please become a Member and Sign up for Alerts & Observations – includes access to Members Area and the Explanatory Notes for all of the concepts discussed.

Disclaimer: This is the diary of a personal trading system, its methodology and the signals that it is producing. You are welcome to follow along but please understand that the information presented here is for educational purposes only. No recommendations are being made to buy, or sell stocks, options or futures contracts. Please consult your own financial advisor before making any investment decisions.