Oktober

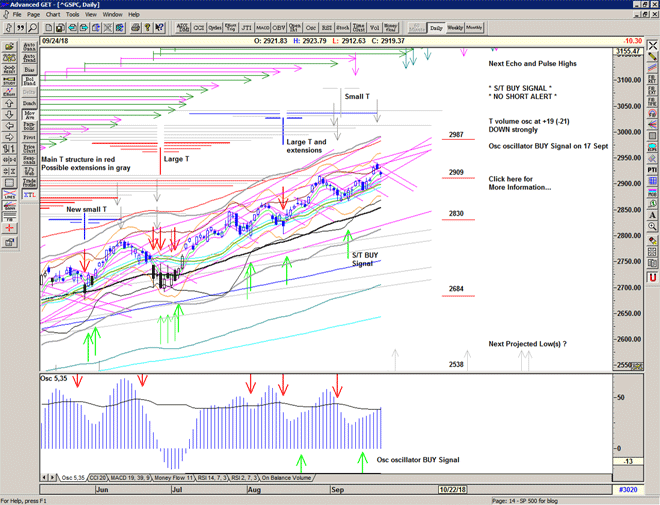
Another reconnaissance, an attempt at the Buy Signal level and just touched before backing off.

We need to see a close above the Buy Signal level to initiate a move beyond the all time high.

Still, the market is holding up above key price levels, for now.

Osc oscillator confirms a sell signal and this either suggests that the next move will not be significantly higher or that there is downward pressure developing.

Chart of S&P 500 for 01 October 2018

Be prepared for whatever is coming next, and trade with confidence:

To receive detailed daily analysis, guidance and the updated daily Buy / Sell trigger levels being generated by the Trading the Line system before the market opens, and intraday alerts when appropriate, please become a Member and Sign up for Alerts & Observations – includes access to Members Area and the Explanatory Notes for all of the concepts discussed.

Disclaimer: This is the diary of a personal trading system, its methodology and the signals that it is producing. You are welcome to follow along but please understand that the information presented here is for educational purposes only. No recommendations are being made to buy, or sell stocks, options or futures contracts. Please consult your own financial advisor before making any investment decisions.


Reconnaissance

And I follow, follow, follow,
The Gypsy Faerie Queen,
We exist, exist, exist, exist,
in the twilight in-between.

Marianne Faithfull, The Gypsy Faerie Queen feat. Nick Cave, 2018

A tale of two halves with the market heading higher in morning trade to trigger an S/T Buy Signal at 2920, but finding declining resistance in afternoon trade and backing right off, cancelling the signal for the time being.

Still very much within the declining environment since last Friday's reversal at 2940, but holding up above key levels, for now.

Cover signal continues.

Chart of S&P 500 for 28 September 2018

Be prepared for whatever is coming next, and trade with confidence:

To receive detailed daily analysis, guidance and the updated daily Buy / Sell trigger levels being generated by the Trading the Line system before the market opens, and intraday alerts when appropriate, please become a Member and Sign up for Alerts & Observations – includes access to Members Area and the Explanatory Notes for all of the concepts discussed.

Disclaimer: This is the diary of a personal trading system, its methodology and the signals that it is producing. You are welcome to follow along but please understand that the information presented here is for educational purposes only. No recommendations are being made to buy, or sell stocks, options or futures contracts. Please consult your own financial advisor before making any investment decisions.


Banana

There she goes
There she goes again
Racing through' my brain
And I just can't contain
This feelin' that remains

The Velvet Underground, There She Goes Again, 1967
Songwriter: Lou Reed

Well, the Fed speaks and the market reacts providing traders with the brief opportunity to sell in the vicinity of the recent all time high, followed by a rapid descent which triggered a 'cover' signal at 2909.

At the very least we should now expect some kind of stabilisation phase as the market looks to find support, with the possibility of further selling.

Yesterday's action suggests to me that the current T structures may be complete, and that a corrective phase may now be necessary.

The rapid drop in the T volume oscillator since the high on Friday morning is flashing a warning as one would normally expect to see some follow through from a thrust in the oscillator, and so, for now, last week looks like distribution at the high.

Watch the declining angles from the high, rising support lines and averages, and the oscillators for signs of stabilisation as we wait for the next signal.

Chart of S&P 500 for 27 September 2018

Be prepared for whatever is coming next, and trade with confidence:

To receive detailed daily analysis, guidance and the updated daily Buy / Sell trigger levels being generated by the Trading the Line system before the market opens, and intraday alerts when appropriate, please become a Member and Sign up for Alerts & Observations – includes access to Members Area and the Explanatory Notes for all of the concepts discussed.

Disclaimer: This is the diary of a personal trading system, its methodology and the signals that it is producing. You are welcome to follow along but please understand that the information presented here is for educational purposes only. No recommendations are being made to buy, or sell stocks, options or futures contracts. Please consult your own financial advisor before making any investment decisions.


Spindrift

The market continues to grind and drift lower within the channel, waiting for the catalyst from the Fed, perhaps for some further justification for higher prices, or a reason to sell.

Chart of S&P 500 for 26 September 2018

Be prepared for whatever is coming next, and trade with confidence:

To receive detailed daily analysis, guidance and the updated daily Buy / Sell trigger levels being generated by the Trading the Line system before the market opens, and intraday alerts when appropriate, please become a Member and Sign up for Alerts & Observations – includes access to Members Area and the Explanatory Notes for all of the concepts discussed.

Disclaimer: This is the diary of a personal trading system, its methodology and the signals that it is producing. You are welcome to follow along but please understand that the information presented here is for educational purposes only. No recommendations are being made to buy, or sell stocks, options or futures contracts. Please consult your own financial advisor before making any investment decisions.


Observer

The market drops out of the gate and takes a good look at Thursday's gap. Still within the channel and above the Buy Signal level, for now.

Chart of S&P 500 for 25 September 2018

Be prepared for whatever is coming next, and trade with confidence:

To receive detailed daily analysis, guidance and the updated daily Buy / Sell trigger levels being generated by the Trading the Line system before the market opens, and intraday alerts when appropriate, please become a Member and Sign up for Alerts & Observations – includes access to Members Area and the Explanatory Notes for all of the concepts discussed.

Disclaimer: This is the diary of a personal trading system, its methodology and the signals that it is producing. You are welcome to follow along but please understand that the information presented here is for educational purposes only. No recommendations are being made to buy, or sell stocks, options or futures contracts. Please consult your own financial advisor before making any investment decisions.


Enterprise

The market probes higher but struggles at 2940. This is in-line with a projection for a high from the recent T structure. Some consolidation at this level may be necessary. The T volume oscillator continues higher indicating that this is a thrust and we usually see higher prices in due course after a thrust.

Chart of S&P 500 for 24 September 2018

Be prepared for whatever is coming next, and trade with confidence:

To receive detailed daily analysis, guidance and the updated daily Buy / Sell trigger levels being generated by the Trading the Line system before the market opens, and intraday alerts when appropriate, please become a Member and Sign up for Alerts & Observations – includes access to Members Area and the Explanatory Notes for all of the concepts discussed.

Disclaimer: This is the diary of a personal trading system, its methodology and the signals that it is producing. You are welcome to follow along but please understand that the information presented here is for educational purposes only. No recommendations are being made to buy, or sell stocks, options or futures contracts. Please consult your own financial advisor before making any investment decisions.

Gypsy

I’m known by many different names,
My good friend Will calls me Puck and Robin Goodfellow,
I follow the Gypsy Faerie Queen
And I follow the Gypsy Faerie Queen

Marianne Faithfull, The Gypsy Faerie Queen feat. Nick Cave, 2018

A squeeze and 'pop' as the market moves up out of recent congestion and above the previous all time high.

The T volume oscillator thrusts higher in support of the move.

Chart of S&P 500 for 21 September 2018

Be prepared for whatever is coming next, and trade with confidence:

To receive detailed daily analysis, guidance and the updated daily Buy / Sell trigger levels being generated by the Trading the Line system before the market opens, and intraday alerts when appropriate, please become a Member and Sign up for Alerts & Observations – includes access to Members Area and the Explanatory Notes for all of the concepts discussed.

Disclaimer: This is the diary of a personal trading system, its methodology and the signals that it is producing. You are welcome to follow along but please understand that the information presented here is for educational purposes only. No recommendations are being made to buy, or sell stocks, options or futures contracts. Please consult your own financial advisor before making any investment decisions.


Absolute

The hypothesis of God, for instance, gives an incomparably absolute opportunity to understand everything and know absolutely nothing. Give man an extremely simplified system of the world and explain every phenomenon away on the basis of that system. An approach like that doesn't require any knowledge. Just a few memorized formulas plus so-called intuition and so-called common sense.

Arkady & Boris Strugatsky, Roadside Picnic, 1972

Chopping about in the vicinity of the all time high, waiting for a catalyst for higher prices or a reason to sell.

Price begining to squeeze.

Chart of S&P 500 for 20 September 2018

Be prepared for whatever is coming next, and trade with confidence:

To receive detailed daily analysis, guidance and the updated daily Buy / Sell trigger levels being generated by the Trading the Line system before the market opens, and intraday alerts when appropriate, please become a Member and Sign up for Alerts & Observations – includes access to Members Area and the Explanatory Notes for all of the concepts discussed.

Disclaimer: This is the diary of a personal trading system, its methodology and the signals that it is producing. You are welcome to follow along but please understand that the information presented here is for educational purposes only. No recommendations are being made to buy, or sell stocks, options or futures contracts. Please consult your own financial advisor before making any investment decisions.


Ghosts

Ghosts in the photograph
Never lie'd to me
I'd be all of that
I'd be all of that
A false memory
Would be everything
A denial my eliminent

Mogwai, Take Me Somewhere Nice, 2001

A recovery from Monday's selling and the market takes another look at the 2909 pivot.

Chart of S&P 500 for 19 September 2018

Be prepared for whatever is coming next, and trade with confidence:

To receive detailed daily analysis, guidance and the updated daily Buy / Sell trigger levels being generated by the Trading the Line system before the market opens, and intraday alerts when appropriate, please become a Member and Sign up for Alerts & Observations – includes access to Members Area and the Explanatory Notes for all of the concepts discussed.

Disclaimer: This is the diary of a personal trading system, its methodology and the signals that it is producing. You are welcome to follow along but please understand that the information presented here is for educational purposes only. No recommendations are being made to buy, or sell stocks, options or futures contracts. Please consult your own financial advisor before making any investment decisions.