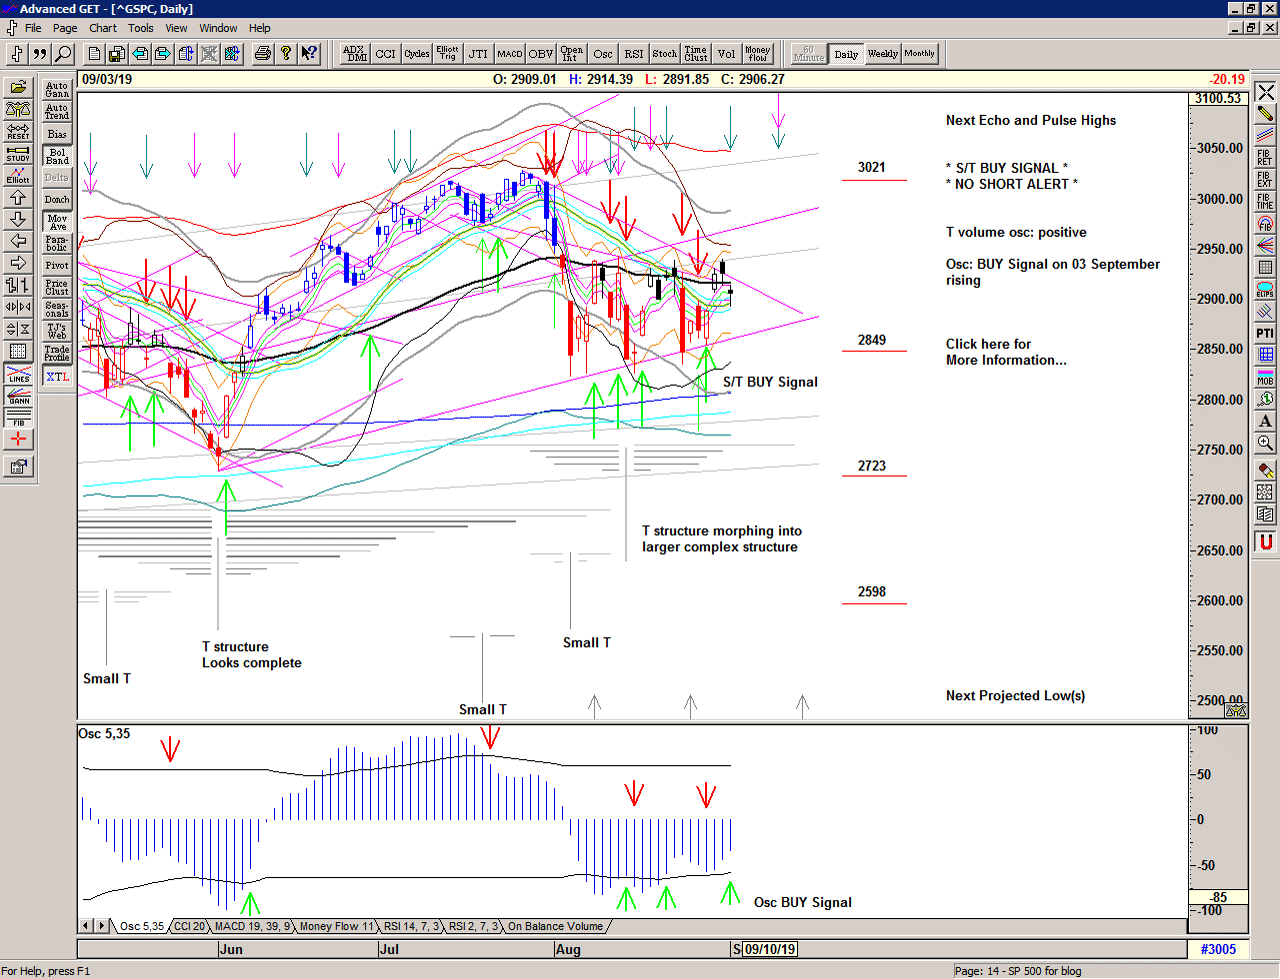
Three thousand in July and a rough August with some chaotic selling action and 3 recent important looking lows as the market pumps and dumps in the box from 2820 to 2940.
With similarities from previous drops out of all time highs and volatility becoming a signature for consolidation, we look forward to an action packed Fall.
And a market very much in a place of mixed signals.
Save the image to your desktop to view a larger version
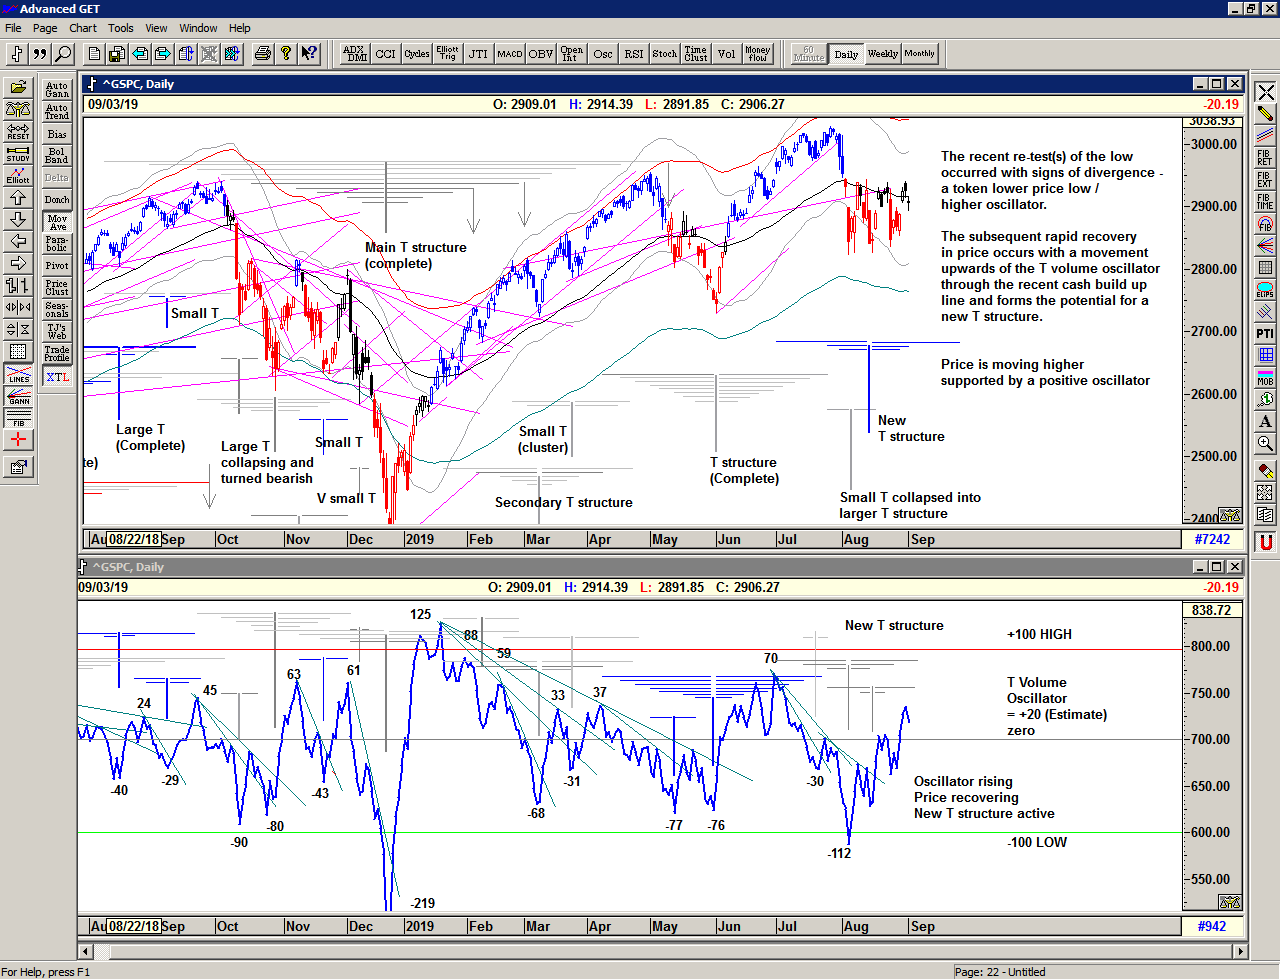
As we can see in the chart below with the T volume oscillator*, the oscillator started to flash warning signs at the 15 July high, hinting of exhaustion.
The early August low makes an impact low in the oscillator and the oscillator has subsequently been rising throughout the recent consolidation pattern.
This is, of course, a complex structure that could resolve to either the upside or collapse into a more important lower low.
* The T volume oscillator is an indication of Buying Power within the market as a whole
Save the image to your desktop to view a larger version
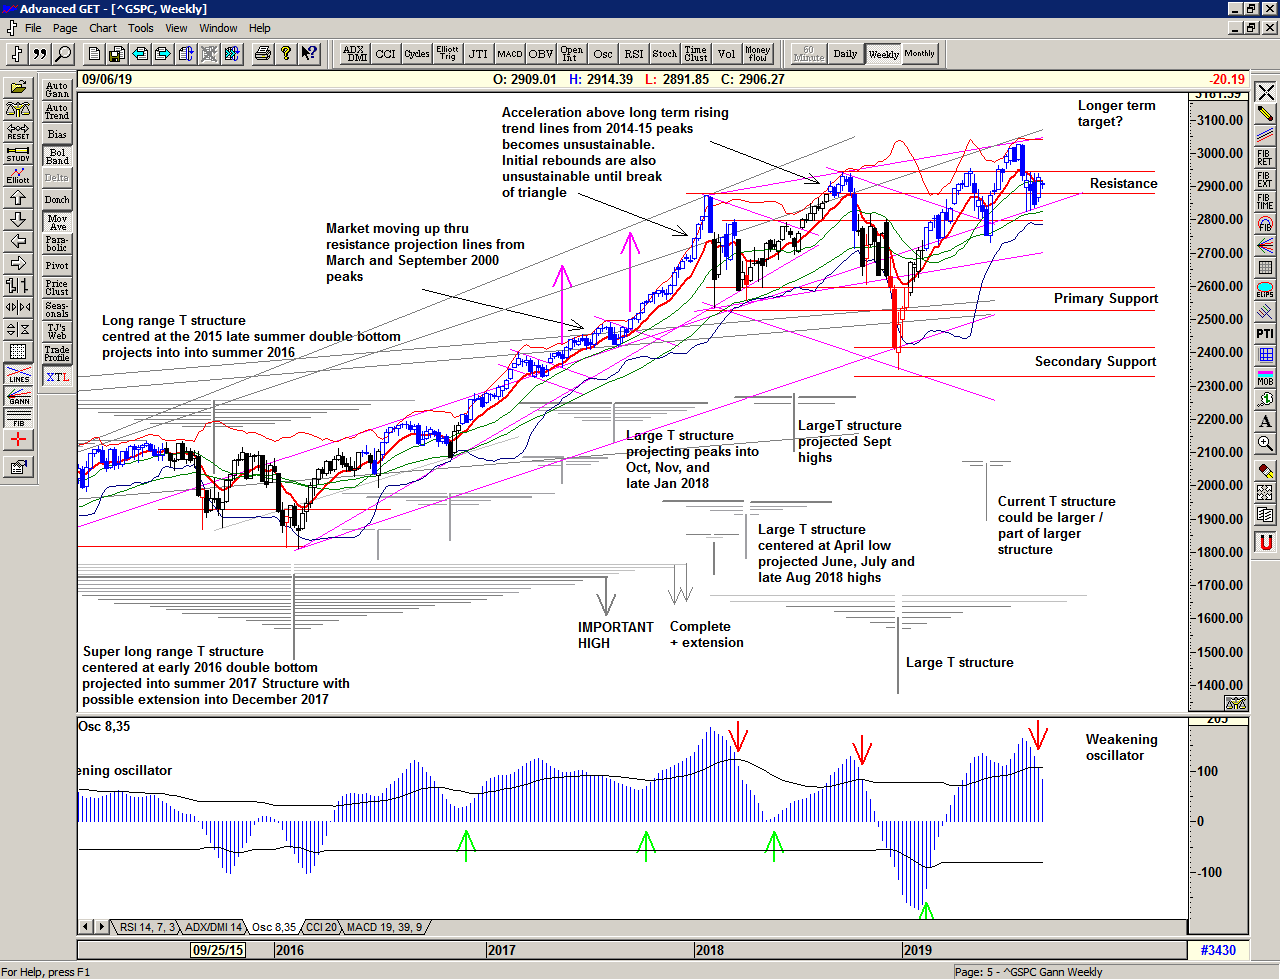
The weekly chart continues to show a bullish market within the context of a long term trajectory having found support at the long term rising angle.
However, the oscillator is weakening again, hinting at the possibility of further exploration of the downside, and a break below the recent lows would quickly target the May low at 2750 and possibly the more important support levels below that.
Save the image to your desktop to view a larger version
The monthly chart highlights the important resistance above coinciding with the 4 important peaks.
The Mega T structure projects another important high for October, and the oscillator remains strong supporting the possibility of new highs and perhaps ultimately a break out above that resistance line in due course.

Save the image to your desktop to view a larger version
2019 continues to bring some fast and furious action in the market with a range that continues to be expansive. We can only assume that this will continue. This is a Brave New World.
–
Regardless of whether the market can continue higher or whether significant lows are ahead of us, the simplicity of the proprietary price based S/T Signalling System continues to keep us on the correct side of the market, with price currently back on a Buy Signal.
If you would like to learn more about using the S/T Signalling System please get in touch.
–
Be prepared for whatever is coming next, and trade with confidence:
To receive detailed daily analysis, guidance and the updated daily Buy / Sell trigger levels being generated by the Trading the Line system before the market opens, and intra-day alerts when appropriate, please become a Member and Sign up for Alerts & Observations – includes access to Members Area and the Explanatory Notes for all of the concepts discussed.
Disclaimer: This is the diary of a personal trading system, its methodology and the signals that it is producing. You are welcome to follow along but please understand that the information presented here is for educational purposes only. No recommendations are being made to buy, or sell stocks, options or futures contracts. Please consult your own financial advisor before making any investment decisions.


