Another busy week as the market spikes higher and re-visits the pivot at 3021.
Mixed signals continue:
Arms index levels are high again (3 days in row), cumulatively high and bullish.
The T volume oscillator has declined towards zero, flashing a warning, and indicating a reduction in liquidity and buying power.
The Osc oscillator flattens off indicating a slowing of momentum.
Price remains above the Buy Signal level but it looks like risk is increasing and the current structure may be completing or moving towards completion.
The next important projection is 24 September which is also a scheduled echo high.
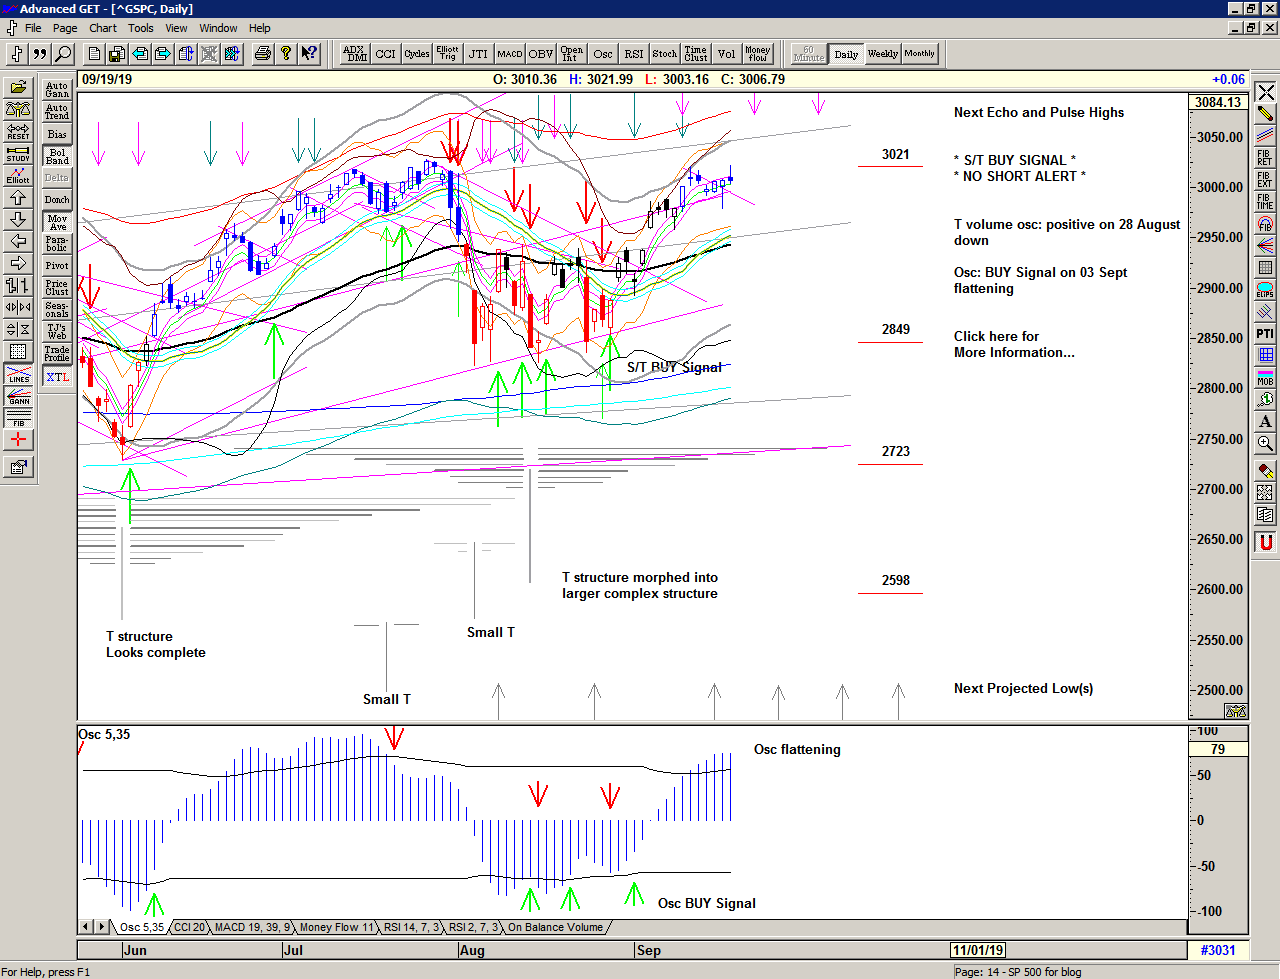
Save the image to your desktop to view a larger version
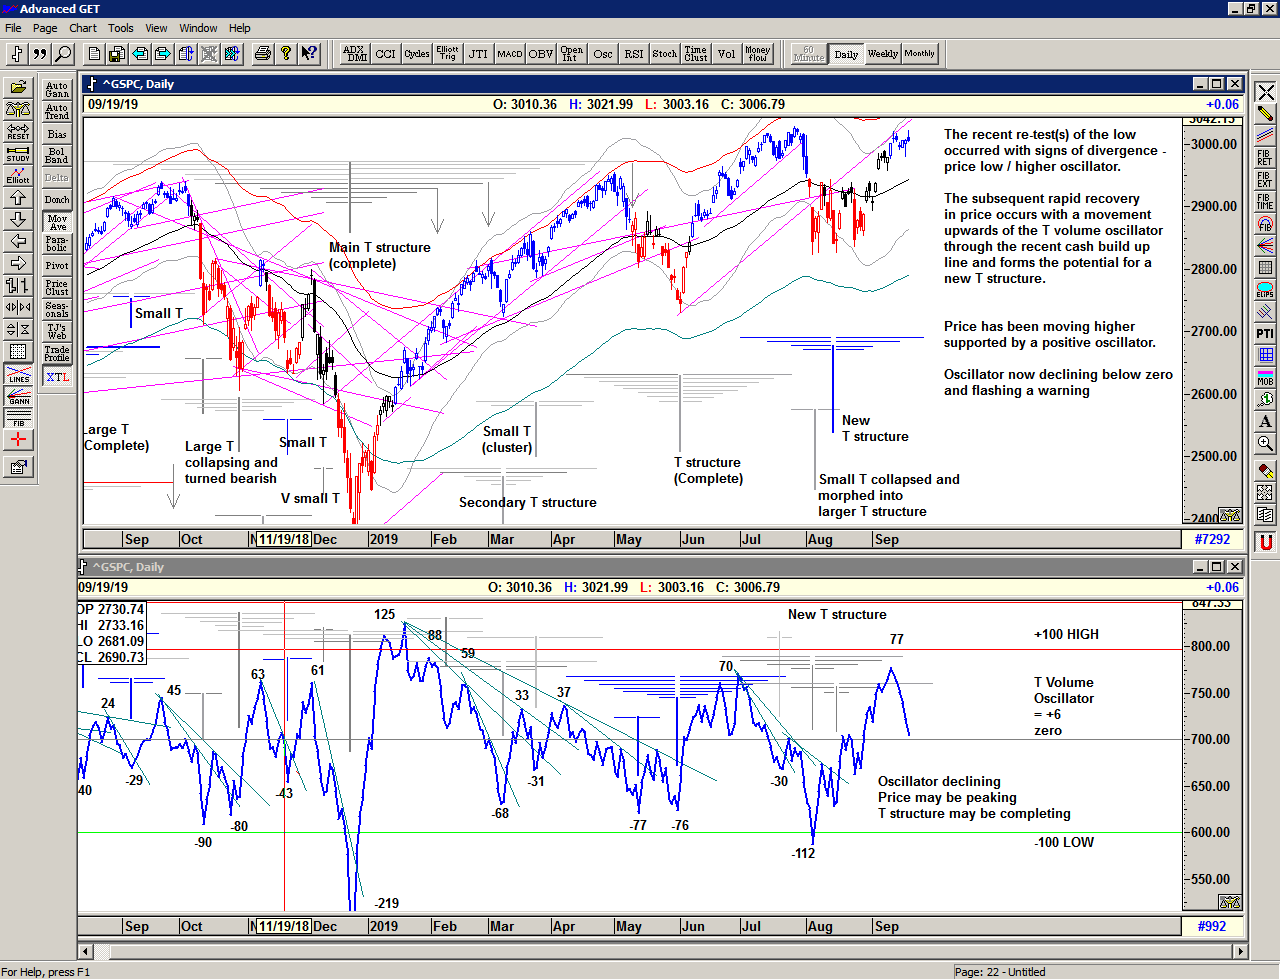
Save the image to your desktop to view a larger version
–
Although the S/T System is not a day trading system, I am frequently asked about day trading and have now included my Notes on Day Trading (pdf) in the membership package.
Trading the Line Membership includes:
Daily pre-market Newsletter with the S/T Buy, Cover, and Sell Signal levels and other observations
Email alerts prior to and at Signal change
Members Login for archive of observations etc
Explanatory Notes (pdf)
Day Trading Notes (pdf)
More information…
–
Regardless of whether the market can continue higher or whether significant lows are ahead of us, the simplicity of the proprietary price based S/T Signalling System continues to keep us on the correct side of the market, with price currently on a Buy Signal since 2887 on 28 August 2019
If you would like to learn more about using the S/T Signalling System please get in touch.
–
To receive detailed daily analysis, guidance and the updated daily Buy / Sell trigger levels being generated by the Trading the Line system before the market opens, and intra-day alerts when appropriate, please become a Member and Sign up for Alerts & Observations – includes access to Members Area, Explanatory Notes (pdf) for all of the concepts discussed, and Notes on Day Trading (pdf)
Disclaimer: This is the diary of a personal trading system, its methodology and the signals that it is producing. You are welcome to follow along but please understand that the information presented here is for educational purposes only. No recommendations are being made to buy, or sell stocks, options or futures contracts. Please consult your own financial advisor before making any investment decisions.


