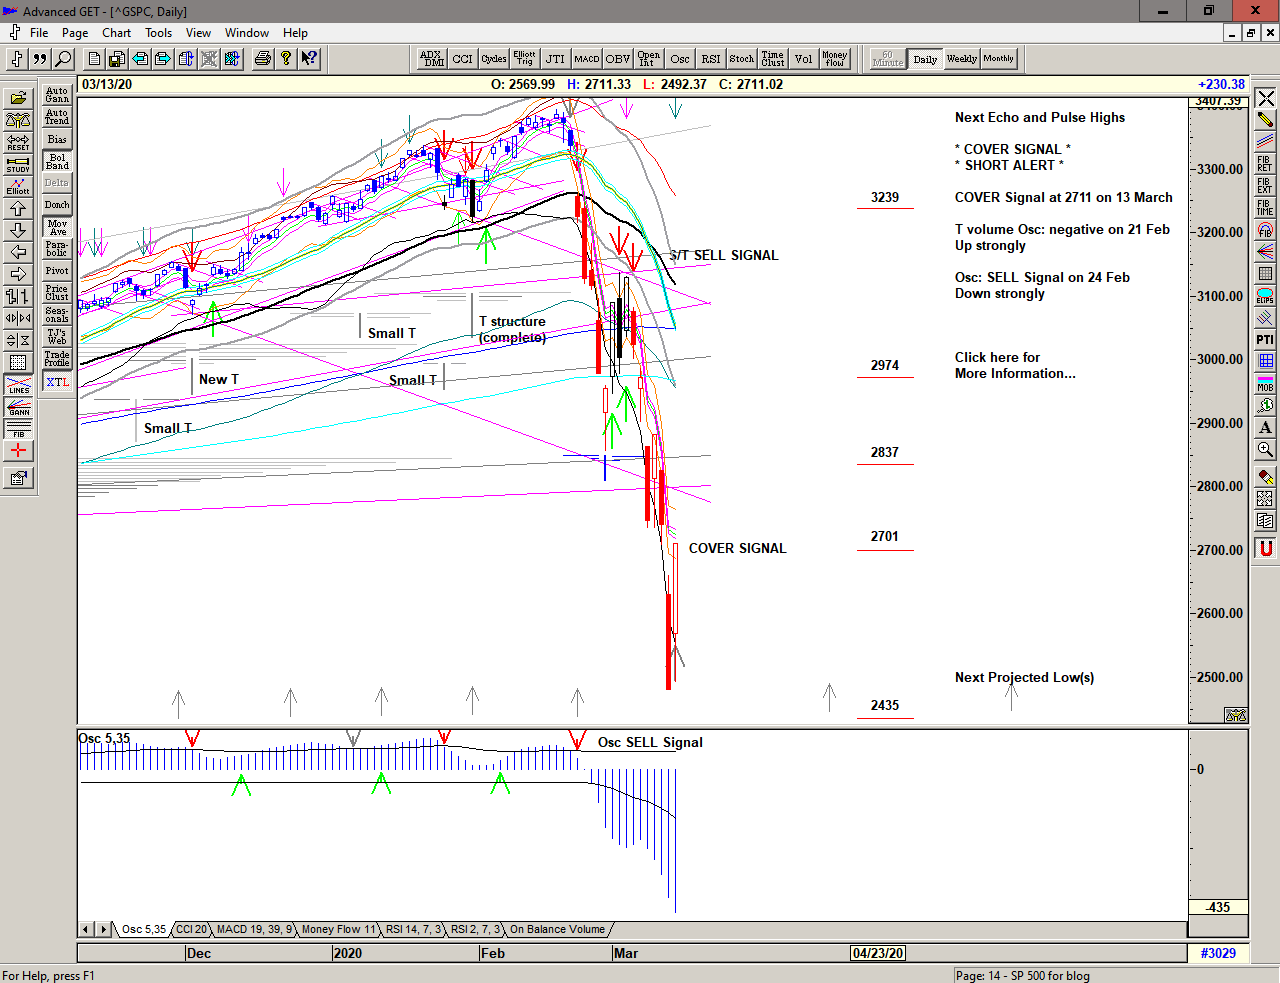
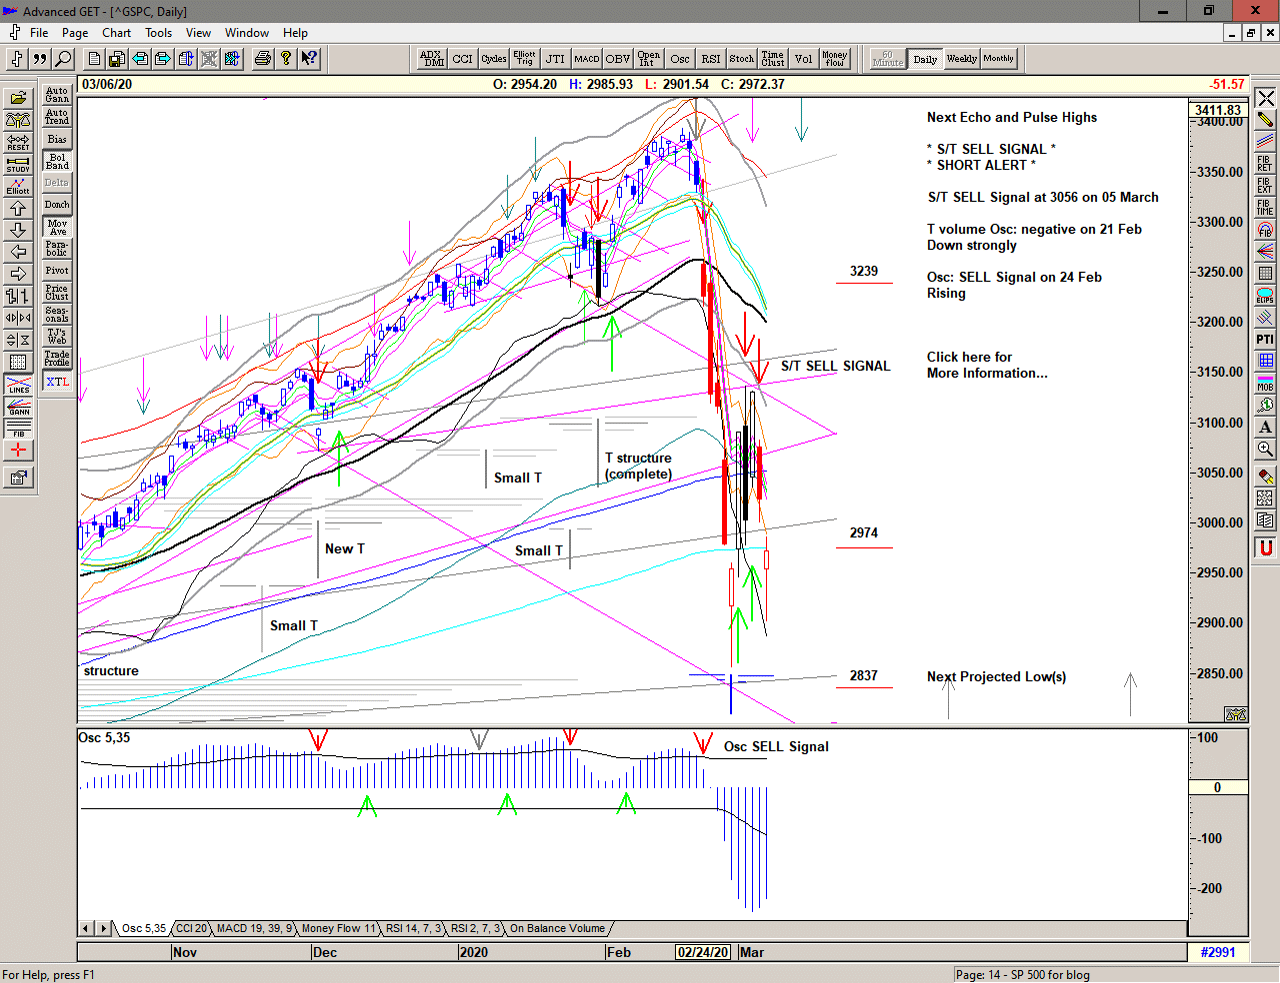
Fear and uncertainty grips the market with a huge drop overnight on 24 February – well below the Sell Signal level at 3316 – and takes the market down to a low on 28 February at 2856 before a short covering bounce to 3090.
A Fed announcement on 03 March and a look at 3136 before another slide to 2976.
A recovery above 3000 on 04 March sees another high at 3130 before more selling on 05 and 06 March sees 2901 before attempting to recover.
Breathtaking and intimidating price action with very strong moves in both directions the hallmark of volatility in this market triggered by declines below the key levels.
Save the image to your desktop to view a larger version
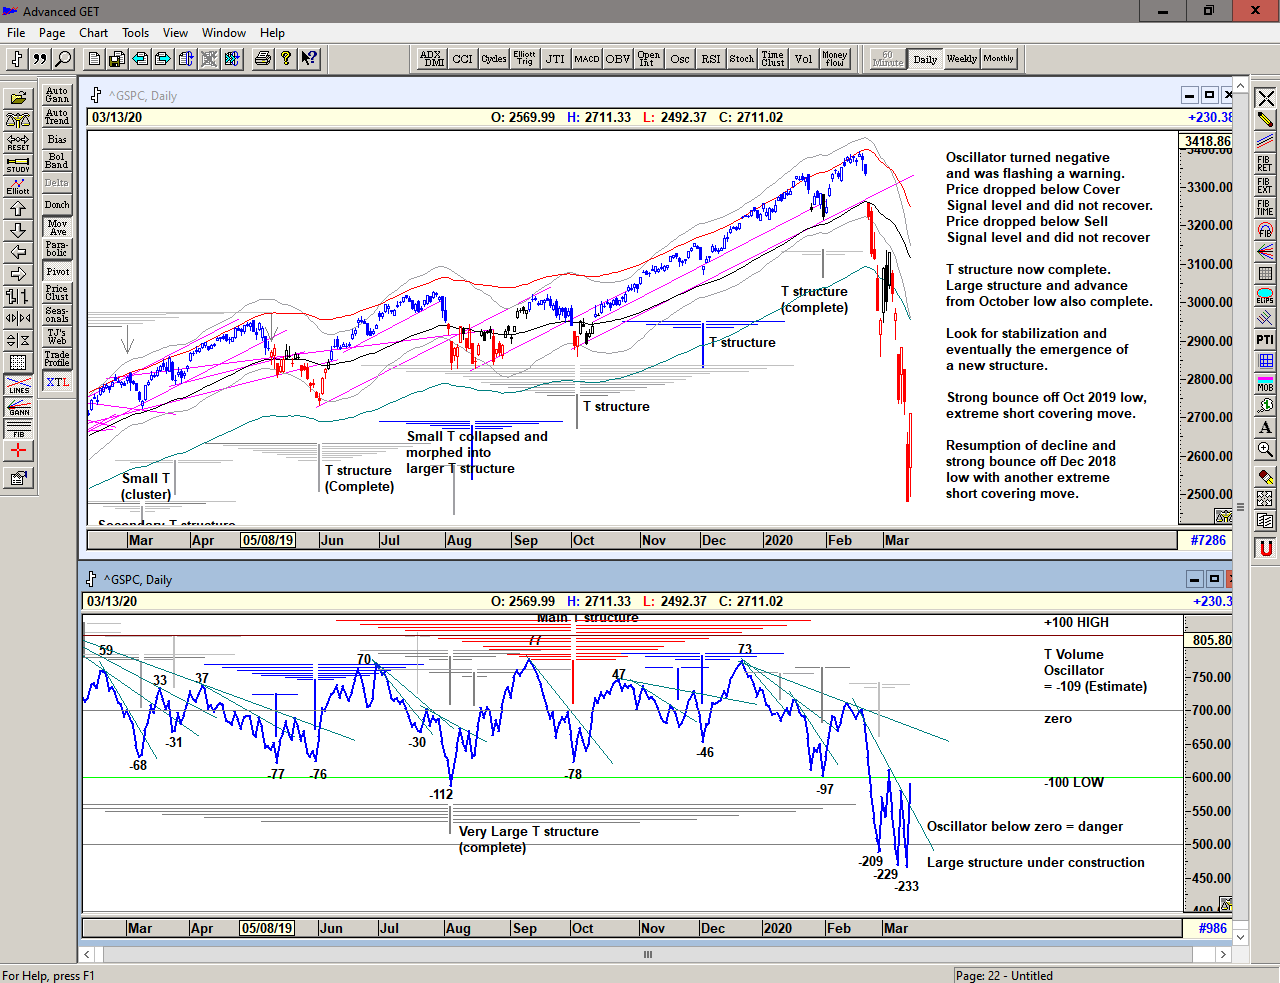
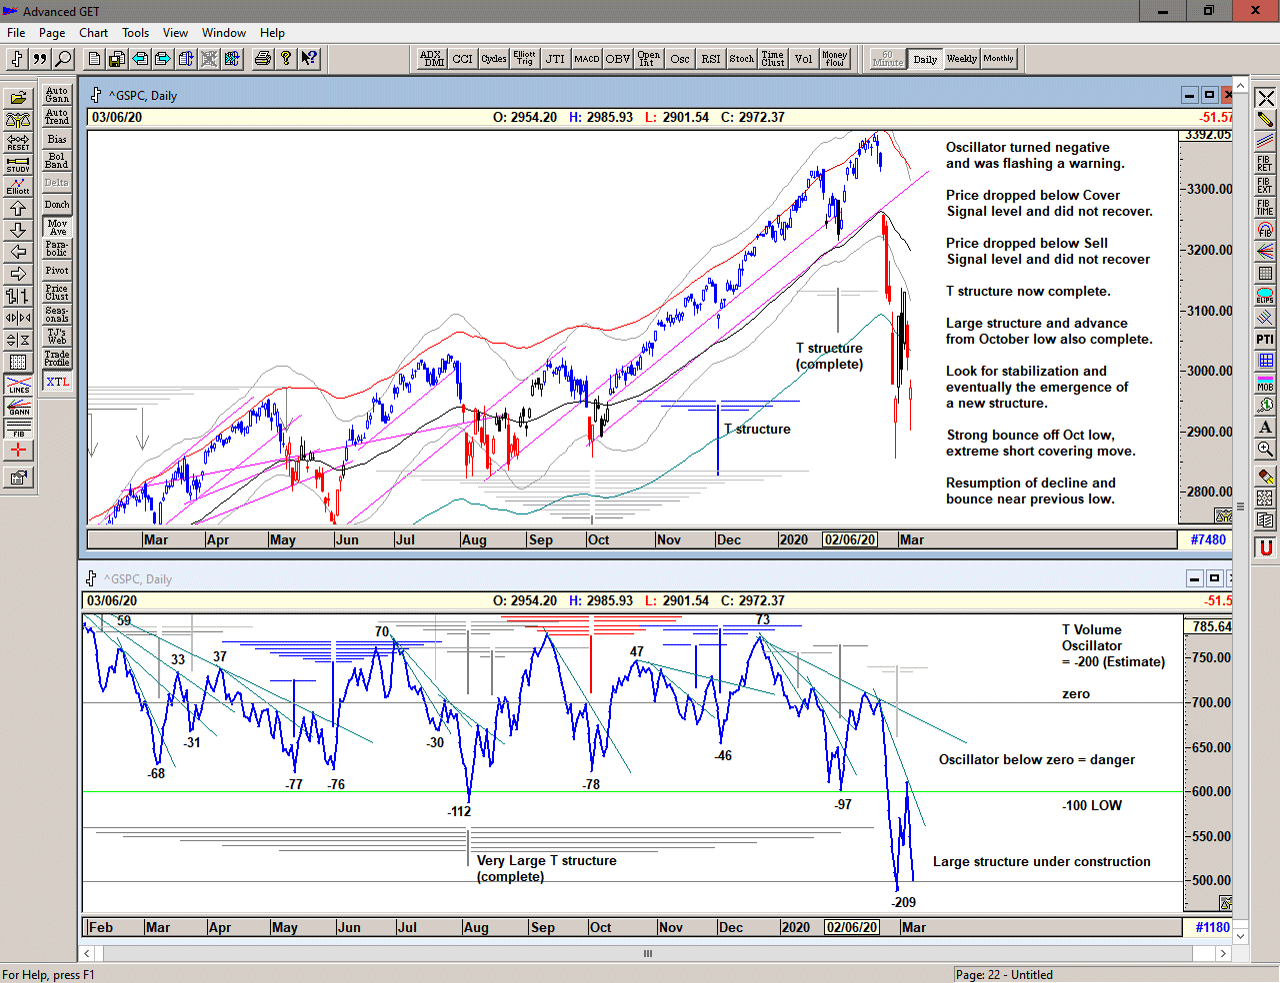
As we can see in the chart below with the T volume oscillator*, the rapid drop coincided with the completion of the very large structure which originates at the high in the oscillator on 18 January 2019 – after the buying surge from the December 2018 panic low – and centered on the previous major oscillator low on 08 May 2019.
Until 22 January 2020 the oscillator was generally behaving very well with a series of higher lows indicating strong liquidity and buying power. It was noticeable that the rapid and rather surprising recovery off the 31 January low occurred with divergences in between price and oscillator. Although price action was very strong, the market was running on vapors and hitting the key level of the upper extreme of the channel ** – a level that has triggered significant corrections.
Price dropped through the important pivot – the black line when at 3260 – and this triggered a measured move plus more through the important 200 day moving average and a Bear Market warning.
Price and oscillator bounced strongly from 2850 with a dead cat bounce as panic selling meets panic buying and this was ultimately sold into, creating the first wave up and a high in the oscillator. This starts to define a new cash build-up line ***. A movement up through a cash build up line in due course will define a new T structure that is centered at a major low or series of lows in price or oscillator or a combination of both.
In simple terms, it is the bearish phases of declining prices that ultimately produce the advances in the bullish phases.
Once a low or series of lows has been established we can then project future highs from the previous price and oscillator highs.
Currently we can see that there is a short cash build up line from the all time high, but also a longer cash build-up line from the oscillator highs on 17 January and 23 December.
As the decline has been severe, we should continue to expect strong waves of selling and buying to occur until at least some of the energy from the decline has been dissipated, and we should continue to expect very rapid changes in direction. This makes holding positions for any length of time difficult and so hedging of positions and very tight stops are recommended.
** The T volume oscillator is an indication of Buying Power within the market as a whole
** The upper extreme of the channel is an approximation of the top of the energy channel discussed by Terry Laundry
*** The cash build-up line is a declining line drawn above a series of lower highs made in the oscillator.
Save the image to your desktop to view a larger version
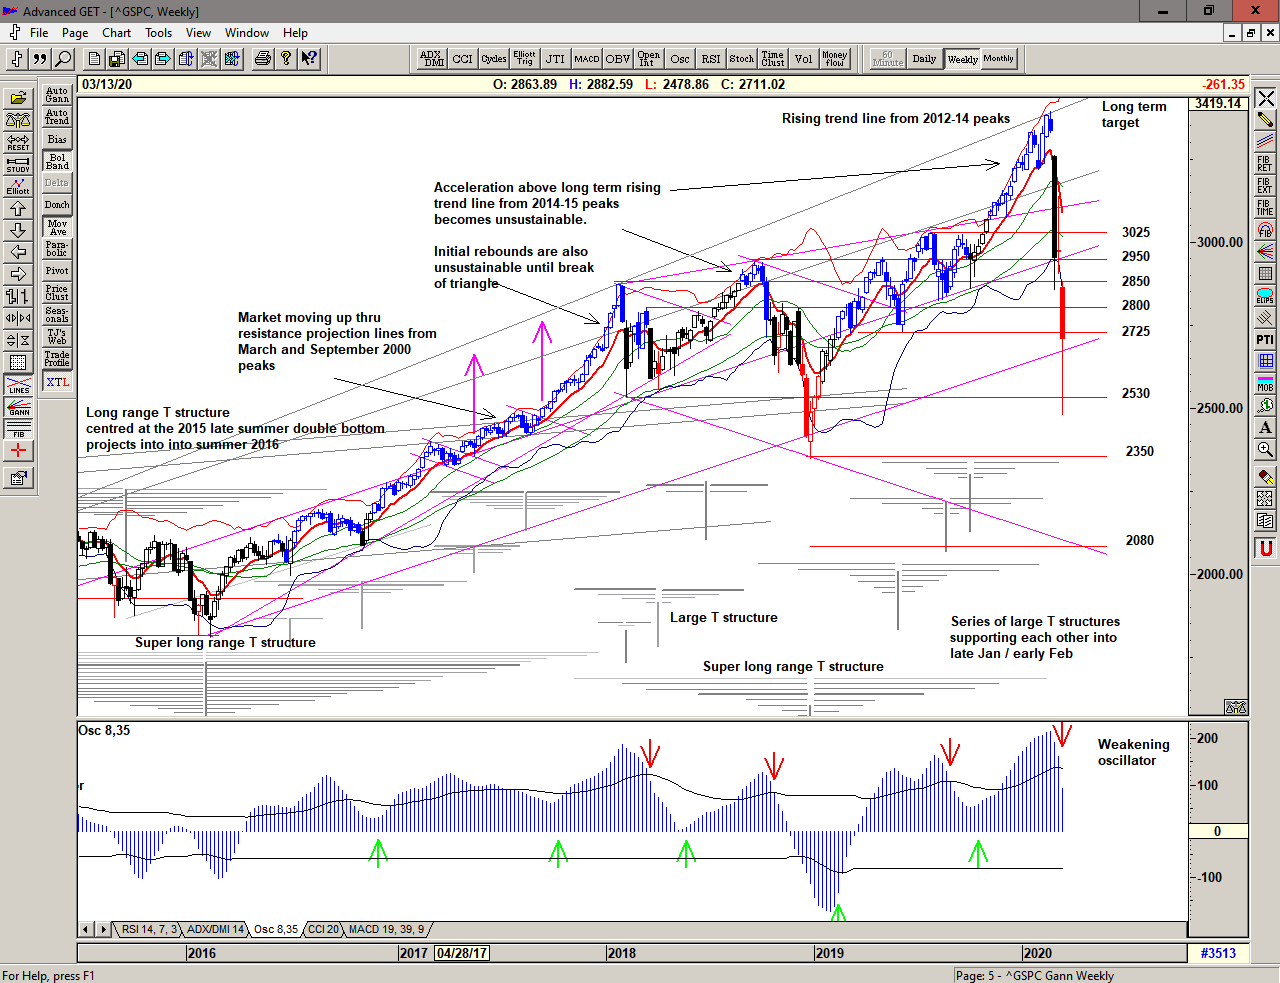
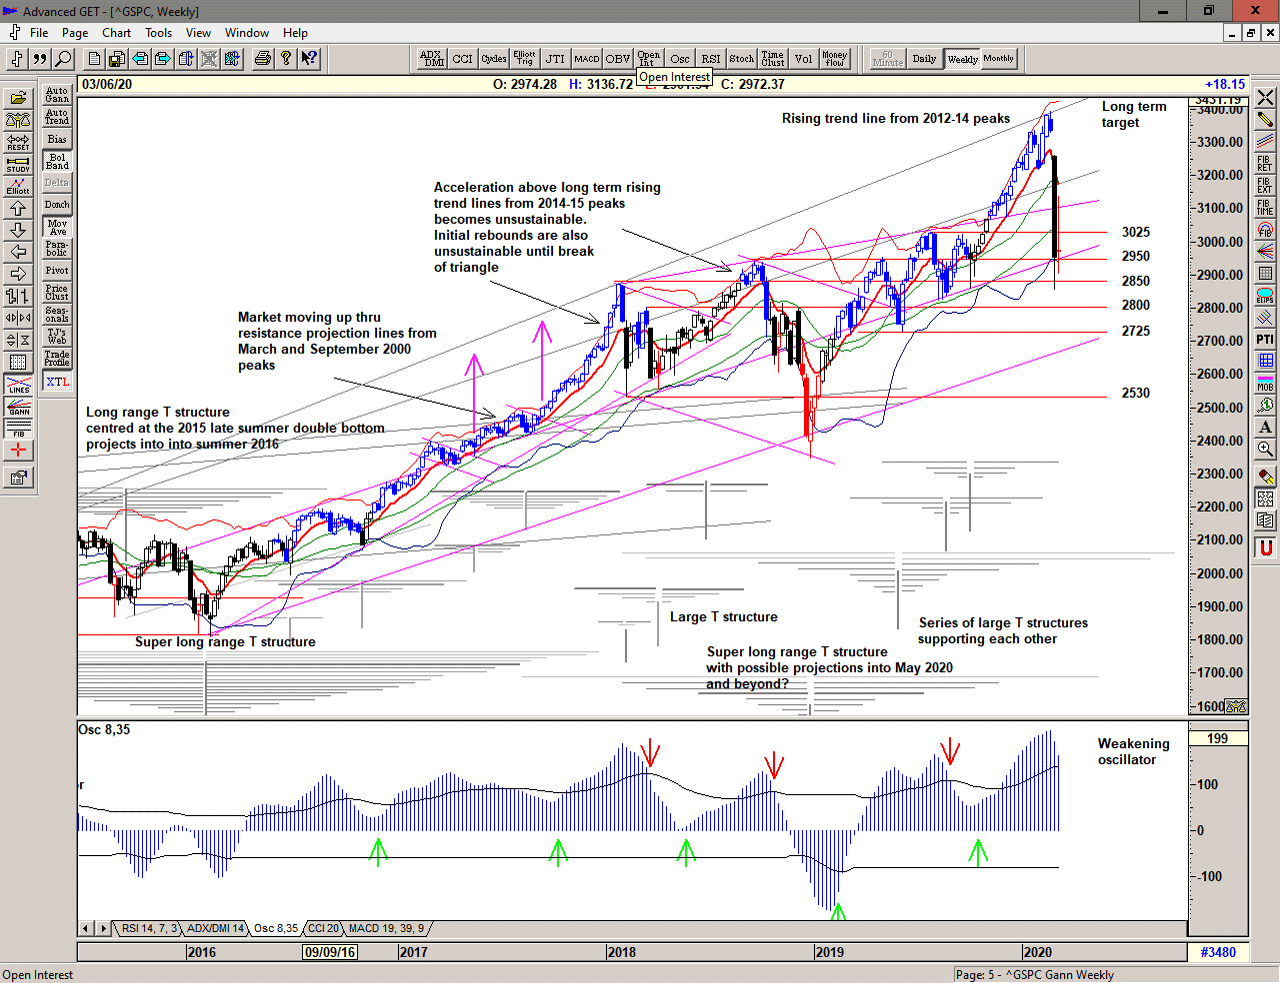
The weekly chart shows that price achieved the upper rising trend line from the 2012-14 peaks that also was also the target for the advance from Fall 2017 into the peak in January 2018.
The collapse in price took the market directly to the lower edge of the rising trend that contained all but one of the 2018-19 corrections.
As we can see, that was a good place for a bounce and arguably a sweet spot for the market, but if these levels cannot contain the selling we can certainly see the potential for much lower prices with the lower trend line in the 2700-25 area.
We should expect a similar period of instability like that which followed the January 2018 peak, like a wave breaking on a shore.
Note that significant weakness occurs below the red line (now at 3175), strength above suggesting potential recovery.
The oscillator is weakening rapidly from the high.
Save the image to your desktop to view a larger version
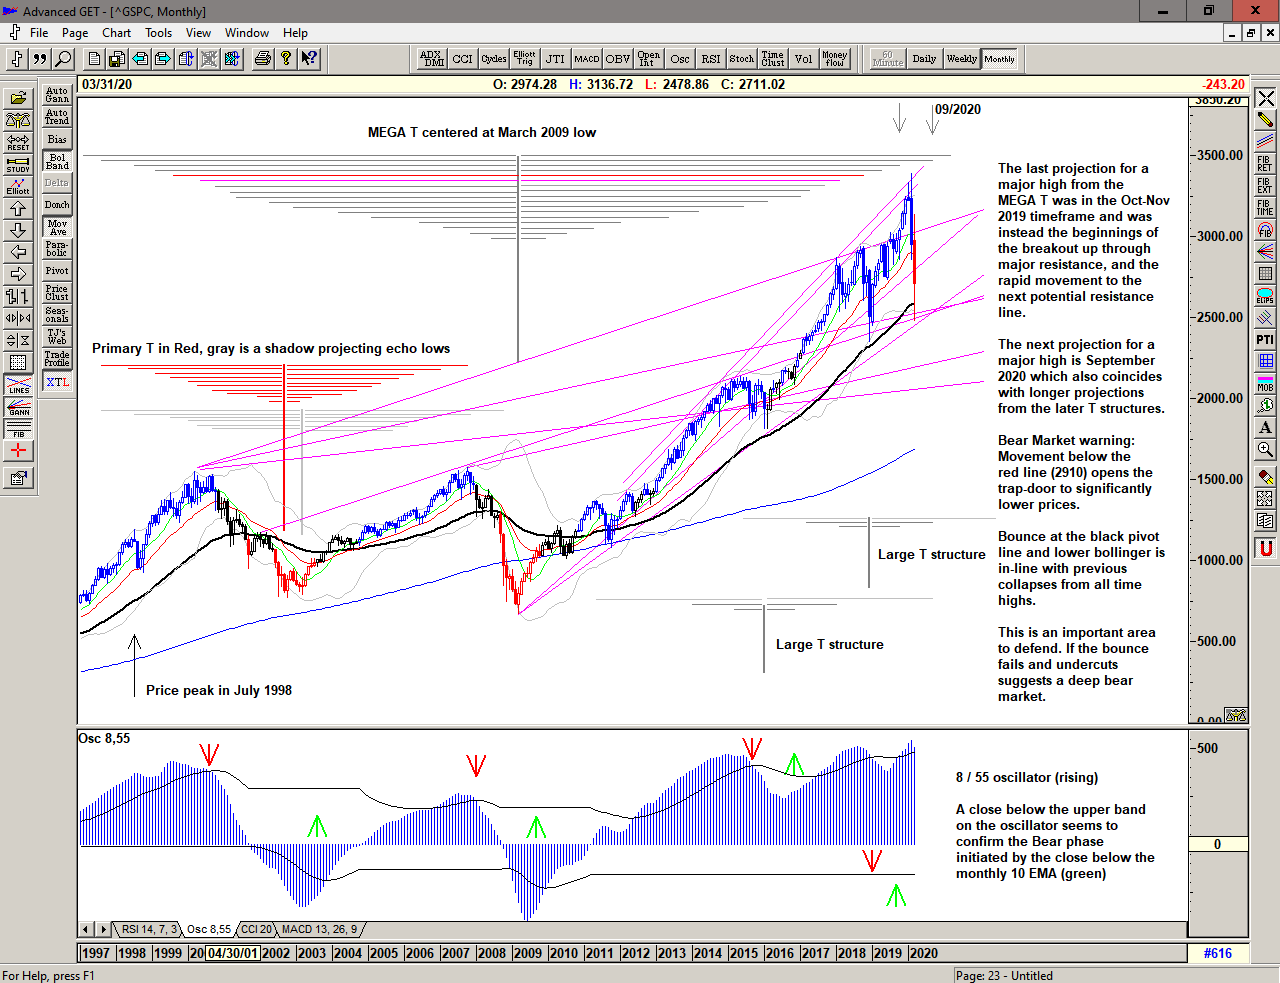
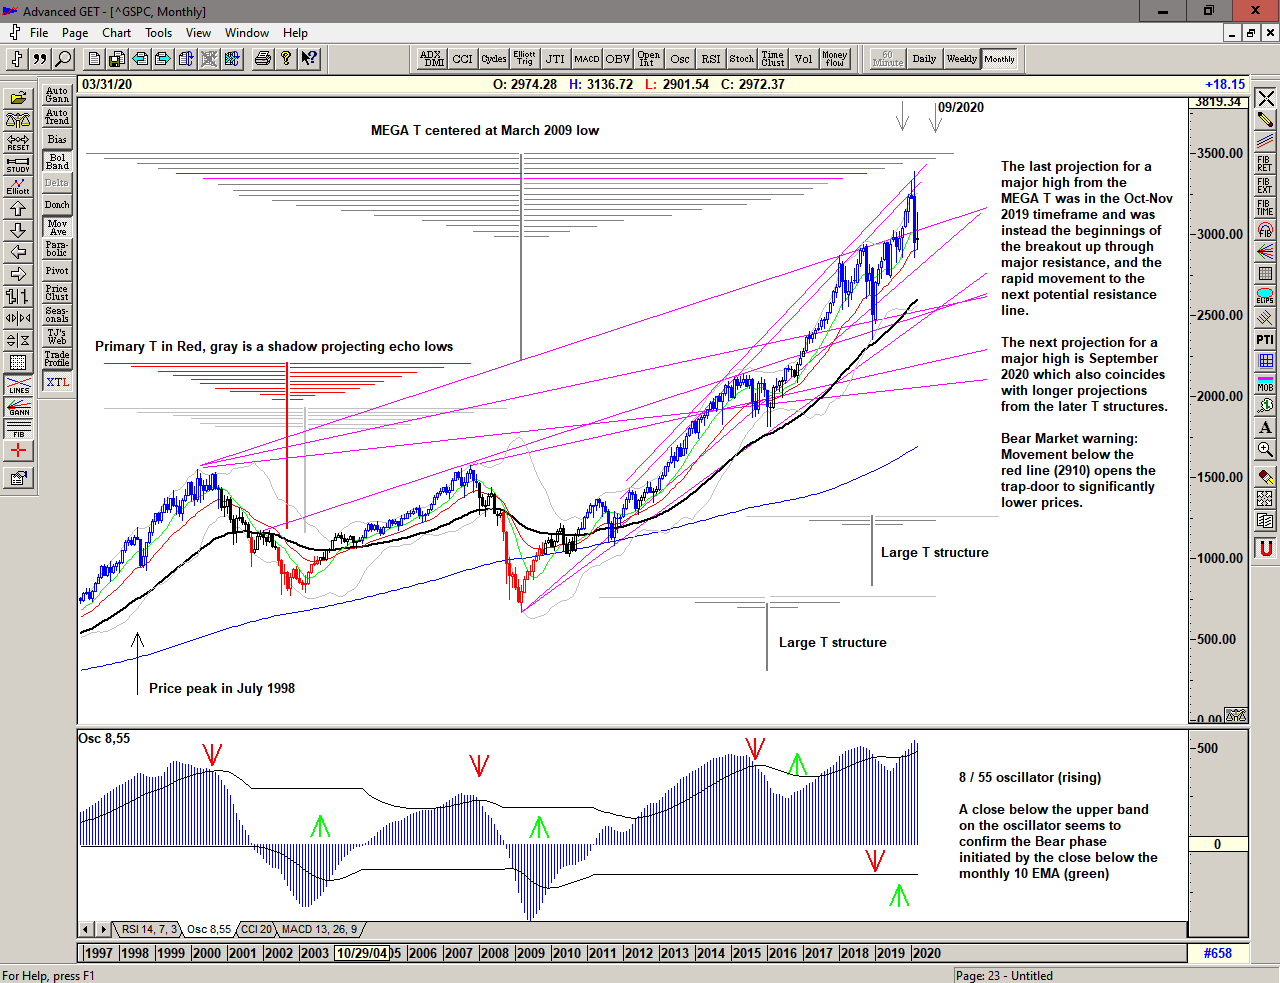
The monthly chart shows the important trend line projected from the 2000 peak and the rapid move above it once it was effectively breached leading directly to the steeper trend-line from the 2016 highs.
The February close below the green line (when at 3016) is a bearish warning similar to that in October 2018 and also in May 2019.
The red line (2910) provides strong support but a movement below opens up Pandora's Box of significantly lower prices. A movement below and a subsequent failed recovery initiates a Bear Market.
In the eventuality of further significant collapse in price, strong rising support should be found at or near the black line currently at 2600 and lower edge of the monthly bollinger band at 2560
The long term oscillator is now weakening.
Save the image to your desktop to view a larger version
2020 is bringing some fast and furious action in the market with a range that became increasingly expansive since the move above 2500. We can only assume that this will continue. This is a Brave New World.
–
Regardless of whether the market can recover or whether significant lows are ahead of us, the simplicity of the proprietary price based S/T Signalling System will continue to keep us on the correct side of the market, with price currently back on a Sell Signal since moving below 3056 on 05 March.
If you would like to learn more about using the S/T Signalling System please get in touch.
–
To receive detailed daily analysis, guidance and the updated daily Buy / Sell trigger levels being generated by the Trading the Line system before the market opens, and intra-day alerts when appropriate, please become a Member and Sign up for Alerts & Observations – includes access to Members Area, Explanatory Notes (pdf) for all of the concepts discussed, and Notes on Day Trading (pdf)
Disclaimer: This is the diary of a personal trading system, its methodology and the signals that it is producing. You are welcome to follow along but please understand that the information presented here is for educational purposes only. No recommendations are being made to buy, or sell stocks, options or futures contracts. Please consult your own financial advisor before making any investment decisions.