Midsummer Blues

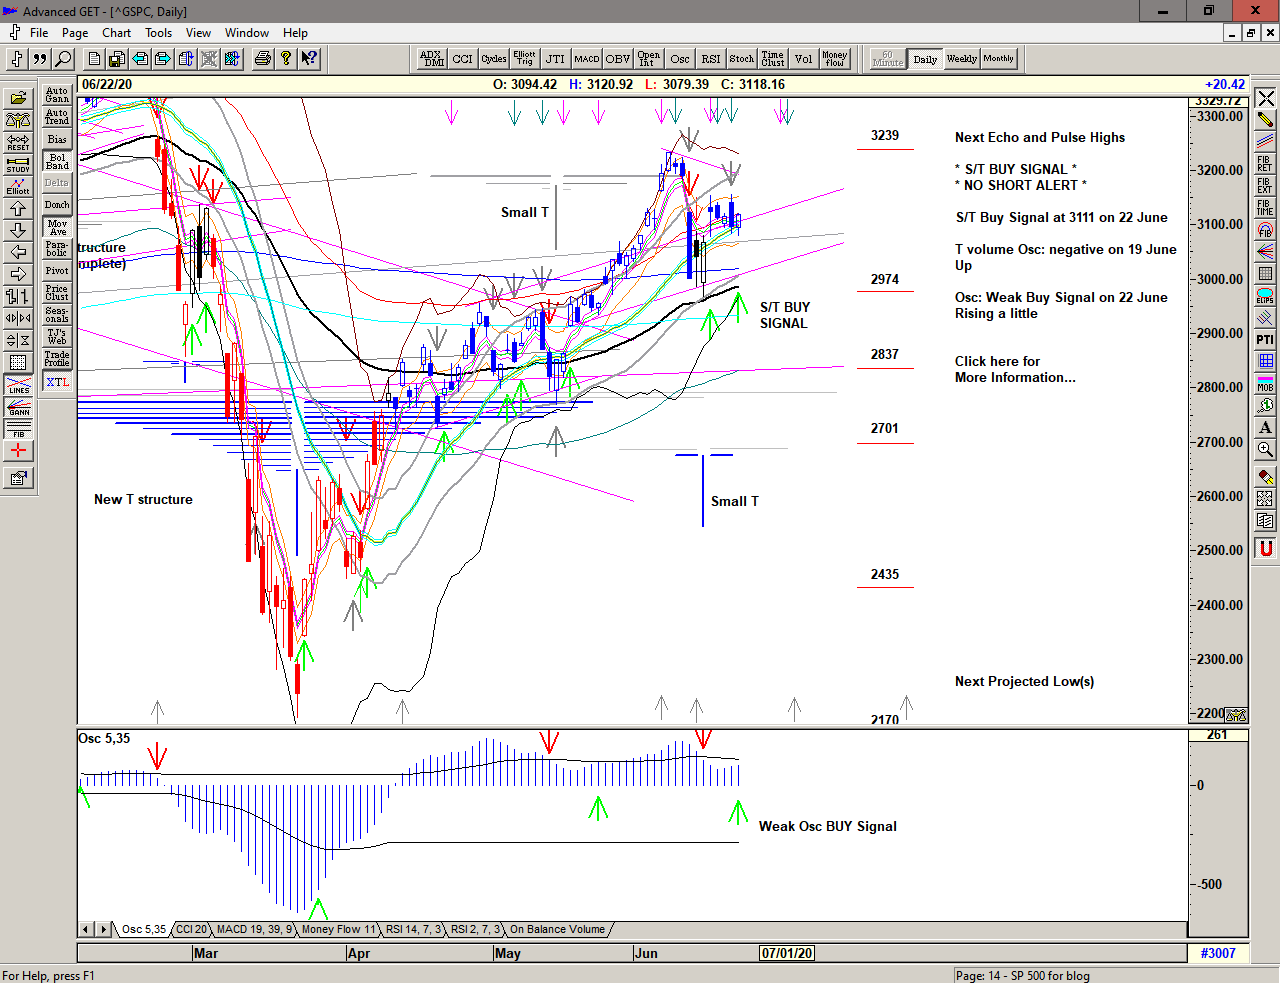
An extension of the March recovery and continuation of the major T structure into the early June high, coinciding with the important pivot at 3239, the January low, and the February gap.

Followed by another nasty drop and bounce, a small T, serious gaps ups, and heavy selling at quarterly expiration.

Volatility continues to be extremely high with very busy overnight sessions and extensive ranges. Bi-polar or tri-polar modalities. Shock and awe on a daily basis.

Daily chart of S&P 500 for 23 June 2020

Save the image to your desktop to view a larger version

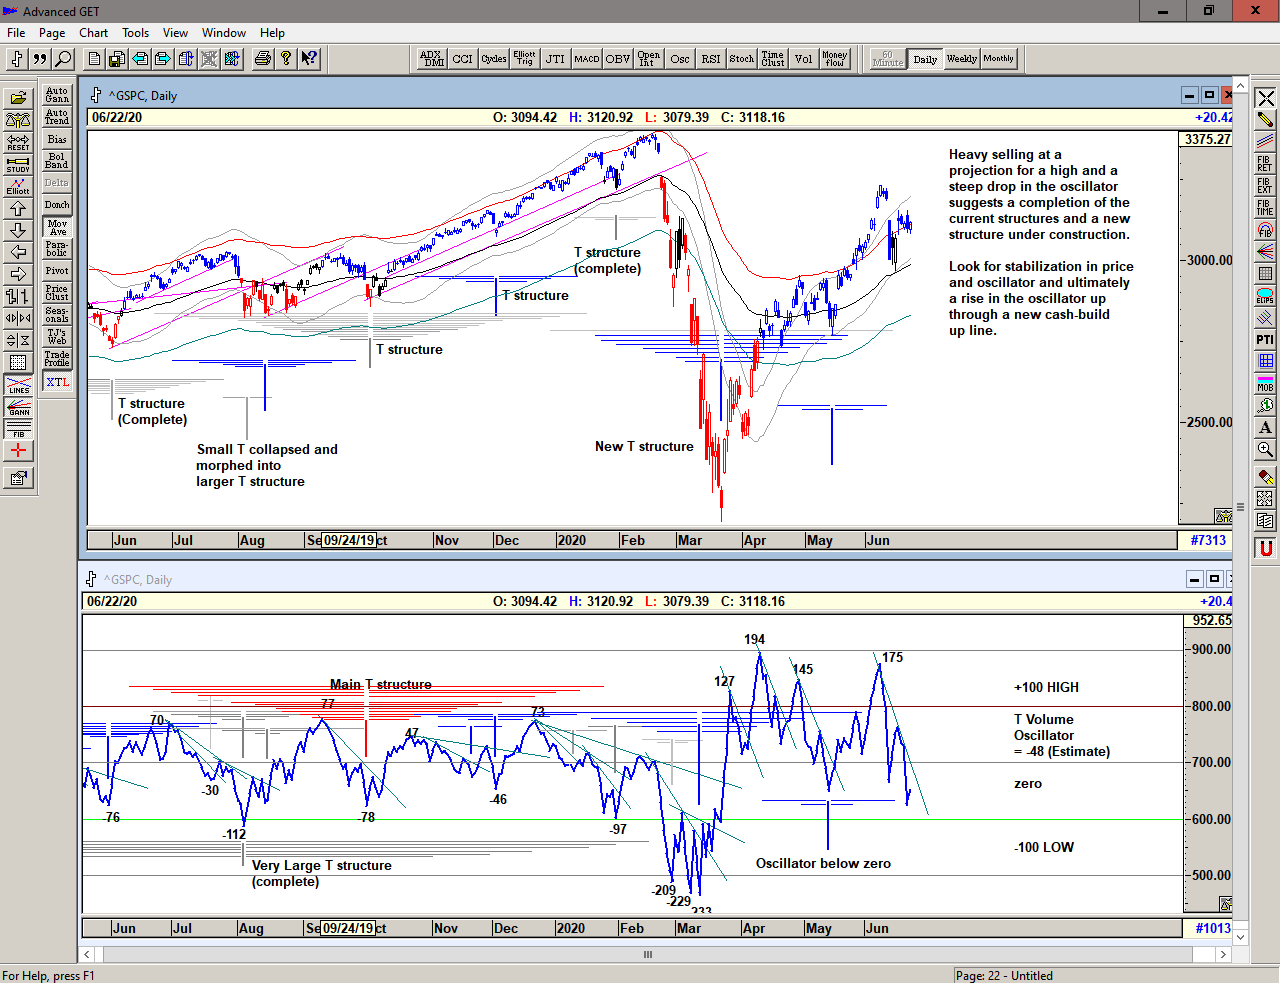
The harsh February and March decline(s) into the series of deep lows in the T volume oscillator * and the final low in price set up the waves of buying off the low into a series of momentum highs which in turn become new reference points for buying and for selling.

As we can see, the mid May decline became the center-point for another T structure projecting an extension higher from the April oscillator and momentum high into the subsequent June oscillator and momentum high.

We now see the T volume oscillator declining and falling away below zero. This is potentially a stabilization phase, building a cash-build up line **, prior to the next major advance. Whether that stabilization phase is in time or in price or both remains to be seen.

* The T volume oscillator is an indication of Buying Power within the market as a whole
** The cash build-up line is a declining line drawn above a series of lower highs made in the oscillator.

Chart of S&P 500 for 23 June 2020

Save the image to your desktop to view a larger version

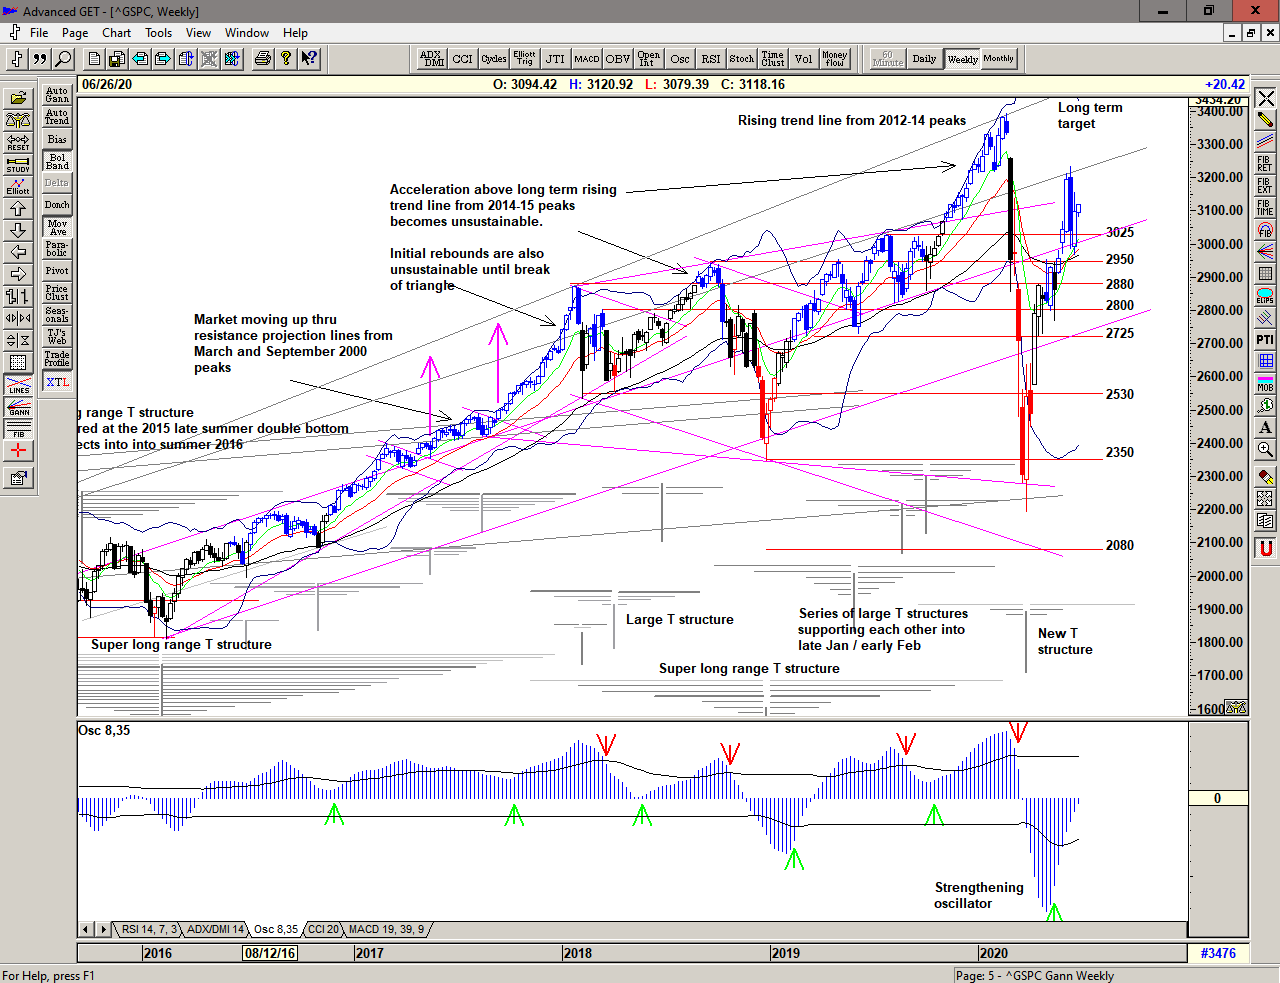
Zooming out to the weekly chart, we can see that the recovery off the March low reached the important rising trendline from the 2014-15 highs before becoming unstable and unsustainable.

The pullback from the recent high to the 2995 area is corresponding with previous examples of pullbacks from highs within the context of the larger rising channel. A more severe decline would perhaps target the lower edge of the channel again around 2800.

For now, 2950 looks like strong support with rising averages below.

Weekly Chart of S&P 500 for 23 June 2020

Save the image to your desktop to view a larger version

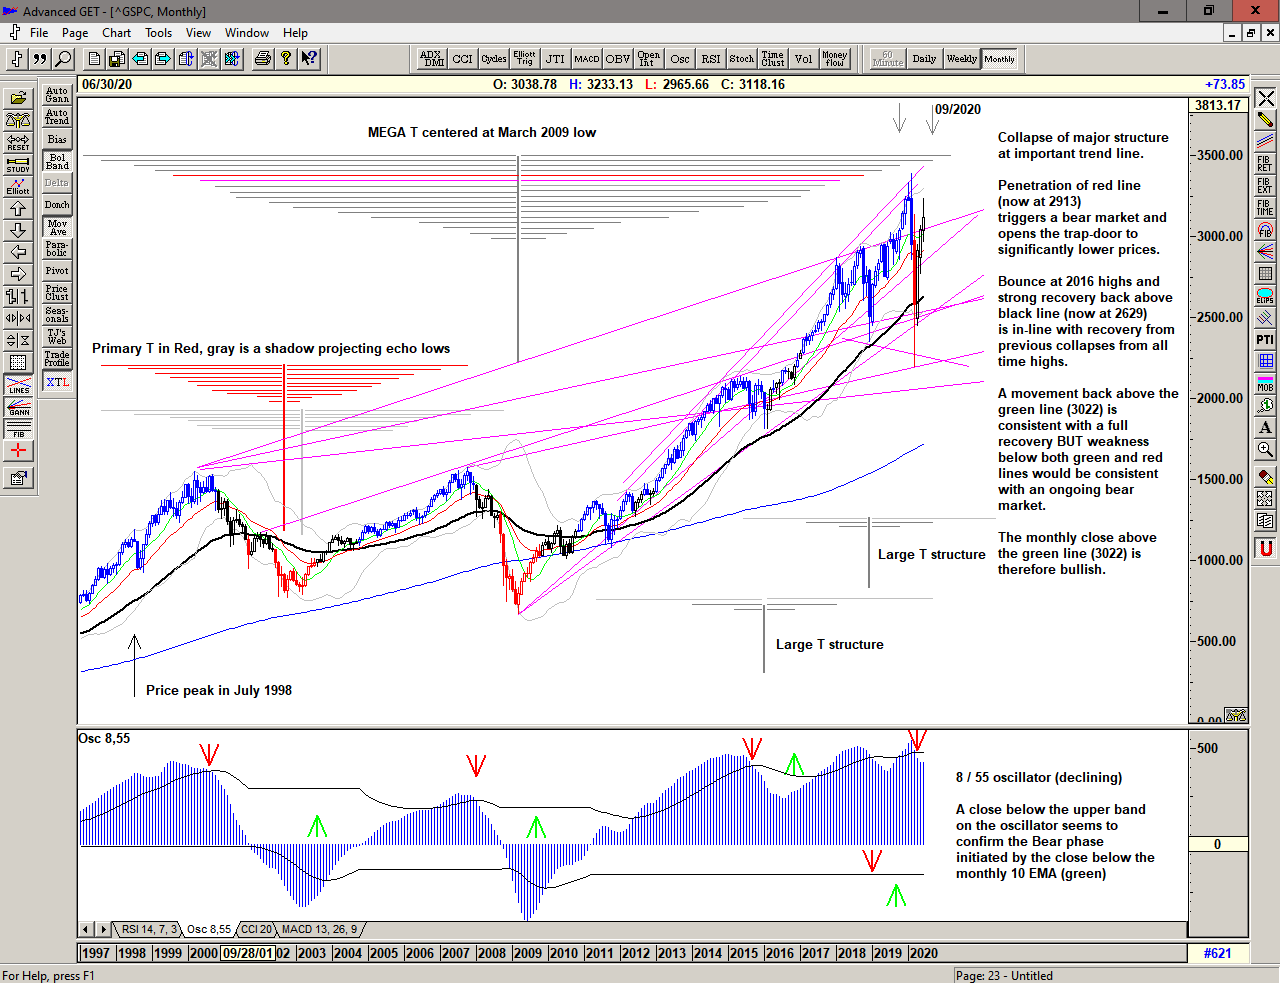
The monthly chart shows the continuation above the green line – a bullish support line – but the high near the January low – resistance for now.

The green line above red line indicates strong ongoing support and bullish action. Penetration of the red line would be a Bear Market signal. A Bull market finds support at the green line. Price back below these lines would indicate an ongoing problem.

If the market is to enter a severe Bear Market we can see that there is significant downside below 2600, but for now the market is endeavouring to avoid that outcome.

The long term oscillator looks like it may be strengthening again.

Monthly chart of S&P 500 fo 23 June 2020

Save the image to your desktop to view a larger version

2020 is bringing some fast and furious action in the market with a range that became increasingly expansive since the move above 2500 in 2017. We can only assume that this will continue. This is a Brave New World.

Regardless of whether the market can recover or whether further significant lows are ahead of us, the simplicity of the proprietary price based S/T Signalling System will continue to keep us on the correct side of the market, with price currently back on a Buy Signal since moving above 3111 on 22 June 2020.

If you would like to learn more about using the S/T Signalling System please get in touch.

To receive detailed daily analysis, guidance and the updated daily Buy / Sell trigger levels being generated by the Trading the Line system before the market opens, and intra-day alerts when appropriate, please become a Member and Sign up for Alerts & Observations – includes access to Members Area, Explanatory Notes (pdf) for all of the concepts discussed, and Notes on Day Trading (pdf)

Disclaimer: This is the diary of a personal trading system, its methodology and the signals that it is producing. You are welcome to follow along but please understand that the information presented here is for educational purposes only. No recommendations are being made to buy, or sell stocks, options or futures contracts. Please consult your own financial advisor before making any investment decisions.


Trail

Overnight strength meets heavy selling and the market gives up 3100, in volatile and bearish action.

A Cover Signal at 3099, confirmed at the close.

Chart of S&P 500 for 22 June 2020

To receive detailed daily analysis, guidance and the updated daily Buy / Sell trigger levels being generated by the Trading the Line system before the market opens, and intra-day alerts when appropriate, please become a Member and Sign up for Alerts & Observations – includes access to Members Area, Explanatory Notes (pdf) for all of the concepts discussed, and Notes on Day Trading (pdf)

Disclaimer: This is the diary of a personal trading system, its methodology and the signals that it is producing. You are welcome to follow along but please understand that the information presented here is for educational purposes only. No recommendations are being made to buy, or sell stocks, options or futures contracts. Please consult your own financial advisor before making any investment decisions.


Creed

Holding up above the Buy Signal line in choppy action.

Chart of S&P 500 for 19 June 2020

To receive detailed daily analysis, guidance and the updated daily Buy / Sell trigger levels being generated by the Trading the Line system before the market opens, and intra-day alerts when appropriate, please become a Member and Sign up for Alerts & Observations – includes access to Members Area, Explanatory Notes (pdf) for all of the concepts discussed, and Notes on Day Trading (pdf)

Disclaimer: This is the diary of a personal trading system, its methodology and the signals that it is producing. You are welcome to follow along but please understand that the information presented here is for educational purposes only. No recommendations are being made to buy, or sell stocks, options or futures contracts. Please consult your own financial advisor before making any investment decisions.

Ride

Another wild day with a push up into 3140 before declining into the close.

Above the Buy Signal level but looking a bit slippery.

Chart of S&P 500 for 18 June 2020

To receive detailed daily analysis, guidance and the updated daily Buy / Sell trigger levels being generated by the Trading the Line system before the market opens, and intra-day alerts when appropriate, please become a Member and Sign up for Alerts & Observations – includes access to Members Area, Explanatory Notes (pdf) for all of the concepts discussed, and Notes on Day Trading (pdf)

Disclaimer: This is the diary of a personal trading system, its methodology and the signals that it is producing. You are welcome to follow along but please understand that the information presented here is for educational purposes only. No recommendations are being made to buy, or sell stocks, options or futures contracts. Please consult your own financial advisor before making any investment decisions.

Boxer

A wild day with another huge overnight move up, a sharp decline into the gap and a Buy Signal above 3092 at 3100.

Chart of S&P 500 for 17 June 2020

To receive detailed daily analysis, guidance and the updated daily Buy / Sell trigger levels being generated by the Trading the Line system before the market opens, and intra-day alerts when appropriate, please become a Member and Sign up for Alerts & Observations – includes access to Members Area, Explanatory Notes (pdf) for all of the concepts discussed, and Notes on Day Trading (pdf)

Disclaimer: This is the diary of a personal trading system, its methodology and the signals that it is producing. You are welcome to follow along but please understand that the information presented here is for educational purposes only. No recommendations are being made to buy, or sell stocks, options or futures contracts. Please consult your own financial advisor before making any investment decisions.

Ulysses

A reversal and recovery from heavy overnight selling is bought back up with strong buying throughout the day.

Chart of S&P 500 for 16 June 2020

To receive detailed daily analysis, guidance and the updated daily Buy / Sell trigger levels being generated by the Trading the Line system before the market opens, and intra-day alerts when appropriate, please become a Member and Sign up for Alerts & Observations – includes access to Members Area, Explanatory Notes (pdf) for all of the concepts discussed, and Notes on Day Trading (pdf)

Disclaimer: This is the diary of a personal trading system, its methodology and the signals that it is producing. You are welcome to follow along but please understand that the information presented here is for educational purposes only. No recommendations are being made to buy, or sell stocks, options or futures contracts. Please consult your own financial advisor before making any investment decisions.

Exsurge

An overnight recovery meets heavy selling and 2 sell signals with strong bounces as the market defends 3000.

A Cover Signal for now and recommending tight trailing stops in either direction.

Chart of S&P 500 for 15 June 2020

To receive detailed daily analysis, guidance and the updated daily Buy / Sell trigger levels being generated by the Trading the Line system before the market opens, and intra-day alerts when appropriate, please become a Member and Sign up for Alerts & Observations – includes access to Members Area, Explanatory Notes (pdf) for all of the concepts discussed, and Notes on Day Trading (pdf)

Disclaimer: This is the diary of a personal trading system, its methodology and the signals that it is producing. You are welcome to follow along but please understand that the information presented here is for educational purposes only. No recommendations are being made to buy, or sell stocks, options or futures contracts. Please consult your own financial advisor before making any investment decisions.