Firenzuola

A choppy inside day near the high with a look at 4415 after the Fed announcement.

Buy Signal continues.

Chart of S&P 500 for 29 July 2021

To receive detailed daily analysis, guidance and the updated daily Buy / Sell trigger levels being generated by the Trading the Line system before the market opens, and intra-day alerts when appropriate, please become a Member and Sign up for Alerts & Observations – includes access to Members Area, Explanatory Notes (pdf) for all of the concepts discussed, and Notes on Day Trading (pdf)

Disclaimer: This is the diary of a personal trading system, its methodology and the signals that it is producing. You are welcome to follow along but please understand that the information presented here is for educational purposes only. No recommendations are being made to buy, or sell stocks, options or futures contracts. Please consult your own financial advisor before making any investment decisions.


Cascina

At a projection for a high, the market is met with persistent selling down to a touch of the Buy / Cover Signal line before a strong recovery in afternoon action.

Buy Signal continues for now. Expect more volatility today.

Chart of S&P 500 for 28 July 2021

To receive detailed daily analysis, guidance and the updated daily Buy / Sell trigger levels being generated by the Trading the Line system before the market opens, and intra-day alerts when appropriate, please become a Member and Sign up for Alerts & Observations – includes access to Members Area, Explanatory Notes (pdf) for all of the concepts discussed, and Notes on Day Trading (pdf)

Disclaimer: This is the diary of a personal trading system, its methodology and the signals that it is producing. You are welcome to follow along but please understand that the information presented here is for educational purposes only. No recommendations are being made to buy, or sell stocks, options or futures contracts. Please consult your own financial advisor before making any investment decisions.


Bapheus

Market holds above 4400 with a choppy morning session before continuing higher, pushing up into 4420, grinding sideways and up into 4422.

Buy Signal continues.

Chart of S&P 500 for 27 July 2021

To receive detailed daily analysis, guidance and the updated daily Buy / Sell trigger levels being generated by the Trading the Line system before the market opens, and intra-day alerts when appropriate, please become a Member and Sign up for Alerts & Observations – includes access to Members Area, Explanatory Notes (pdf) for all of the concepts discussed, and Notes on Day Trading (pdf)

Disclaimer: This is the diary of a personal trading system, its methodology and the signals that it is producing. You are welcome to follow along but please understand that the information presented here is for educational purposes only. No recommendations are being made to buy, or sell stocks, options or futures contracts. Please consult your own financial advisor before making any investment decisions.


Winds of Fury

All numbers refer to SPX

As a young boy, daddy used to tell me stories
"Do your thing my son, the world is yours
The winds of fury will lead to paths of glory
Take it in your stride my son, the world is yours"

Ian Brown, The World is Yours, 2007

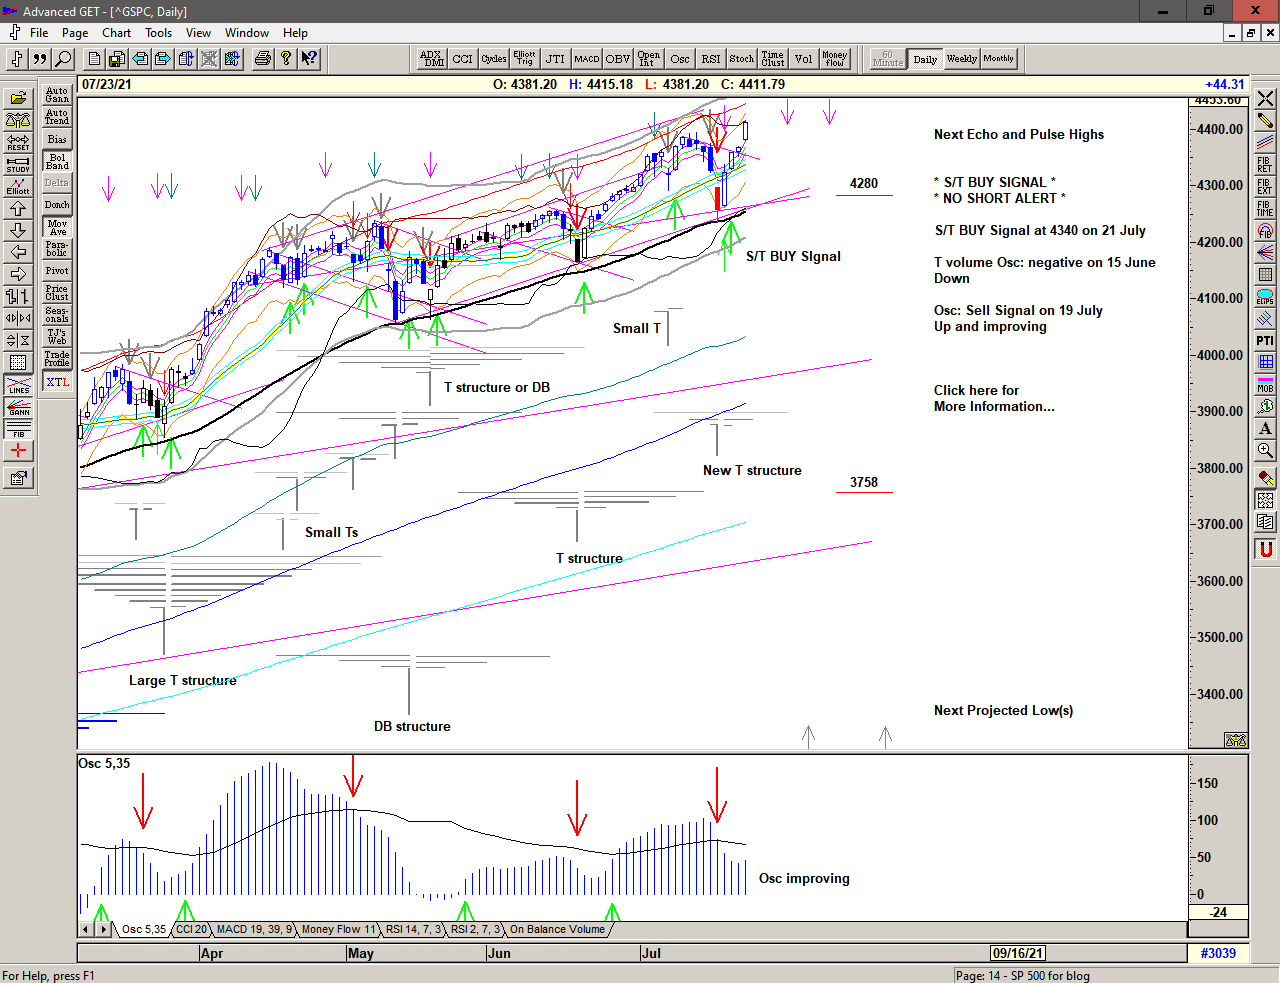
From strong selling on Monday back to new all time highs on Friday with a four day thrust higher.

The winds of fury will lead to paths of glory…

Daily chart of S&P 500 for 26 July 2021

Save the image to your desktop to view a larger version

A gap down well below the Sell Signal level (4300) on 19 July making short entry difficult and high risk is quickly reversed with an S/T Buy Signal on 20 July at 4331 (unconfirmed at the close) and a continuation higher on 21 July above 4332 making a second S/T Buy Signal at 4340.

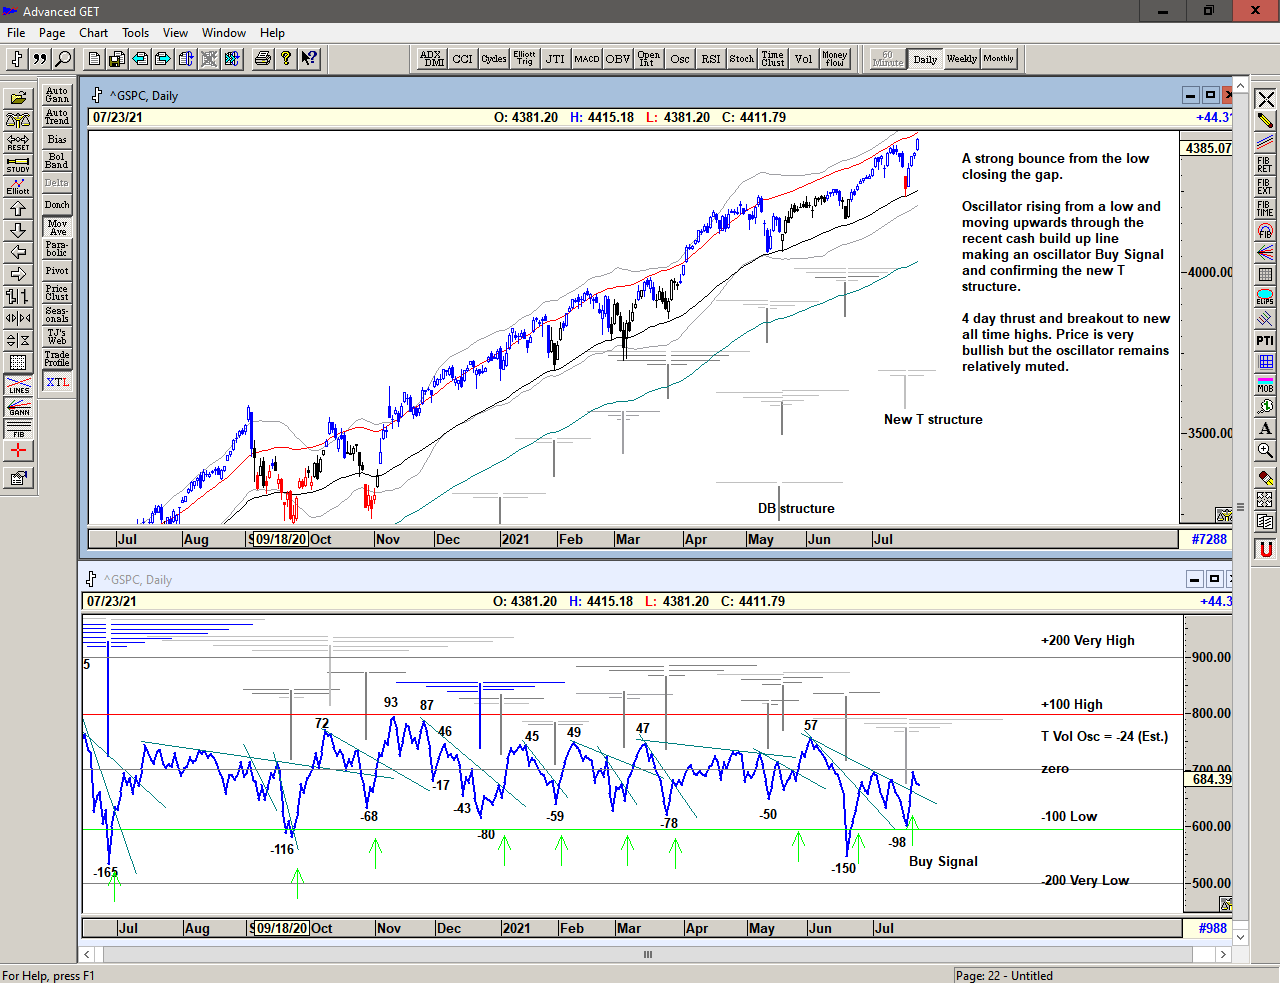
A fast move higher, making new all time highs with an impressive and very rapid move from low to new high. Some relative weakness in the oscillators but it's really difficult to argue with the price action.

Chart of S&P 500 with T volume oscillator for 26 July 2021

Save the image to your desktop to view a larger version

The T volume oscillator 1 made a Buy Signal on 21 July with a rise upwards through the cash build up line 2 confirming the new T structure emerging from the recent low with projections for highs from the previous oscillator and price highs for late July and early August, perhaps beyond.

1 The T volume oscillator is an indication of Buying Power within the market as a whole
2 The cash build-up line is a declining line drawn above a series of lower highs made in the oscillator.

Weekly chart of S&P 500 for 26 July 2021

Save the image to your desktop to view a larger version

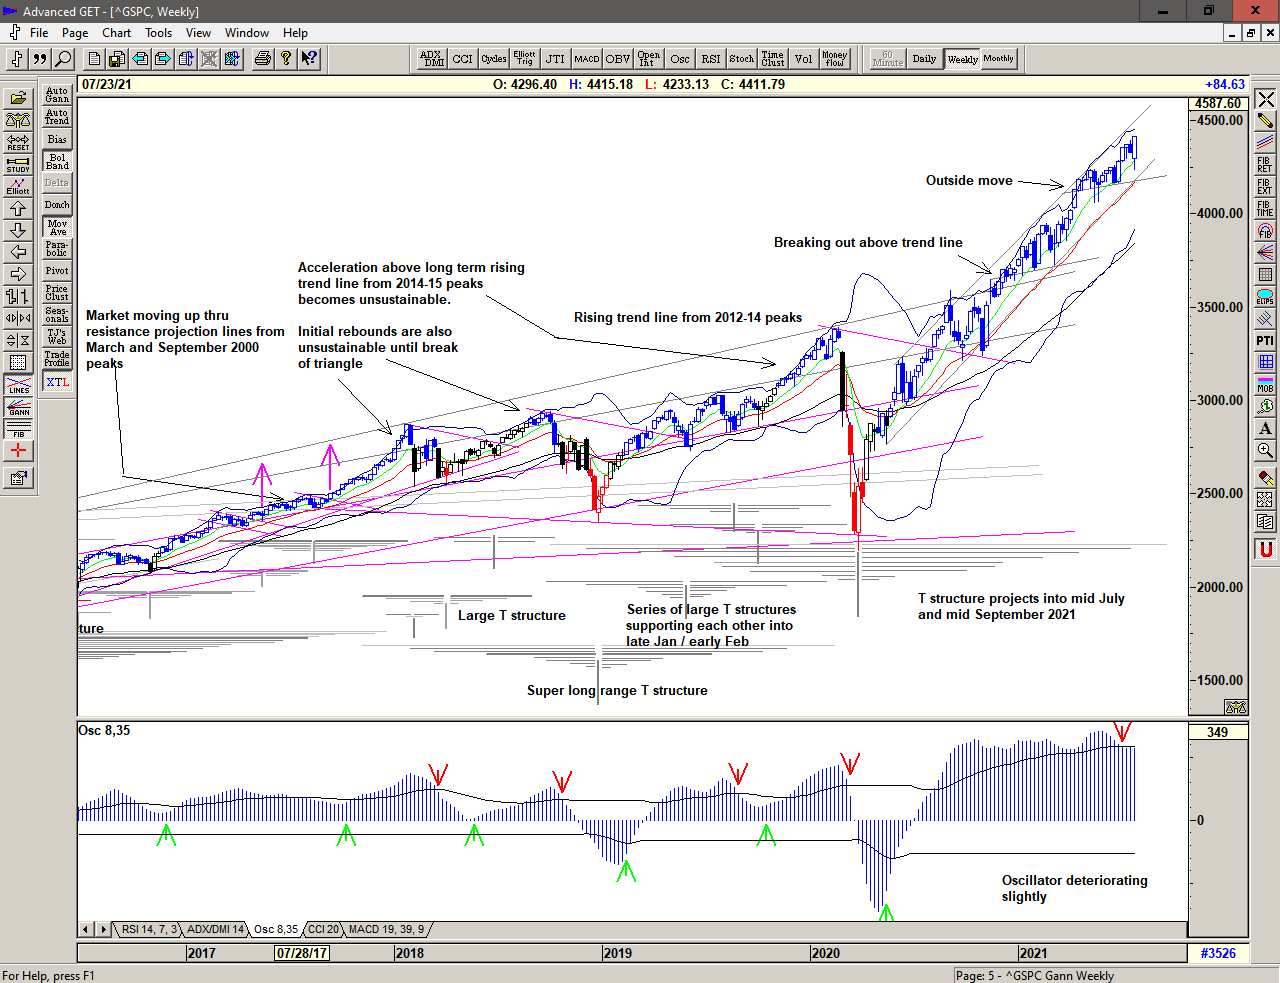
In the weekly chart above, we can see that price continues to be strong within the rising channel established over the past year, The oscillator was declining and flashing a warning of the expected weakness mid July but this appears to have been quickly resolved with the rapid reversal from 4233, which now looks like important support.

The large structure, centered at the March 2020 low projected strength into Mid July and now possibly into Mid September.

Monthly chart of S&P 500 for 26 July 2021

Save the image to your desktop to view a larger version

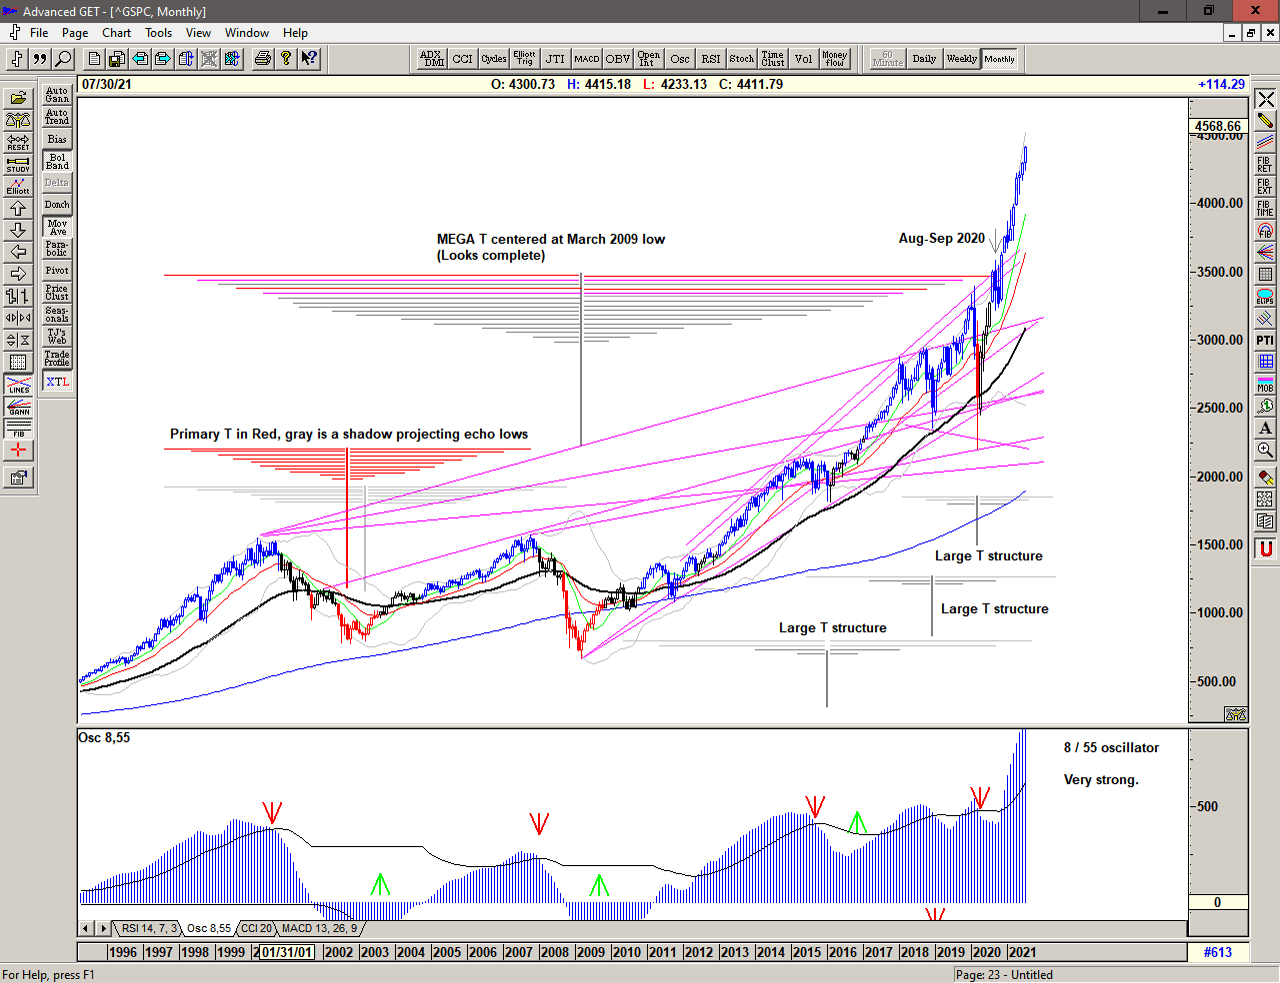
The monthly chart continues to look excessive but the market continues higher beyond the projection for a major high from the Mega T structure, which now looks like it completed with the declines in February 2020 and September 2020.

The current large structures project highs for August and/or for September 2021 and possibly longer into April 2022.

2021 continues with a range that has become increasingly expansive since the move above 2500. With price above 4400 we can only assume that this will continue. This is a Brave New World and we should trade accordingly.

Regardless of whether the market can continue higher or whether significant lows are ahead of us, the simplicity of the proprietary price based S/T Signalling System will continue to keep us on the correct side of the market, with price currently back on a Buy Signal since moving above 4332-40 on 21 July 2021.

If you would like to learn more about using the S/T Signalling System please get in touch.

To receive detailed daily analysis, guidance and the updated daily Buy / Sell trigger levels being generated by the Trading the Line system before the market opens, and intra-day alerts when appropriate, please become a Member and Sign up for Alerts & Observations – includes access to Members Area, Explanatory Notes (pdf) for all of the concepts discussed, and Notes on Day Trading (pdf)

Disclaimer: This is the diary of a personal trading system, its methodology and the signals that it is producing. You are welcome to follow along but please understand that the information presented here is for educational purposes only. No recommendations are being made to buy, or sell stocks, options or futures contracts. Please consult your own financial advisor before making any investment decisions.


Pliska

Market continues to grind higher after a choppy morning session.

Buy Signal continues.

Chart of S&P 500 for 23 July 2021

To receive detailed daily analysis, guidance and the updated daily Buy / Sell trigger levels being generated by the Trading the Line system before the market opens, and intra-day alerts when appropriate, please become a Member and Sign up for Alerts & Observations – includes access to Members Area, Explanatory Notes (pdf) for all of the concepts discussed, and Notes on Day Trading (pdf)

Disclaimer: This is the diary of a personal trading system, its methodology and the signals that it is producing. You are welcome to follow along but please understand that the information presented here is for educational purposes only. No recommendations are being made to buy, or sell stocks, options or futures contracts. Please consult your own financial advisor before making any investment decisions.


Anzen

Market gaps up above the Buy Signal line and continues higher with shallow dips and strength into the close.

An S/T Buy Signal at 4340.

Chart of S&P 500 for 22 July 2021

To receive detailed daily analysis, guidance and the updated daily Buy / Sell trigger levels being generated by the Trading the Line system before the market opens, and intra-day alerts when appropriate, please become a Member and Sign up for Alerts & Observations – includes access to Members Area, Explanatory Notes (pdf) for all of the concepts discussed, and Notes on Day Trading (pdf)

Disclaimer: This is the diary of a personal trading system, its methodology and the signals that it is producing. You are welcome to follow along but please understand that the information presented here is for educational purposes only. No recommendations are being made to buy, or sell stocks, options or futures contracts. Please consult your own financial advisor before making any investment decisions.


Kazan

Market gaps up and is met with strong buying quickly cancelling the previous Sell Signal at 4300 and advancing into highs at 4333 and 4336, briefly triggering an S/T Buy Signal above 4331 but dropping back into the close.

An impressive recovery but not quite enough to confirm an S/T Buy Signal.

Chart of S&P 500 for 21 July 2021

To receive detailed daily analysis, guidance and the updated daily Buy / Sell trigger levels being generated by the Trading the Line system before the market opens, and intra-day alerts when appropriate, please become a Member and Sign up for Alerts & Observations – includes access to Members Area, Explanatory Notes (pdf) for all of the concepts discussed, and Notes on Day Trading (pdf)

Disclaimer: This is the diary of a personal trading system, its methodology and the signals that it is producing. You are welcome to follow along but please understand that the information presented here is for educational purposes only. No recommendations are being made to buy, or sell stocks, options or futures contracts. Please consult your own financial advisor before making any investment decisions.


Market closing at 4323

Market gaps up and is met with strong buying quickly cancelling the previous Sell Signal at 4300 and advancing into highs at 4333 and 4336, briefly triggering an S/T Buy Signal above 4331 but dropping back into the close.

An impressive recovery but not quite enough to confirm an S/T Buy Signal.

Titus

A decisive drop, gaping down well below the Sell Signal line at 4300 and continuing quickly lower, finding initial support at 4243 for a bounce to 4265, and then continuing lower into 4234 before stabilizing and recovering a little into the close.

Sell Signal active.

Chart of S&P 500 for 20 July 2021

To receive detailed daily analysis, guidance and the updated daily Buy / Sell trigger levels being generated by the Trading the Line system before the market opens, and intra-day alerts when appropriate, please become a Member and Sign up for Alerts & Observations – includes access to Members Area, Explanatory Notes (pdf) for all of the concepts discussed, and Notes on Day Trading (pdf)

Disclaimer: This is the diary of a personal trading system, its methodology and the signals that it is producing. You are welcome to follow along but please understand that the information presented here is for educational purposes only. No recommendations are being made to buy, or sell stocks, options or futures contracts. Please consult your own financial advisor before making any investment decisions.