Lomman

Selling from the open and a decline into 3590 before some strong buying back to 3630.

Sell Signal continues.

Chart of S&P 500 for 11 October 2022

Sign up here for daily analysis with the updated Buy / Sell trigger levels being generated by the Trading the Line S/T System before the market opens. Trading the Line Membership – includes Explanatory Notes (pdf), Notes on Day Trading (pdf) and End of Day Snapshot of Day Trading Entries.

Disclaimer: This is the diary of a personal trading system, its methodology and the signals that it is producing. You are welcome to follow along but please understand that the information presented here is for educational purposes only. No recommendations are being made to buy, or sell stocks, options or futures contracts. Please consult your own financial advisor before making any investment decisions.


Karbala

All numbers refer to SPX

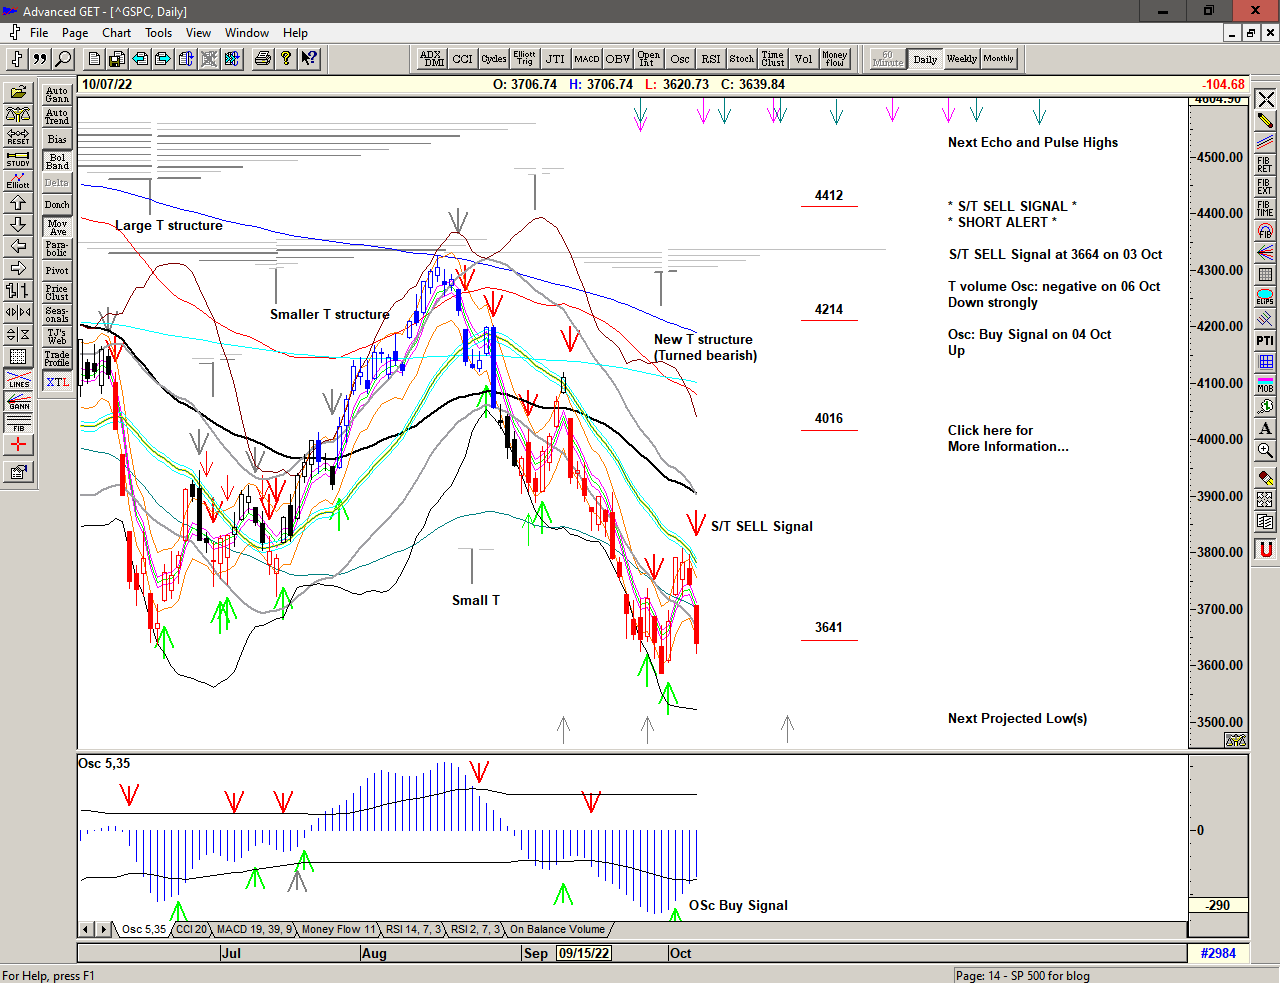
A quick Buy Signal with the early October bounce from 3585 is met with warnings of over-exuberance and subsequently fails with a rapid decline back towards the low, triggering another Sell Signal below 3711.

Daily chart of S&P 500 for 10 October 2022

Save the image to your desktop to view a larger version

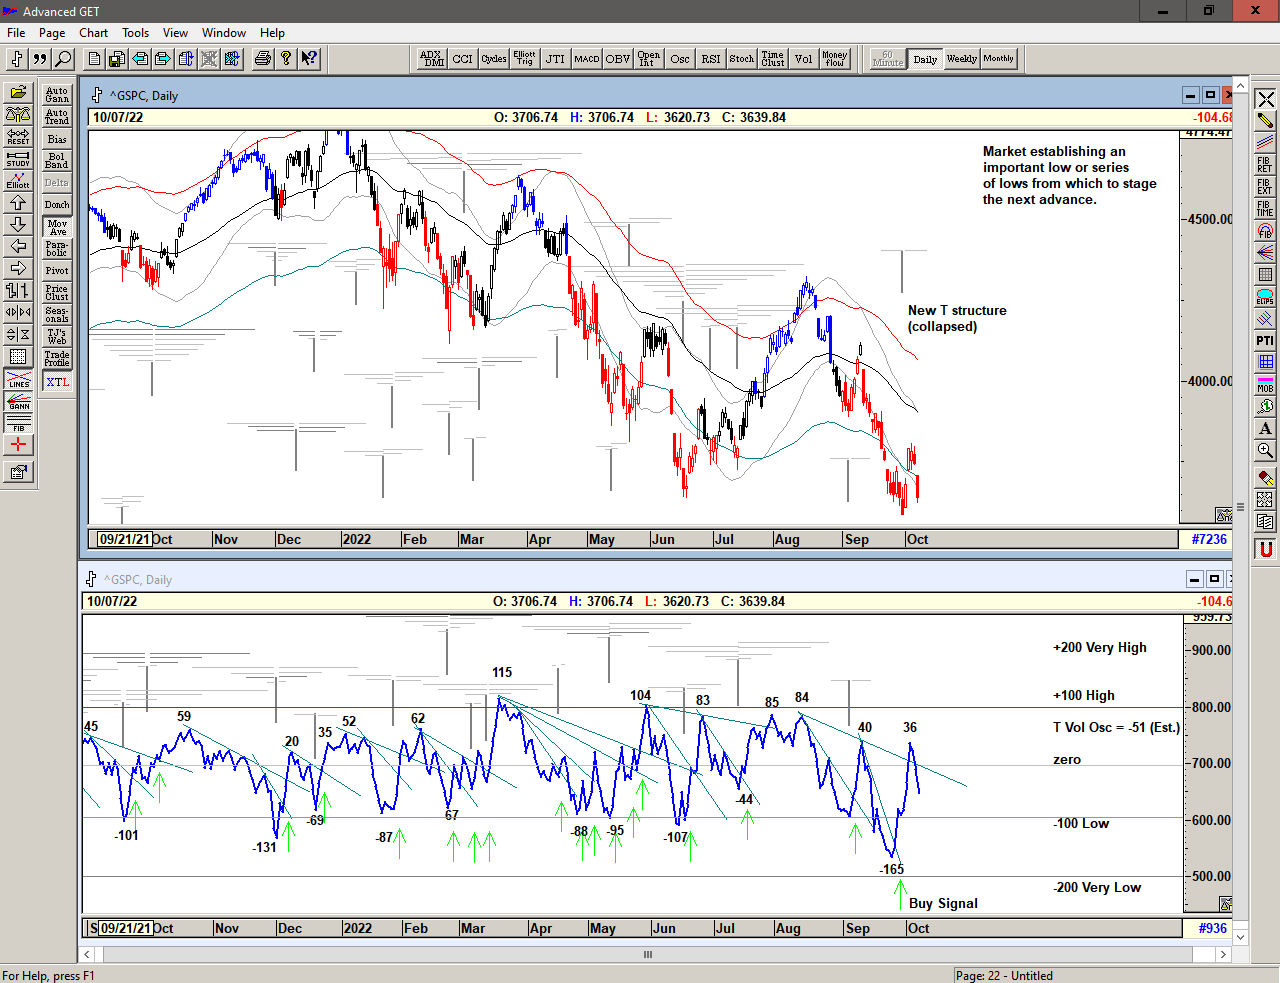
Bearish and dangerous conditions continue with a new T structure collapsing as the market looks desperately for support at or near the previous low.

Chart of S&P 500 with T volume oscillator for 10 October 2022

Save the image to your desktop to view a larger version

The T volume oscillator 1 is again collapsing with price looking for support and continuing to indicate a distinct lack of buying power since the mid August high.

The market is looking for the next low from which to stage its next advance. This may be in the process of happening with the important 3600 area being challenged and tested. We should continue to expect rapid movement in either direction and selling into strength as the market looks to stabilize whilst making a decision on future longer term direction.

We are looking for price to move up (and hold) above the previous price high and preferably close at or near the high of the day, and for the T volume oscillator to move upwards through the declining cash build up line 2 line to indicate the prescence of a new T structure.

1 The T volume oscillator is an indication of Buying Power within the market as a whole
2 The cash build-up line is a declining line drawn above a series of lower highs made in the oscillator.

Weekly chart of S&P 500 for 10 October 2022

Save the image to your desktop to view a larger version

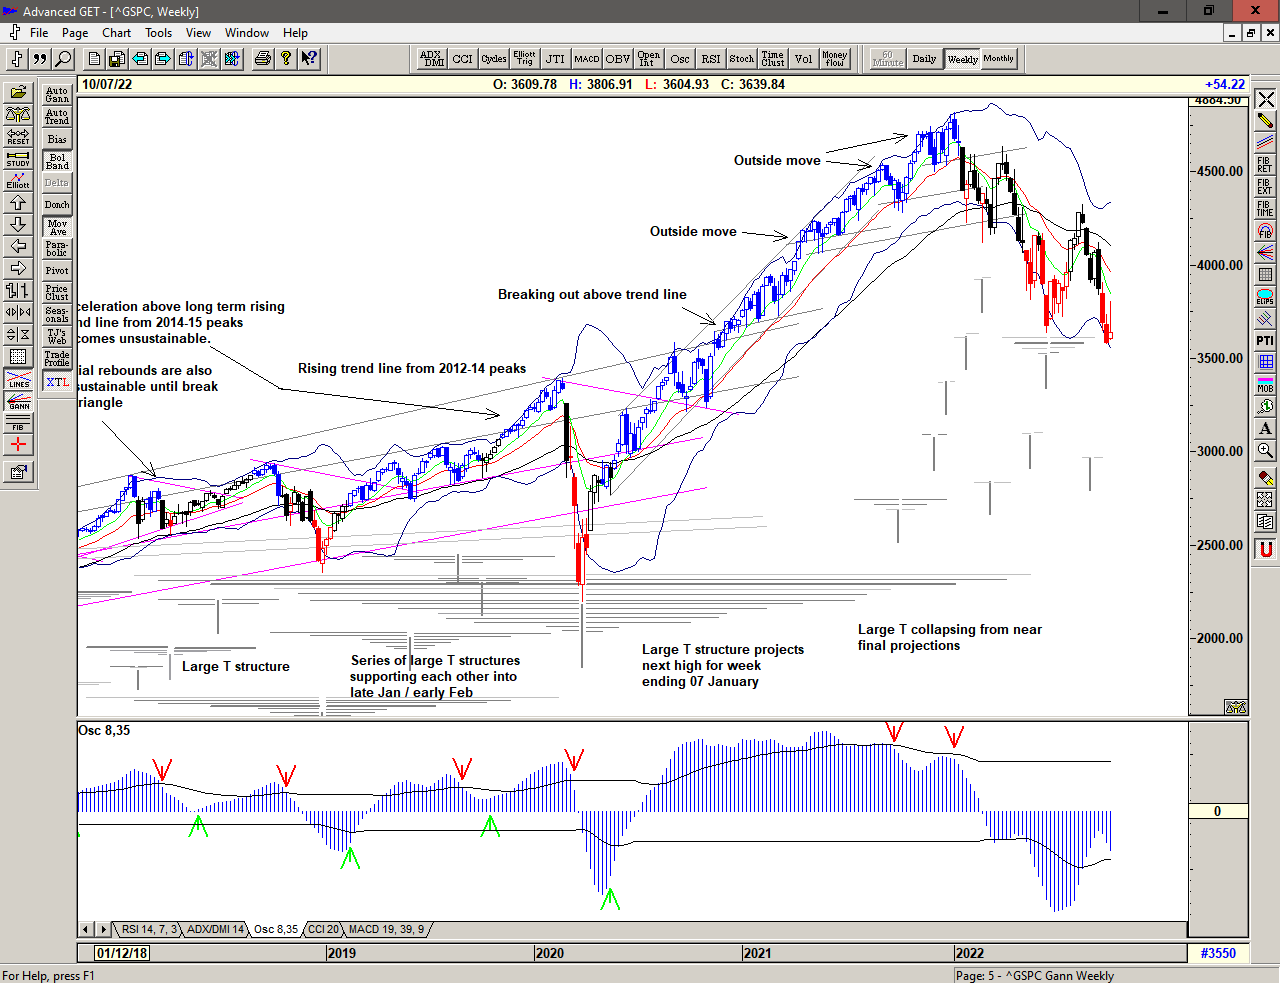
The weekly chart shows last week's collapse back towards the low of the previous week. Bearish action continues with the market attempting to place and hold a low at the breakout area of November 2020. Failure here would suggest a re-test of the September / October 2020 lows in the 3209-96 area.

Monthly chart of S&P 500 for 10 October 2022

Save the image to your desktop to view a larger version

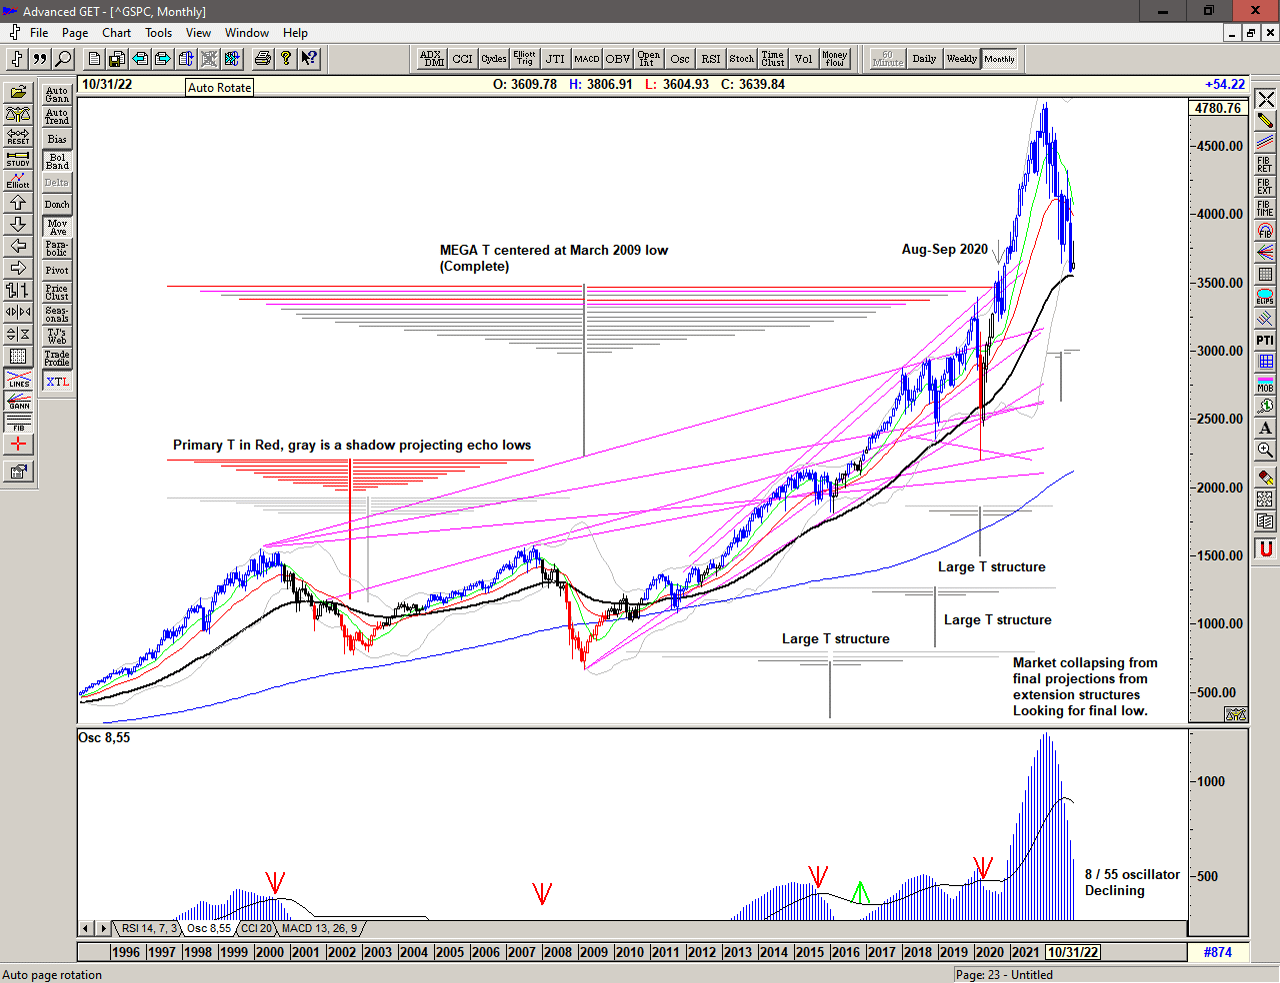
The monthly chart show the ongoing collapse of the Mega T structure (and its extension higher into late 2021) as price comes to terms with the over-exuburance of 2020 and 2021 and attempts to find support. The continued decline suggests further weakness for now and we should therefore expect ongoing volatility within the context of a long term bearish market.

2022 continues with price dropping sharply from the top of a range that has become increasingly expansive since the move above 2500. With price again below the extremely volatile range from 4100-4600 we can only assume that this expansive price action will continue – in both directions – and that the important 2020 highs around 3385 and 3500 may still become the target. This is a Brave New World and we should trade accordingly.

Regardless of whether the market can move higher or whether significant lows are ahead of us, the simplicity of the proprietary price based S/T Signalling System will continue to keep us on the correct side of the market, currently indicating a Sell Signal since 06 October below 3711.

If you would like to learn more about the S/T Signalling System , and using T Theory in your trading, please get in touch.

Sign up here for daily analysis with the updated Buy / Sell trigger levels being generated by the Trading the Line S/T System before the market opens. Trading the Line Membership – includes Explanatory Notes (pdf), Notes on Day Trading (pdf) and End of Day Snapshot of Day Trading Entries.

Disclaimer: This is the diary of a personal trading system, its methodology and the signals that it is producing. You are welcome to follow along but please understand that the information presented here is for educational purposes only. No recommendations are being made to buy, or sell stocks, options or futures contracts. Please consult your own financial advisor before making any investment decisions.


Modon

An early look higher is met with strong selling into 3750 in a choppy session.

Buy Signal continues.

Chart of S&P500 for 06 October 2022

Sign up here for daily analysis with the updated Buy / Sell trigger levels being generated by the Trading the Line S/T System before the market opens. Trading the Line Membership – includes Explanatory Notes (pdf), Notes on Day Trading (pdf) and End of Day Snapshot of Day Trading Entries.

Disclaimer: This is the diary of a personal trading system, its methodology and the signals that it is producing. You are welcome to follow along but please understand that the information presented here is for educational purposes only. No recommendations are being made to buy, or sell stocks, options or futures contracts. Please consult your own financial advisor before making any investment decisions.


Euridice

Some strong selling into a low at 3723 before pushing strongly back higher into 3806, dropping sharply back into the close.

Buy Signal continues but with warnings.

Chart of S&P 500 for 06 October 2022

Sign up here for daily analysis with the updated Buy / Sell trigger levels being generated by the Trading the Line S/T System before the market opens. Trading the Line Membership – includes Explanatory Notes (pdf), Notes on Day Trading (pdf) and End of Day Snapshot of Day Trading Entries.

Disclaimer: This is the diary of a personal trading system, its methodology and the signals that it is producing. You are welcome to follow along but please understand that the information presented here is for educational purposes only. No recommendations are being made to buy, or sell stocks, options or futures contracts. Please consult your own financial advisor before making any investment decisions.


Zamora

Very strong buying from the open with a push up into 3788, dropping back into 3756 before finding renewed strength into the close.

Buy Signal continues

Chart of S&P500 for 05 October 2022

Sign up here for daily analysis with the updated Buy / Sell trigger levels being generated by the Trading the Line S/T System before the market opens. Trading the Line Membership – includes Explanatory Notes (pdf), Notes on Day Trading (pdf) and End of Day Snapshot of Day Trading Entries.

Disclaimer: This is the diary of a personal trading system, its methodology and the signals that it is producing. You are welcome to follow along but please understand that the information presented here is for educational purposes only. No recommendations are being made to buy, or sell stocks, options or futures contracts. Please consult your own financial advisor before making any investment decisions.

.

Francis

Strong buying from the open, triggering a Cover Signal at 3644 and an S/T Buy Signal at 3664, pushing higher into 3698 before taking profit into the close.

An S/T Buy Signal at 3664

Chart of S&P 500 for 04 October 2022

Sign up here for daily analysis with the updated Buy / Sell trigger levels being generated by the Trading the Line S/T System before the market opens. Trading the Line Membership – includes Explanatory Notes (pdf), Notes on Day Trading (pdf) and End of Day Snapshot of Day Trading Entries.

Disclaimer: This is the diary of a personal trading system, its methodology and the signals that it is producing. You are welcome to follow along but please understand that the information presented here is for educational purposes only. No recommendations are being made to buy, or sell stocks, options or futures contracts. Please consult your own financial advisor before making any investment decisions.

Flute

No follow through. Overnight selling and market gapping down below the Sell Signal line at the open, triggering a Sell Signal at 3672, continuing lower into 3622 and a second low at 3610

An S/T Sell Signal below 3688 at 3672.

Chart of S&P 500 for 29 September 2022

Sign up here for daily analysis with the updated Buy / Sell trigger levels being generated by the Trading the Line S/T System before the market opens. Trading the Line Membership – includes Explanatory Notes (pdf), Notes on Day Trading (pdf) and End of Day Snapshot of Day Trading Entries.

Disclaimer: This is the diary of a personal trading system, its methodology and the signals that it is producing. You are welcome to follow along but please understand that the information presented here is for educational purposes only. No recommendations are being made to buy, or sell stocks, options or futures contracts. Please consult your own financial advisor before making any investment decisions.