Surprise

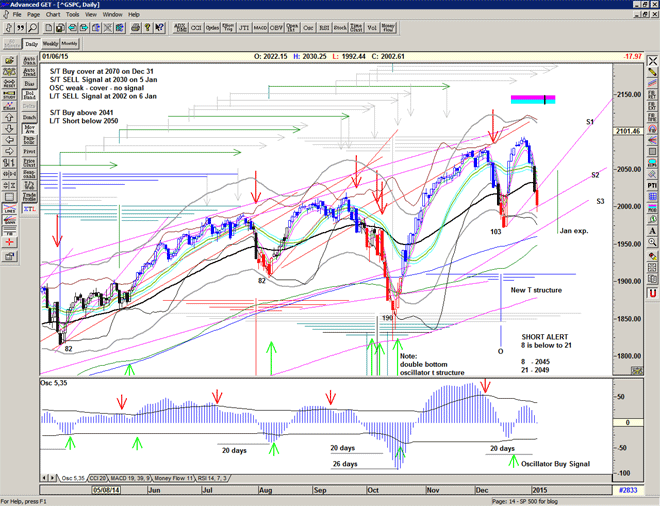
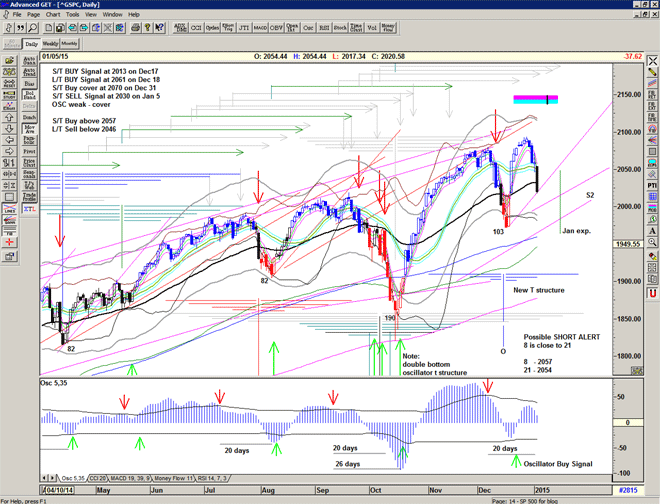
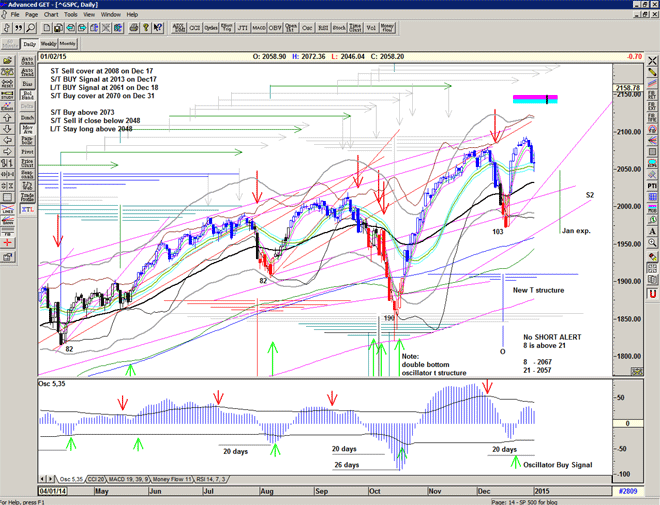
Yesterday's sharp move down and break through of the 55 ema suggests that there may be more downside.

Look for a possible test/break of the previous low at 1970 to scare the weak bulls before another re-test of the highs.

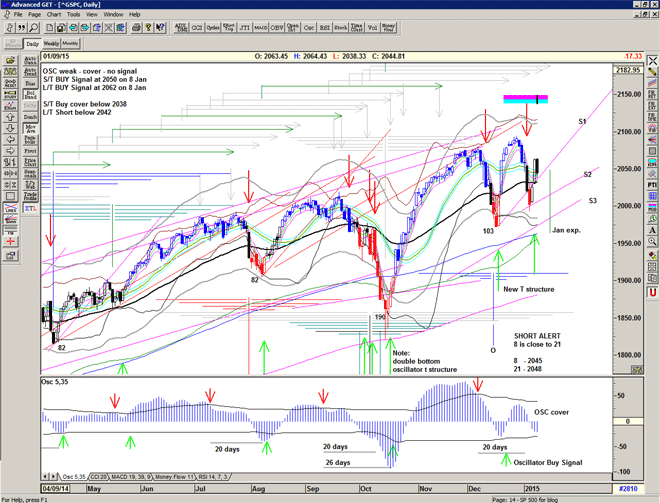
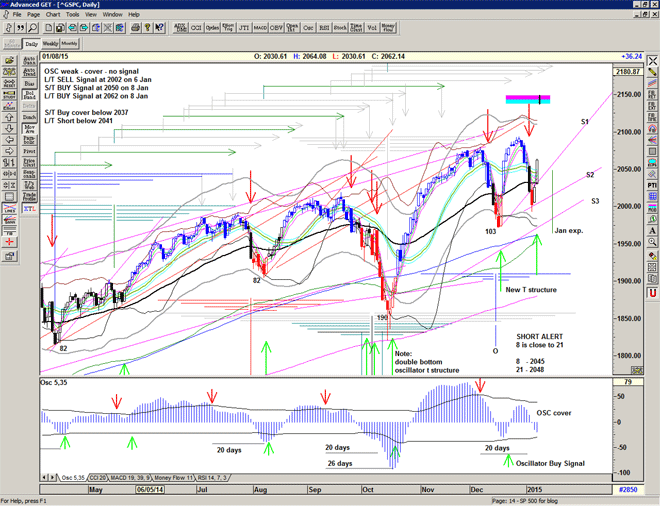
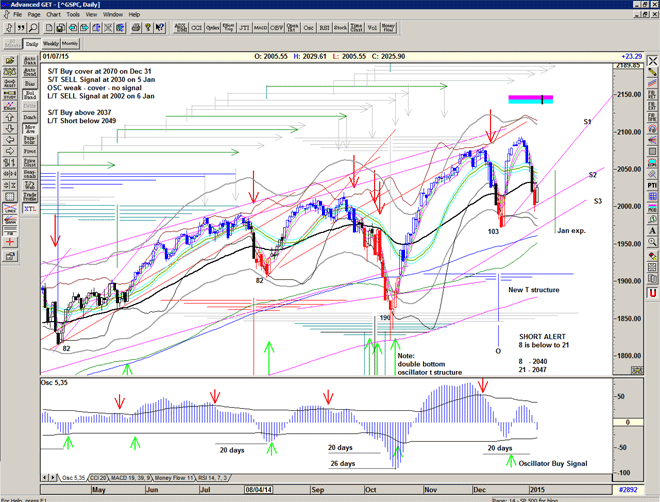
Chart of S&P500 for 6 January 2015

More Fed fever

L/ T Buy signal at the close with the move through 2052.

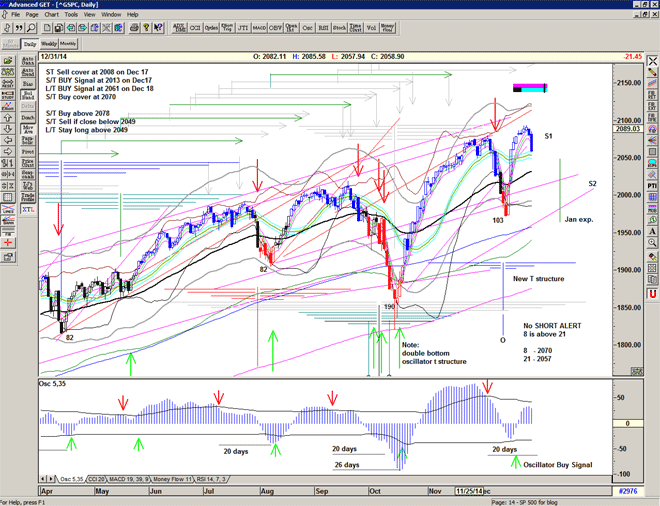
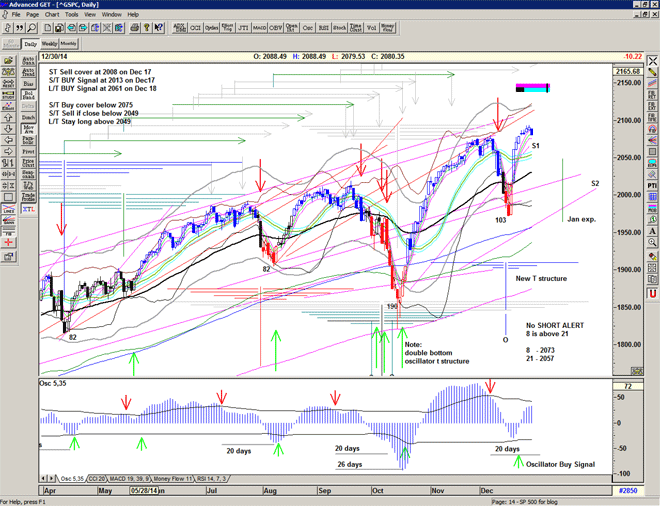
Santa rally firmly on now. Target new highs in 2100 area.

T vol oscillator now on BUY signal activating the T structure into late Jan.

OSC should confirm within a few days.

(note how the market is becoming more vertical in recent months)

Chart of S&P500 for 19 December 2014