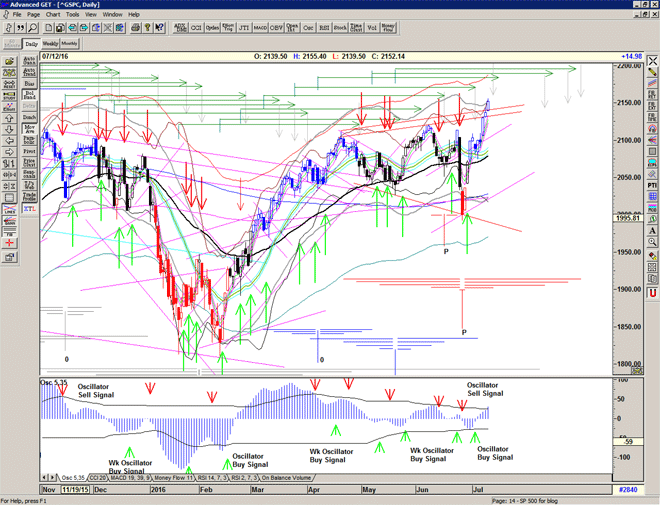
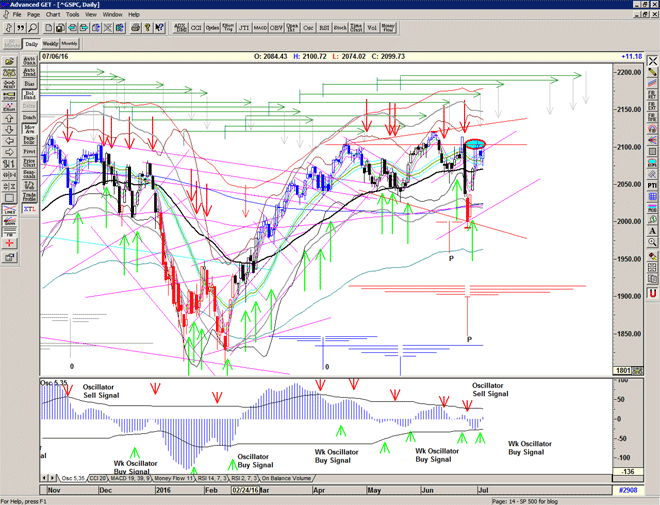
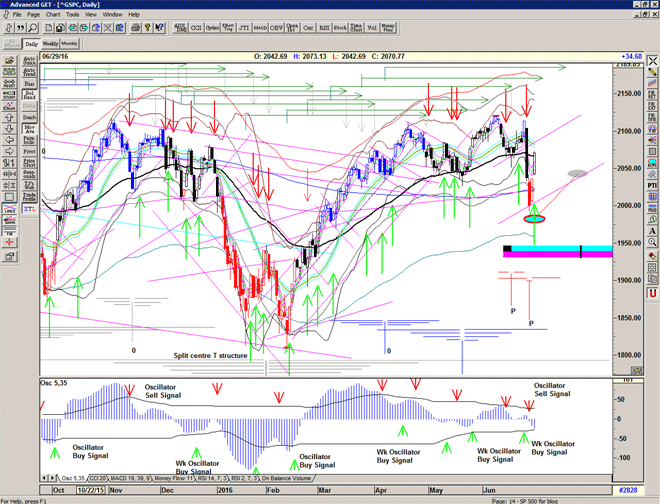
I will cover if closing below 2076
I will consider risk off if dropping below the 55 EMA
A navigation system for trading the S&P500 index
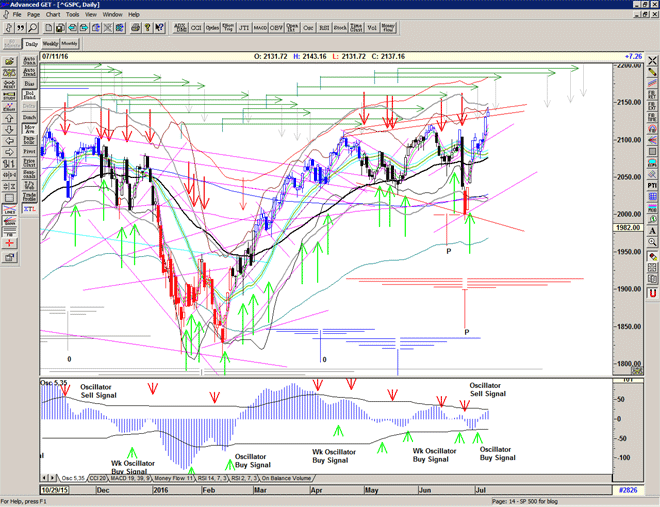
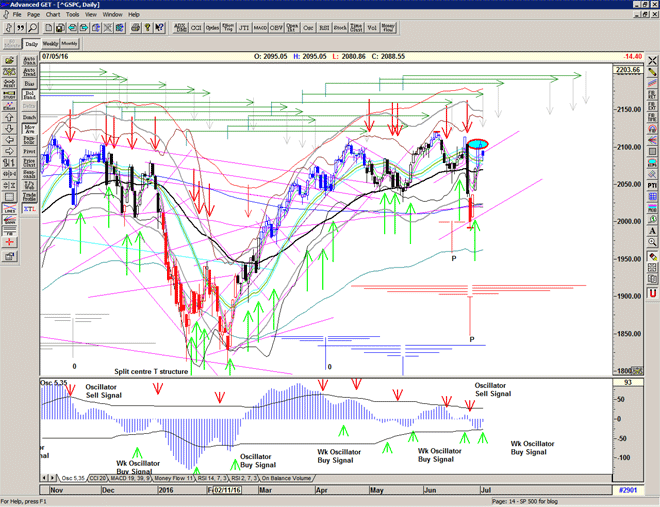
I will consider risk off if dropping below the 55 EMA
A little 'profit-taking' after the strength last week, and found support at the mid-point.
Held well above the stop line. Nothing out of the orderinary there.
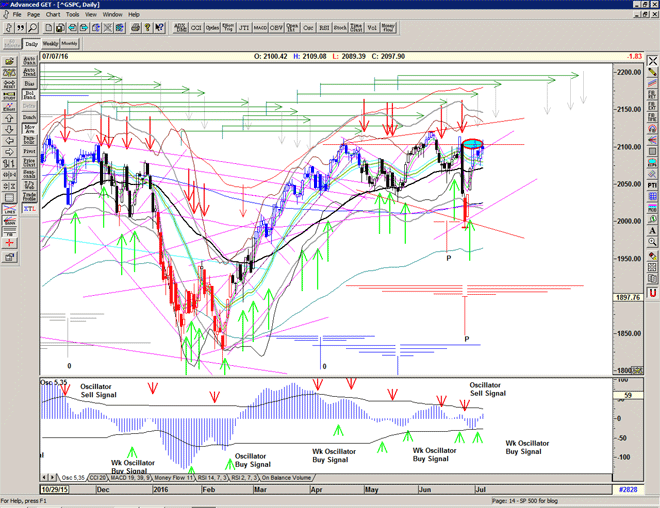
On the negative side, the blue ellipse indicates that the bounce from the low has been contained, further weakness may suggest a re-test of the recent low and/or the rising angle from it.
For more detailed analysis, please Sign up for Alerts & Observations
Disclaimer: This is the diary of a personal trading system, its methodology and the signals that it is producing. You are welcome to follow along but please understand that the information presented here is for entertainment purposes only. No recommendations are being made to buy, or sell stocks, options or futures contracts. Please consult your own financial advisor before making any investment decisions.
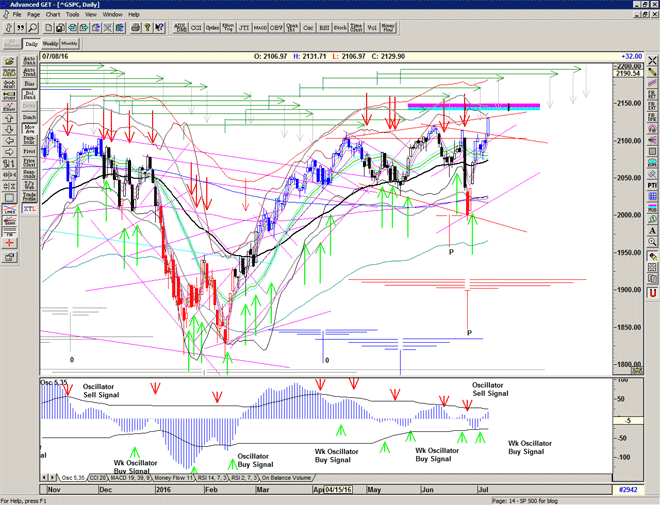
Everything looking good, tho we may need a small pullback here after the big push up from the recent low, and it also coincides with a minor high indicated.
Continued strength above the mid-channel and gann angle should project this higher into a mid July high.
A very happy Independence Day everyone.
For more detailed analysis and price trigger levels, please Sign up for Alerts & Observations
Certainly looks like a new T structure has been formed with the Brexit low, and a projection of new all time highs for a summer rally.
For more detailed analysis and price trigger levels, please Sign up for Alerts & Observations
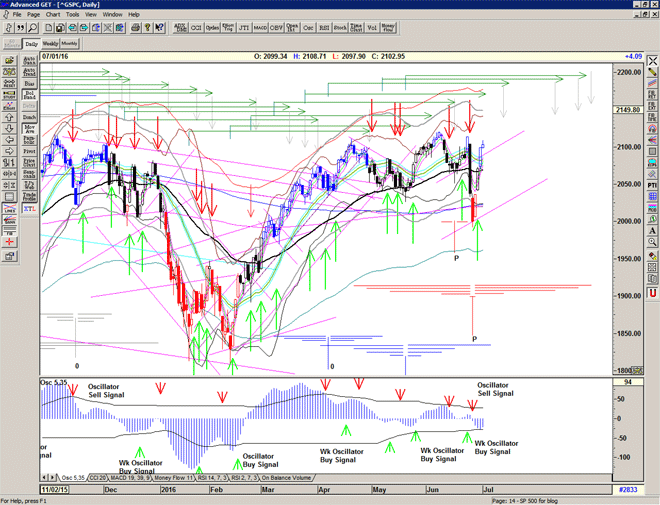
Sustained trade above the 2055 level as the shorts are forced to cover their positions.
It will be interesting to see what happens as we approach 2088 and try to stabilise at price levels prior to the recent shockwave shakeout.
For now the market is back on a BUY, but I wouldn't be at all surprised to see another move back down to test the recent low.
For more detailed analysis, please Sign up for Alerts & Observations
Disclaimer: This is the diary of a personal trading system, its methodology and the signals that it is producing. You are welcome to follow along but please understand that the information presented here is for entertainment purposes only. No recommendations are being made to buy, or sell stocks, options or futures contracts. Please consult your own financial advisor before making any investment decisions.
Covered in early morning trade and S/T BUY signal at 2058
Cover if closing back below 2052
Tight trailing stop
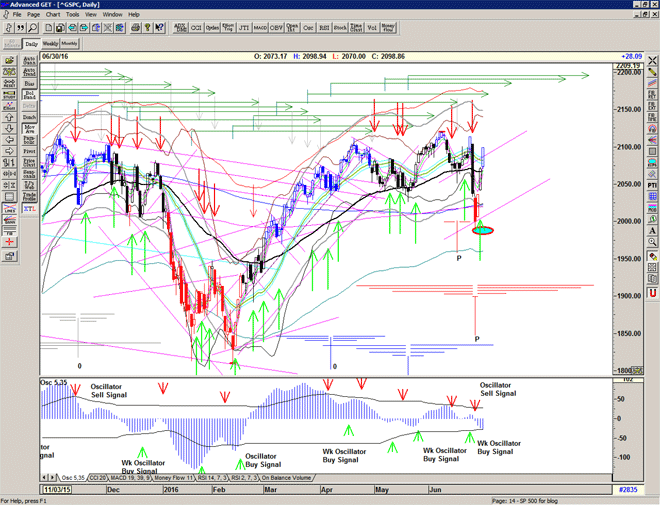
Nice short-covering rally as to be expected by the high Arms reading Friday
(over 2 – maybe one more day of selling, then a rally)
Back above the 200MA, which is good too.
All good, but we have a very short arm on the T structure
And an ultra high reading on Skew
Be prepared for another big move… down
For more detailed analysis and price trigger levels, please Sign up for Alerts & Observations
The Battle for 2000 starts and a Bear market warning occurs as the market punches effortlessly through the 200 simple moving average at 2021. The 200 MA is a benchmark Bull/Bear line in the sand.
We may try to rally here, but the Target now looks even like more likely to be 1935-40, corresponding neatly with the early February high.
With such a fast and violent move it will take some time to stabilise, and this also has an adverse affect upon the signals being generated by price alone.
For more detailed analysis and price trigger levels, please Sign up for Alerts & Observations
Expect some volatile days ahead as the brexit shockwave is processed into the marketplace.
There may well be a hangover caused by the currency crash.
Short-term bounce is likely due to the high Arms reading (2.06), but we are likely to test 2000 either before or after the first bounce.
It may take a few weeks to establish a new low and 25th July looks like a target date for that at present.
Failure of the early bounce and no reason to be long.