Seven Sevens

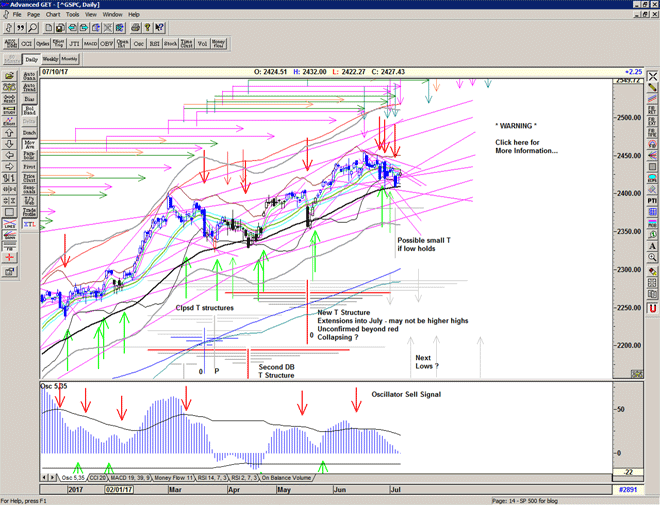
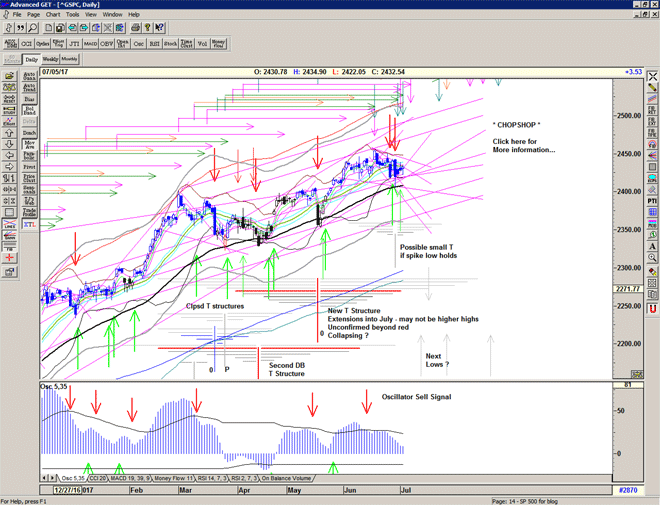
A Sell Signal triggered at the open yesterday and a valiant attempt at a recovery off an important support area including the long support line from the Election low.

The market is now back at the important 55 ema which has supported recent pull-backs and is a pivot point within the defined channel. Much more selling and this opens up a trap-door for a visit to the bottom of the gray channel, or even lower.

Chart of S&P 500 for 07 July 2017

Be prepared for whatever comes next:

To receive detailed daily analysis, guidance and the updated daily Buy / Sell trigger levels being generated by the Trading the Line system before the market opens, and intraday alerts when appropriate, please become a Member and Sign up for Alerts & Observations – includes access to Members Area and the Explanatory Notes for all of the concepts discussed.

Disclaimer: This is the diary of a personal trading system, its methodology and the signals that it is producing. You are welcome to follow along but please understand that the information presented here is for educational purposes only. No recommendations are being made to buy, or sell stocks, options or futures contracts. Please consult your own financial advisor before making any investment decisions.


Heliopolis

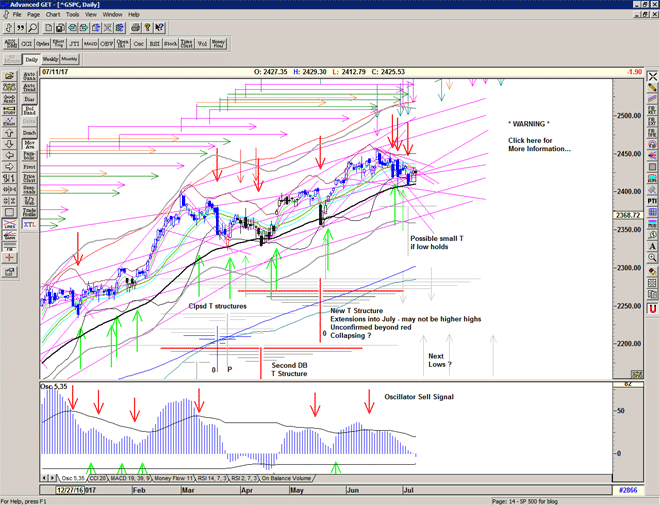
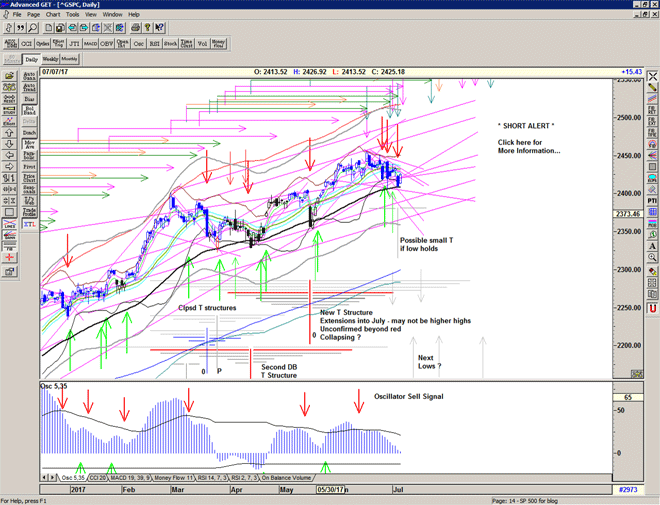
Market triangulating within the rising and descending lines, and within what I define as 'chopshop' with the market oscillating from Buy to Sell Signal levels and building up energy for the next move, direction undecided.

Chart of S&P 500 for 06 July 2017

Be prepared for whatever comes next:

To receive detailed daily analysis, guidance and the updated daily Buy / Sell trigger levels being generated by the Trading the Line system before the market opens, and intraday alerts when appropriate, please become a Member and Sign up for Alerts & Observations – includes access to Members Area and the Explanatory Notes for all of the concepts discussed.

Disclaimer: This is the diary of a personal trading system, its methodology and the signals that it is producing. You are welcome to follow along but please understand that the information presented here is for educational purposes only. No recommendations are being made to buy, or sell stocks, options or futures contracts. Please consult your own financial advisor before making any investment decisions.


Independence

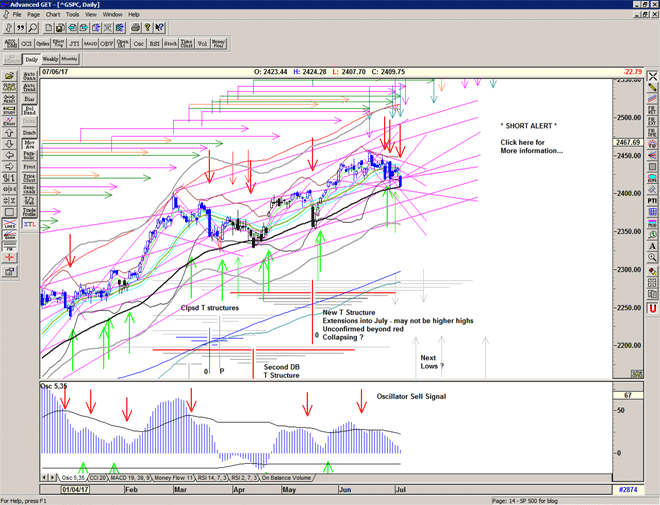
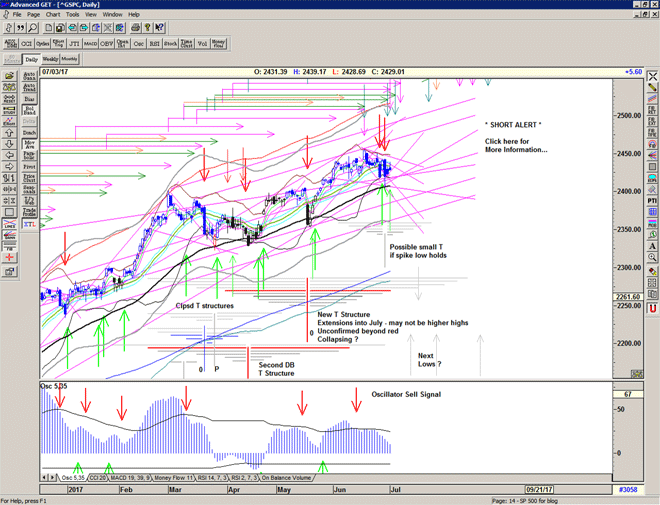
A brief 'Buy' signal rapidly faded at descending resistance and at the end arm of the current T structure marked red.

Expect more chop as the squeeze resolves, and potentially still looking for a low to set up the next move.

IF the market continues lower we should look for support on the next series of support lines in the 2390s and 2370s.

However, IF last week's spike low to 2406 holds, we have a possible small T which projects into mid July and synchronises with the next arm of the New T structure.

Enjoy your Independence.

Chart of S&P 500 for 04 July 2017

Be prepared for whatever comes next:

To receive detailed daily analysis, guidance and the updated daily Buy / Sell trigger levels being generated by the Trading the Line system before the market opens, and intraday alerts when appropriate, please become a Member and Sign up for Alerts & Observations – includes access to Members Area and the Explanatory Notes for all of the concepts discussed.

Disclaimer: This is the diary of a personal trading system, its methodology and the signals that it is producing. You are welcome to follow along but please understand that the information presented here is for educational purposes only. No recommendations are being made to buy, or sell stocks, options or futures contracts. Please consult your own financial advisor before making any investment decisions.


Tears in Rain

I've seen things you people wouldn't believe. Attack ships on fire off the shoulder of Orion. I watched C-beams glitter in the dark near the Tannhäuser Gate. All those moments will be lost in time, like tears in rain. Time to die.

Bladerunner, 1982. Dir. Ridley Scott

Time for an update on the S&P 500.

With the market's recent visit to 2450 and some additional volatility entering the scene, the question arises: is it time for the market to rollover, and time to die?

Unfortunately the crystal ball is rather cloudy, but I think it is interesting to look at the various causes and effects, and weigh up the possibilities.

Each of the major lows has a T structure, and we can see that these structures drawn from previous highs to lows make projections in time that produce highs. The oscillator reveals the breadth or force of buying power behind the market's moves, and reveals some of the important turning points.
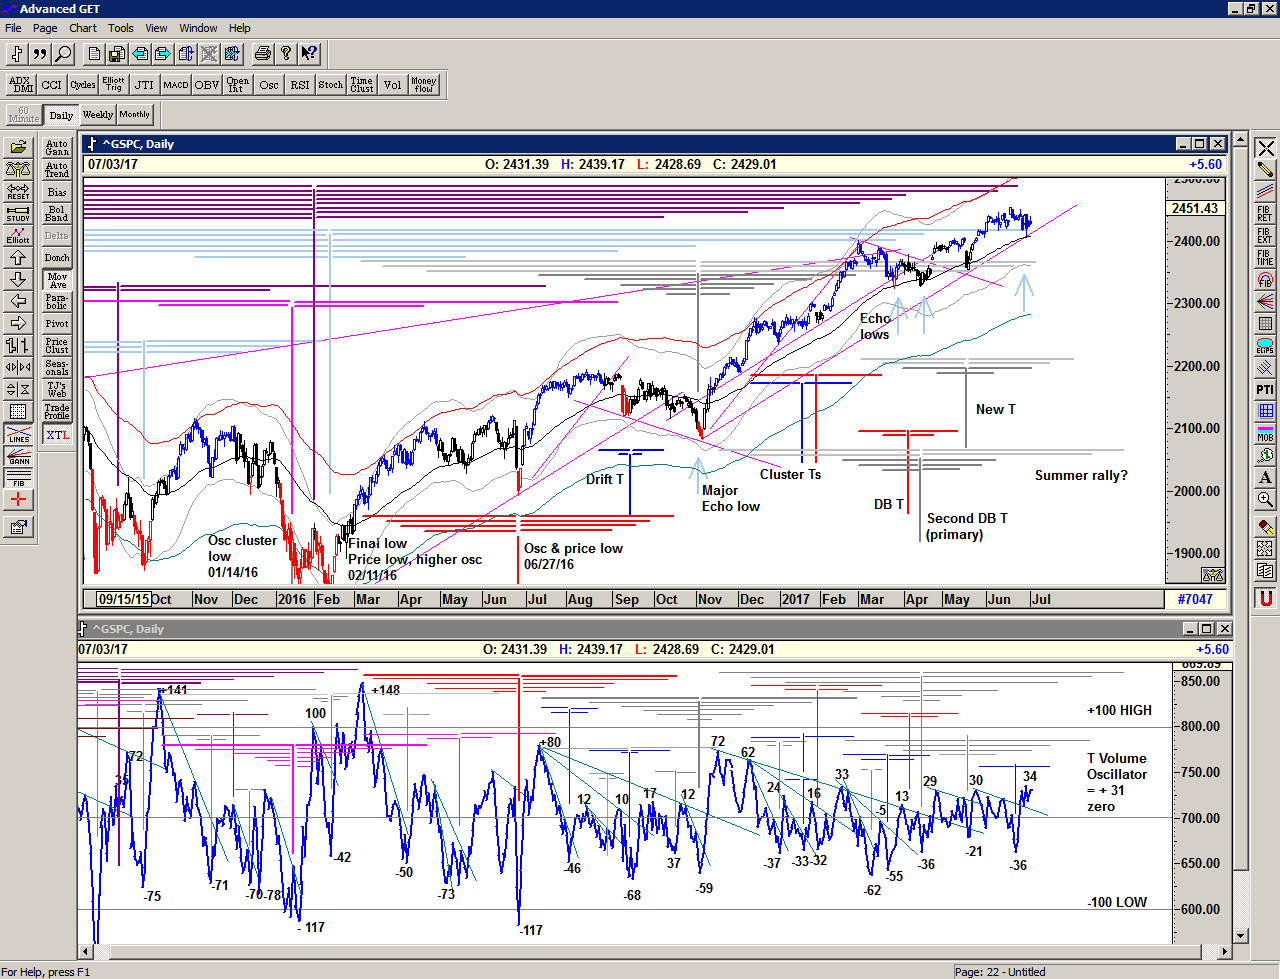
Chart of S&P 500 for 27 May 2017

What we can see at the moment is that the very long range T structure (purple) associated with the January-February 2016 Double bottom is having a downward endgame effect. So too is the T structure associated with the Election low – I have drawn extensions of this structure back to the previous oscillator high (+148), and it looks like the most recent all time high coincides with this. And there may be another one in the next few days.

The pale blue structure associated with the second low of the major double bottom projects Echo lows, and interestingly this includes last week's visit to 2406, which occurred on an important rising line from the Election low, and at the important pivot line – the 55 exponential moving average.

The behaviour of the oscillator in recent months – breaking up through the descending cash-build up lines, albeit briefly – is still supportative of the 2 most recent T Structures with possible projections into August.

So – imminent collapse, or summer rally? Perhaps a bit of both. Violation of that important rising line and the 55 ema would most probably set up a short trip lower, where we most probably will find some renewed interest in pushing the market higher.
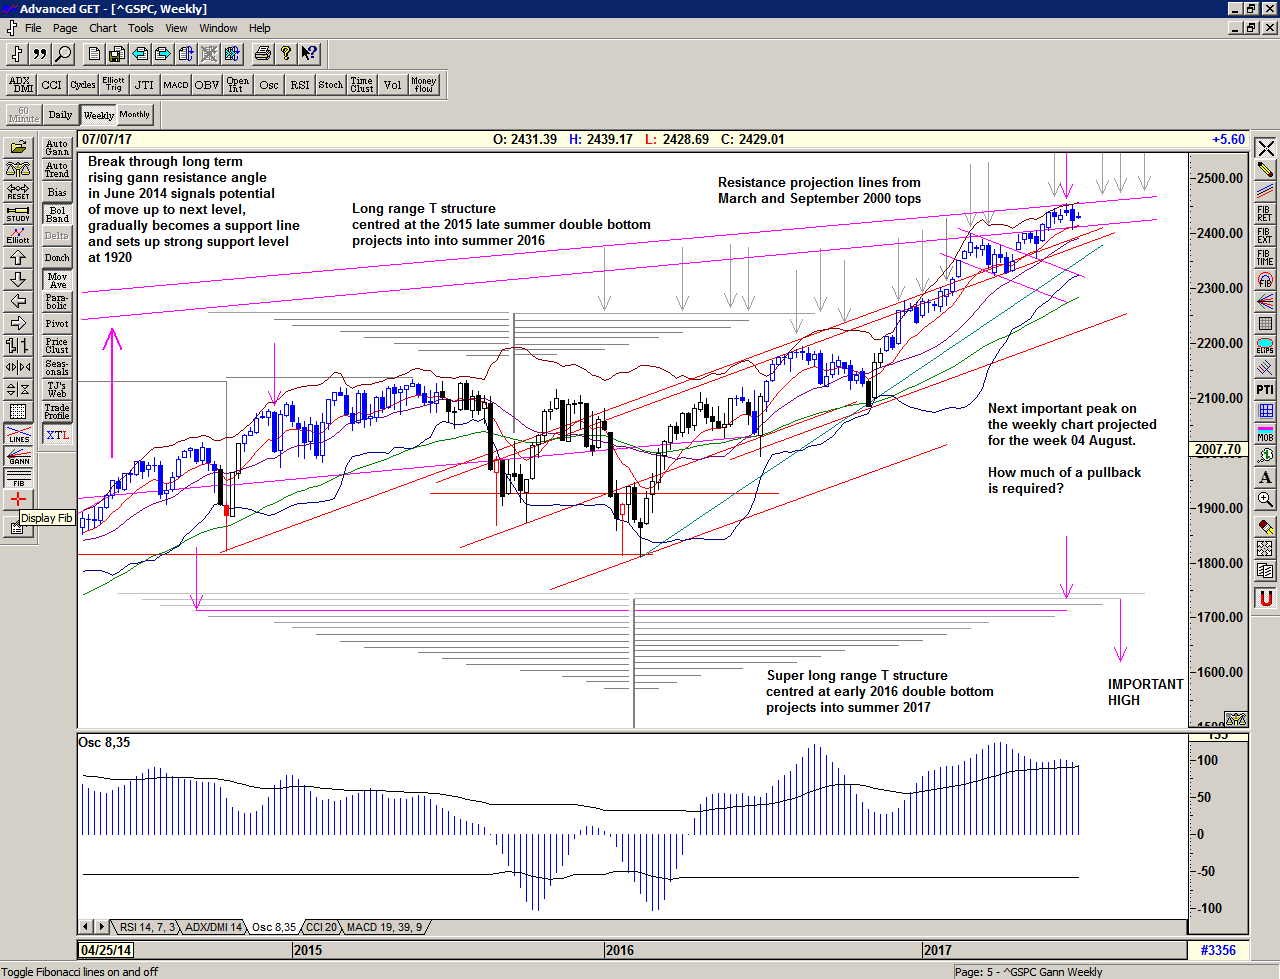
Chart of S&P 500 for 05 July 2017

The weekly chart above shows the full potential range of the long range Double Bottom structure of early 2016. As you can see the market has been tackling the long term resistance lines that I have drawn from the March and September 2000 tops. I believe that when the market moves upwards through these lines it will set up a significant move higher. I suspect that it may be similar to the June 2014 breakthrough, which wasn't straight up but a process of re-testing the previous significant low and building a platform. Perhaps 2320-30 will become significant at future lows prior to the next major advance?

In the meantime it looks like the next important peak will be in the week of 4 August, with perhaps a more significant peak in the week of 25 August. How much of a pullback is required first, and whether to expect higher or lower highs is unclear, and is dependent upon what happens next.

Be prepared for what is coming next:

For more detailed ongoing analysis of the developments in the S&P500 index on a daily basis, as well as my personal Buy and Sell Signal trigger levels, please Sign up for daily Alerts & Observations. This includes access to the Members Area for an archive of all of my alerts and updates and my Explanatory Notes pdf which gives detailed explanations on all of the concepts being discussed.

 

Dog Days

Priam saw him first, with his old man's eyes,
A single point of light on Troy's dusty plain.
Sirius rises late in the dark, liquid sky
On summer nights, star of stars,
Orion's Dog they call it, brightest
Of all, but an evil portent, bringing heat
And fevers to suffering humanity.
Achilles' bronze gleamed like this as he ran.
– Homer's Iliad

Market certainly trying to recover and looked as though the Sell Signal would be cancelled in the afternoon drift higher.

Last minute selling keeps the Sell Signal active, for now.

Expecting lots more volatility and choppiness in early July as the current squeeze winds out.

Chart of S&P 500 for 1 July 2017

Be prepared for whatever comes next:

To receive detailed daily analysis, guidance and the updated daily Buy / Sell trigger levels being generated by the Trading the Line system before the market opens, and intraday alerts when appropriate, please become a Member and Sign up for Alerts & Observations – includes access to Members Area and the Explanatory Notes for all of the concepts discussed.

Disclaimer: This is the diary of a personal trading system, its methodology and the signals that it is producing. You are welcome to follow along but please understand that the information presented here is for educational purposes only. No recommendations are being made to buy, or sell stocks, options or futures contracts. Please consult your own financial advisor before making any investment decisions.


Le Déluge

Après moi le déluge
(Louis XV of France / RAF 617 Squadron Dambuster's motto)

A ferocious sell-off down into a hole at 2406 which just happens to be the 55 day ema and site of a long term rising Gann line form the Election low – an important test for the whole Trump rally.

This also marks a structural centre to the current rising trend and is right on a line which rises from the February 2015 highs.

Interestingly, yesterday is exactly in-line with the 5 April spike high and reverse day and is almost certainly in my mind an echo of that occurrence. This in turn reinforces the projections of the 'New T Structure' and we should therefore assume that the upcoming arms of the T will also be peaks at those times (not necessarily higher peaks).

As the market has clearly expanded its range and volatility, we should expect this to continue for a while, especially considering the upcoming cluster of Echo and Pulse highs that are projected for the next week or so.

Chart of S&P 500 for 30 June 2017

Be prepared for whatever comes next:

To receive detailed daily analysis, guidance and the updated daily Buy / Sell trigger levels being generated by the Trading the Line system before the market opens, and intraday alerts when appropriate, please become a Member and Sign up for Alerts & Observations – includes access to Members Area and the Explanatory Notes for all of the concepts discussed.

Disclaimer: This is the diary of a personal trading system, its methodology and the signals that it is producing. You are welcome to follow along but please understand that the information presented here is for educational purposes only. No recommendations are being made to buy, or sell stocks, options or futures contracts. Please consult your own financial advisor before making any investment decisions.


ST SELL Signal at 2428

Market came down to the BUY / SELL signal level of 2428.

No bounce here, so the signal is short again.

Market dropped into a hole at 2406 – and bounced nicely with plenty of support there.

It looks like the selling stopped there and it seems like we are back on the way up (for now).

Market held onto most of its gains from the bounce, but didn't close back above the Sell Signal line.

Expect more highly volatile days ahead, be prepared for anything and hedge risk accordingly.

Peter & Paulie

"Forget about it" is, like, if you agree with someone, you know, like "Raquel Welch is one great piece of ass. Forget about it!" But then, if you disagree, like "A Lincoln is better than a Cadillac? Forget about it!" You know? But then, it's also like if something's the greatest thing in the world, like, "Minghia! Those peppers! Forget about it!" But it's also like saying "Go to hell!" too. Like, you know, like "Hey Paulie, you got a one-inch pecker?" and Paulie says "Forget about it!" Sometimes it just means "Forget about it."

Donnie Brasco, 1997, Dir: Mike Newell

A snap-back short covering rally as the market breezes back up through the Buy Signal level.

Could be a small price T projecting into early July (if Tuesday's low is left behind us).

Still in the descending resistance zone and still within the recent range, and the current squeeze getting tighter.

Cluster of highs ahead suggesting further heavy choppiness.

T volume oscillator moves significantly higher indicating broad strength and breadth and support for the current T structure.

Chart of S&P 500 for 29 June 2017

Be prepared for whatever comes next:

To receive detailed daily analysis, guidance and the updated daily Buy / Sell trigger levels being generated by the Trading the Line system before the market opens, and intraday alerts when appropriate, please become a Member and Sign up for Alerts & Observations – includes access to Members Area and the Explanatory Notes for all of the concepts discussed.

Disclaimer: This is the diary of a personal trading system, its methodology and the signals that it is producing. You are welcome to follow along but please understand that the information presented here is for educational purposes only. No recommendations are being made to buy, or sell stocks, options or futures contracts. Please consult your own financial advisor before making any investment decisions.