Innocent Eyes

I took the money
I spiked your drink
You miss too much these days if you stop to think
You lead me on with those innocent eyes
You know I love the element of surprise
In the garden I was playing the tart
I kissed your lips and broke your heart
You
You were acting like it was the end of the world

U2, Until the End of the World, 1991

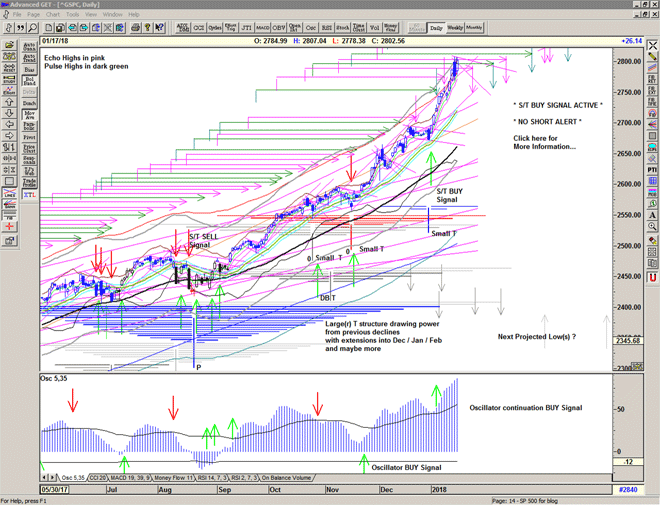
An interesting start back after the MLK holiday, and looking like an important reversal (for now).

The gap up above the upper gray channel proved to be unsustainable and triggered some strong selling.

We are still way above the Buy Signal line and the market has some serious catching up with itself to do.

It seems likely that we will see some days of consolidation in the vicinity of this high and perhaps some declining resistance developing now as traders look to take some profits at these levels.

Chart of S&P 500 for 17 January 2018

Be prepared for whatever is coming next, and trade with confidence:

To receive detailed daily analysis, guidance and the updated daily Buy / Sell trigger levels being generated by the Trading the Line system before the market opens, and intraday alerts when appropriate, please become a Member and Sign up for Alerts & Observations – includes access to Members Area and the Explanatory Notes for all of the concepts discussed.

Disclaimer: This is the diary of a personal trading system, its methodology and the signals that it is producing. You are welcome to follow along but please understand that the information presented here is for educational purposes only. No recommendations are being made to buy, or sell stocks, options or futures contracts. Please consult your own financial advisor before making any investment decisions.


MiLK

I have a dream that one day this nation will rise up and live out the true meaning of its creed:
"We hold these truths to be self-evident, that all men are created equal."

Martin Luther King, Jr. , 1963

Welcome to the Trading the Line Free Report.

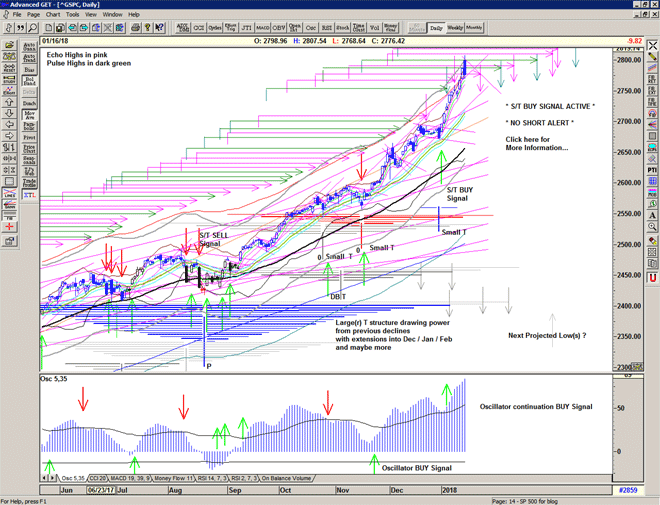
The market powers into the long weekend, closing at the top of the gray channel and above the upper extreme. The gray channel is my proprietary trading channel that describes the market's normal range. The upper and lower extremes (fine red and green lines) are my approximation of Terry Laundry's proprietary Energy channel. Trading at these levels is unusual.

An incredible 2 weeks to start the year – far beyond expectations, so lets take a look and see what's going on.
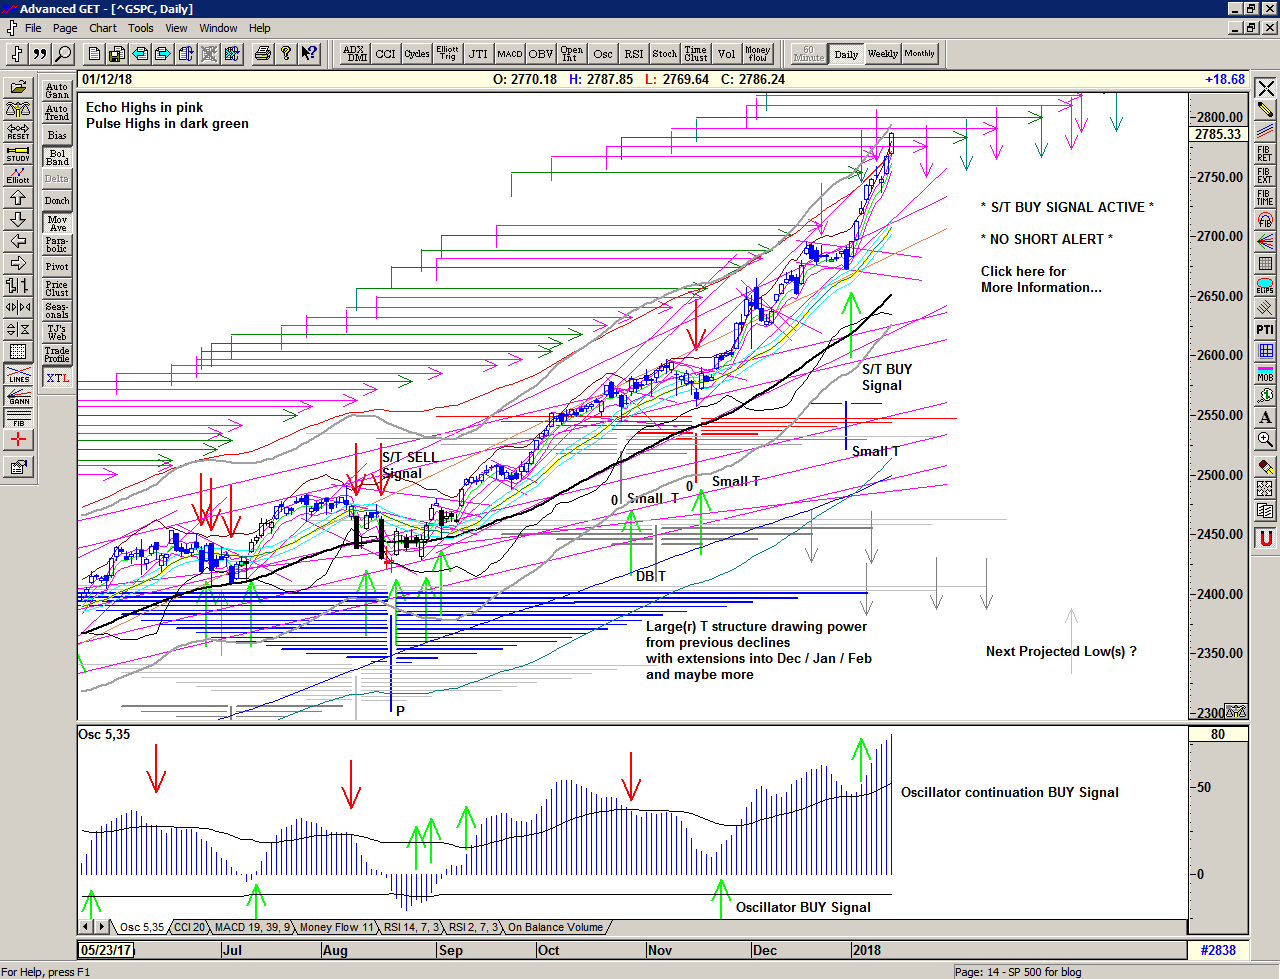
Chart of S&P 500 for 16 January 2018

Save the image to your desktop to view a larger version

As we can see, on 02 January the market gapped up into another S/T Buy Signal at 2686 and took off, quickly erasing all of the indications that a correction or consolidation of any kind was imminent – which was of course the predominant thinking, including mine. This appears to have released an enormous amount of bullish energy as new all time highs beget further new all time highs.

Even the recent echo high on 09 January had little lasting effect as the vacuum created by lack of sellers and most probably a lot of short sellers at the Christmas high quickly propelled the market higher and higher.
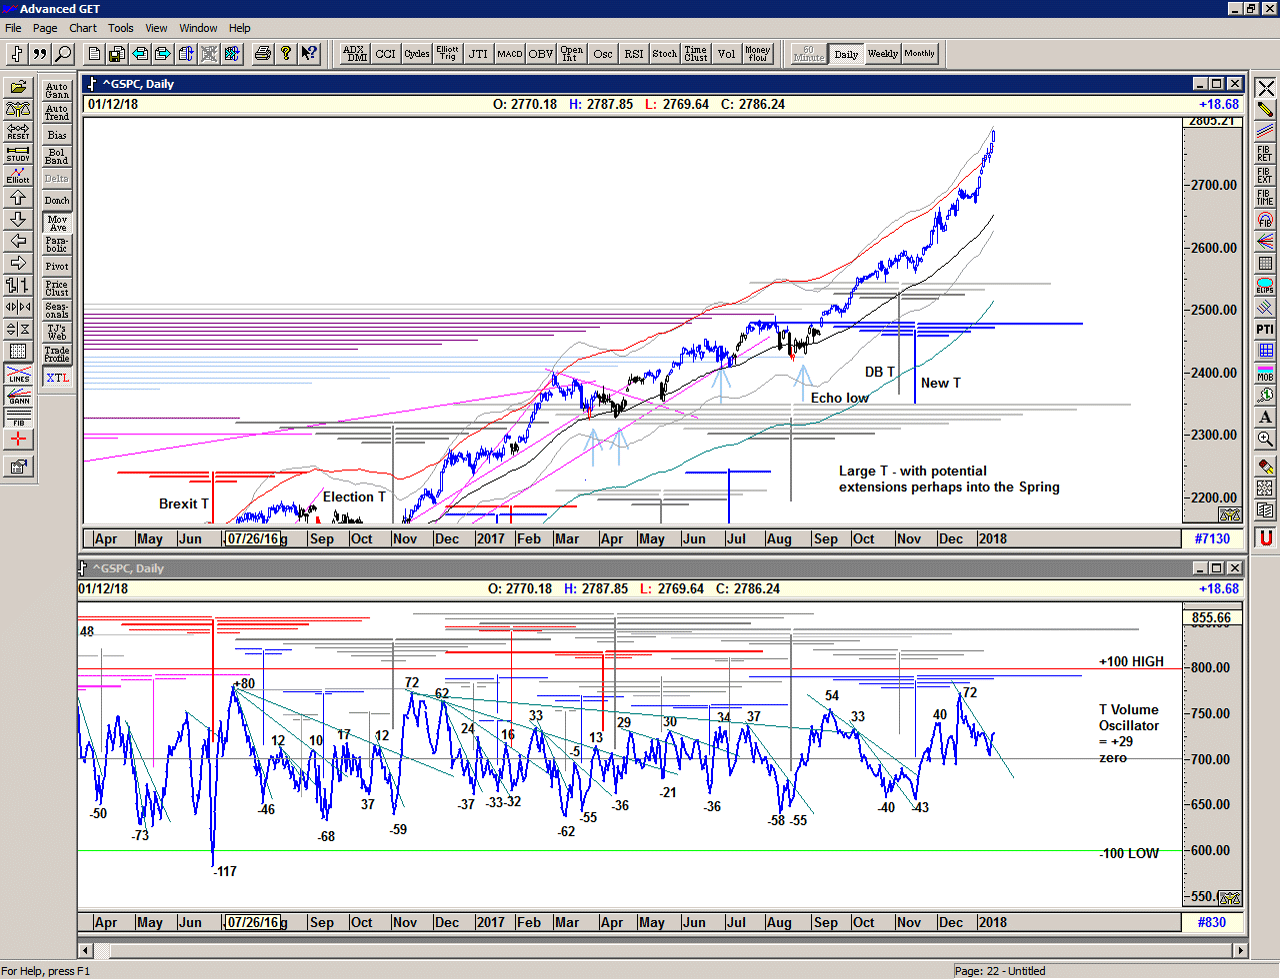
Chart of S&P 500 for 16 January 2018

Save the image to your desktop to view a larger version

I mentioned in my last report that the rise of the T volume oscillator (to 72) above its previous relative high was another bullish indication and potentially activated the really long cash-build-up line going back to the November and December 2016 highs, but I am still surprised at the absolute lack of corrective action.

In fact we can already see a short cash-build-up occurring since the oscillator high in December which shows that a significant amount of profit-taking is occurring within the context of the market's continual rise.

This means 2 things, that traders are taking profits only to see the market continue higher encouraging them to chase the market higher, and that the market is also leaving a significant amount of traders behind waiting to enter on any future dips as and when that occurs.

This in turn produces 2 distinct effects – a volatile unstable market, and a lot of buyers that will enter on any deep pullback.

Notice that the range has increased dramatically since the summertime, partially in response to the higher price, and I can only assume that this will continue, and that we can therefore look forward to some large (perhaps 2-300 point) swings in both directions in the course of the year ahead.

The T volume oscillator is strongly bullish and suggests that we take the longer projections of the 2 current structures very seriously indeed. That suggests to me that we should see further highs into February, March and April, perhaps even May, as projected by the full extent of the Large T structure (above).
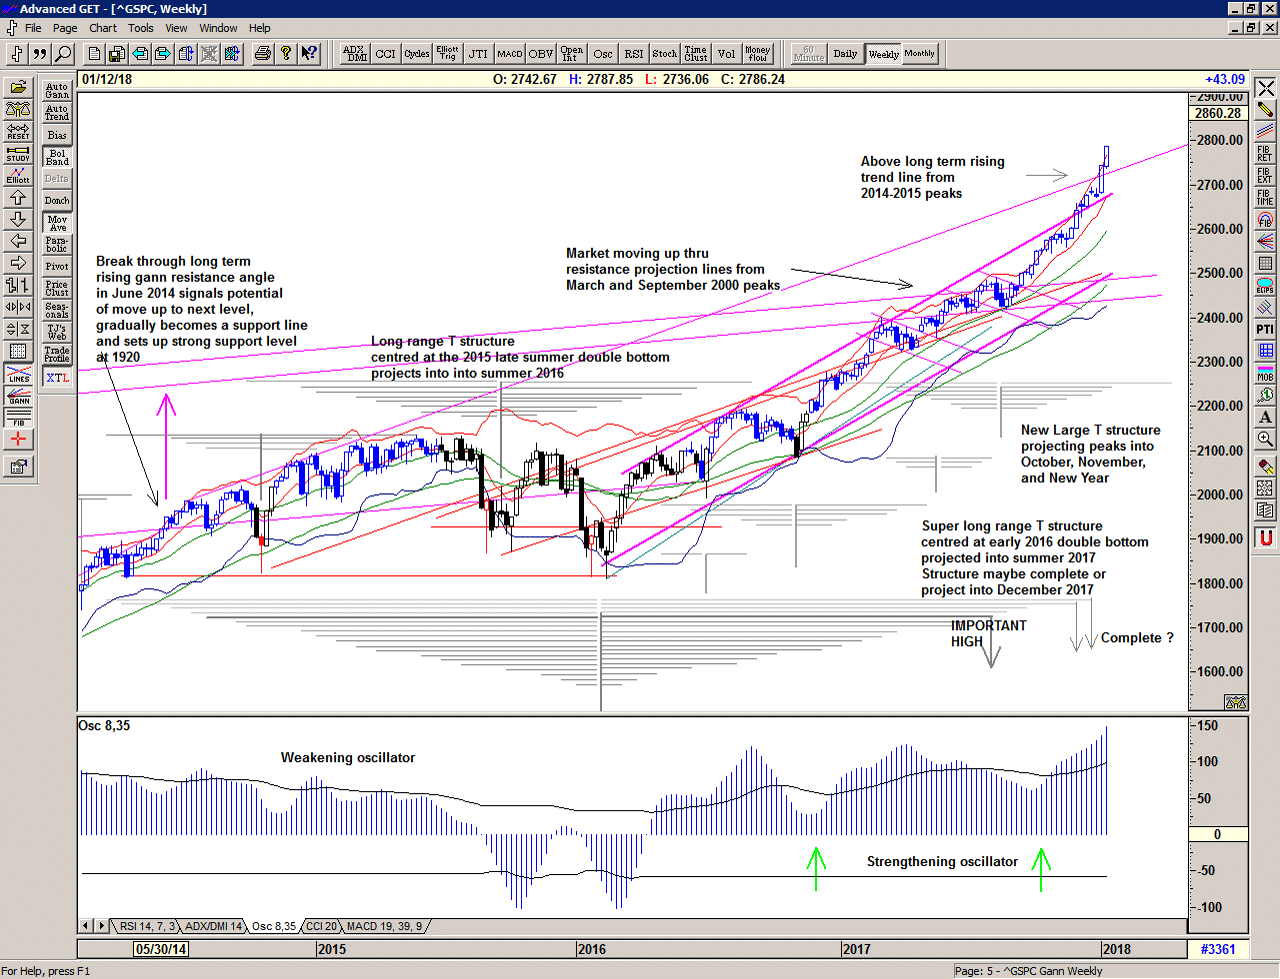
Chart of S&P 500 for 16 January 2018

Save the image to your desktop to view a larger version

On the weekly chart we can see that the market has now moved beyond the target trend-line from the 2014-15 peaks and that we may be near to an exhaustion point with the market moving nearly vertically above that line.

This has synchronised with the market's move to the upper extreme of the channel and the gray channel on the daily chart and although we could certainly see the market continue to climb at these levels it would be reasonable to expect some slowing of the rise in price, perhaps even a pullback of some kind.

In the meantime, the simplicity of my proprietary S/T Signalling System continues to keep us on the correct side of the market, providing a green light for buying (and holding on) at increasingly higher prices, regardless of the temptation to take profits (early).

The S/T Signalling System is not a black box system. It is a rigorous trading method and risk management system that will enable you to understand how to participate in the market without fear or prejudice, because it is derived solely from what the market is doing now.

There are of course many ways to participate in the market using the S/T Signalling System and how you use the system would depend upon you and your own parameters. The system has now been profitable in each of the last 5 years, averaging 369 points / year. Actively managing positions within the framework of the Signalling can produce significantly more and/or reduce risk accordingly.

If you would like to learn more about using the S/T Signalling System please get in touch.

Be prepared for what is coming next and trade with confidence:

For more detailed ongoing analysis of the developments in the S&P500 index on a daily basis, as well as my personal Buy and Sell Signal trigger levels, please Sign up for daily Alerts & Observations. This includes access to the Members Area for an archive of all of my alerts and updates and my Explanatory Notes pdf which gives detailed explanations on all of the concepts being discussed.

 

Around the Corner

"Don't let yourself get attached to anything you are not willing to walk out on in 30 seconds flat if you feel the heat around the corner."
Heat, dir. Michael Mann, (1995)

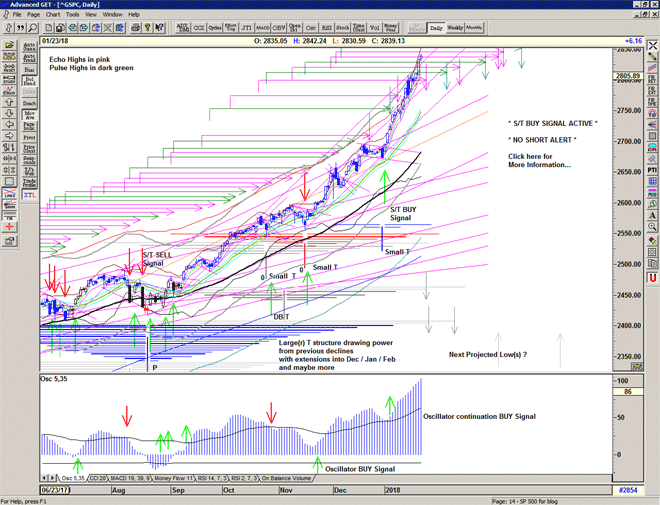
A gap up and go day, close at new all time highs. Relentless aint it.

Chart of S&P500 for 12 January 2018

Be prepared for whatever is coming next, and trade with confidence:

To receive detailed daily analysis, guidance and the updated daily Buy / Sell trigger levels being generated by the Trading the Line system before the market opens, and intraday alerts when appropriate, please become a Member and Sign up for Alerts & Observations – includes access to Members Area and the Explanatory Notes for all of the concepts discussed.

Disclaimer: This is the diary of a personal trading system, its methodology and the signals that it is producing. You are welcome to follow along but please understand that the information presented here is for educational purposes only. No recommendations are being made to buy, or sell stocks, options or futures contracts. Please consult your own financial advisor before making any investment decisions.

Opening the Mirror

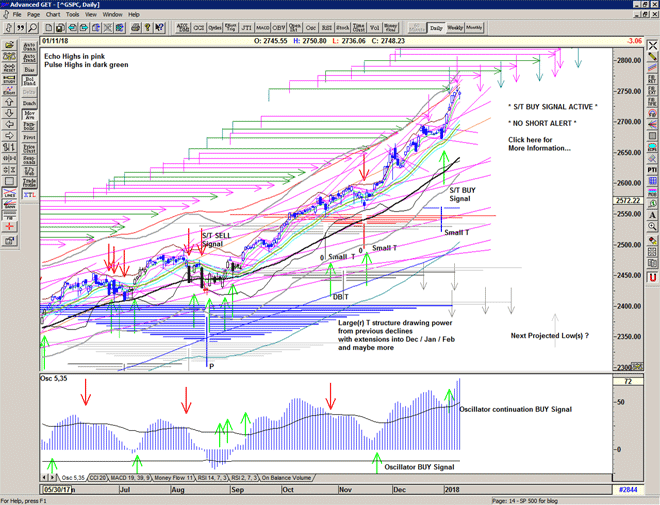
Recovery at the 5 from a gap down at the open, helping to relieve some of the pressure.

Chart of S&P500 for 11 January 2018

Be prepared for whatever is coming next, and trade with confidence:

To receive detailed daily analysis, guidance and the updated daily Buy / Sell trigger levels being generated by the Trading the Line system before the market opens, and intraday alerts when appropriate, please become a Member and Sign up for Alerts & Observations – includes access to Members Area and the Explanatory Notes for all of the concepts discussed.

Disclaimer: This is the diary of a personal trading system, its methodology and the signals that it is producing. You are welcome to follow along but please understand that the information presented here is for educational purposes only. No recommendations are being made to buy, or sell stocks, options or futures contracts. Please consult your own financial advisor before making any investment decisions.

Rubicon

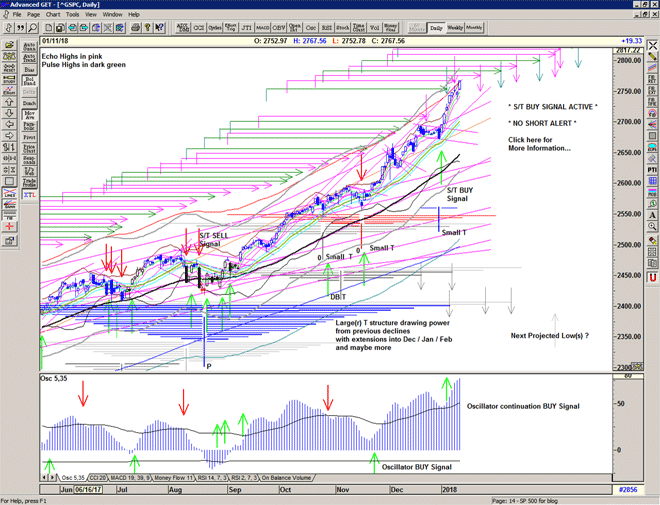
A token new high on an echo high.

Difficult not to think that we may have arrived at some kind of target, at the upper extreme, at a major projection for a high from the 2 main structures, and with some signs of deceleration and profit-taking.

However, the Buy Signal continues, and price may just need to catch up with itself.

Untitled-1

Be prepared for whatever is coming next, and trade with confidence:

To receive detailed daily analysis, guidance and the updated daily Buy / Sell trigger levels being generated by the Trading the Line system before the market opens, and intraday alerts when appropriate, please become a Member and Sign up for Alerts & Observations – includes access to Members Area and the Explanatory Notes for all of the concepts discussed.

Disclaimer: This is the diary of a personal trading system, its methodology and the signals that it is producing. You are welcome to follow along but please understand that the information presented here is for educational purposes only. No recommendations are being made to buy, or sell stocks, options or futures contracts. Please consult your own financial advisor before making any investment decisions.


Divas

Market still strong, well above the Buy Signal line, and climbing above the rising bollinger bands.

Today is another echo high, after which we may see some reduction in buying power, perhaps even some selling.

Chart of S&P500 for 09 January 2018

Be prepared for whatever is coming next, and trade with confidence:

To receive detailed daily analysis, guidance and the updated daily Buy / Sell trigger levels being generated by the Trading the Line system before the market opens, and intraday alerts when appropriate, please become a Member and Sign up for Alerts & Observations – includes access to Members Area and the Explanatory Notes for all of the concepts discussed.

Disclaimer: This is the diary of a personal trading system, its methodology and the signals that it is producing. You are welcome to follow along but please understand that the information presented here is for educational purposes only. No recommendations are being made to buy, or sell stocks, options or futures contracts. Please consult your own financial advisor before making any investment decisions.


Springfield

A very, very bullish start to the year, and a close within a few points of the upper extreme -  a phenomenon not seen since 01 March last year.

The next negotiation is an echo high early this week which is just after a couple of projections for highs from the larger T structure and the DB T structure.

Untitled-1

Be prepared for whatever is coming next, and trade with confidence:

To receive detailed daily analysis, guidance and the updated daily Buy / Sell trigger levels being generated by the Trading the Line system before the market opens, and intraday alerts when appropriate, please become a Member and Sign up for Alerts & Observations – includes access to Members Area and the Explanatory Notes for all of the concepts discussed.

Disclaimer: This is the diary of a personal trading system, its methodology and the signals that it is producing. You are welcome to follow along but please understand that the information presented here is for educational purposes only. No recommendations are being made to buy, or sell stocks, options or futures contracts. Please consult your own financial advisor before making any investment decisions.


Twelfth Night

“Be not afraid of greatness. Some are born great, some achieve greatness, and others have greatness thrust upon them.”
William Shakespeare, Twelfth Night

Market continues higher into the next projection of the Large(r) T structure, and DB T structure.
OSC oscillator showing renewed strength in momentum.

Chart of S&P500 for 05 January 2018


Be prepared for whatever is coming next, and trade with confidence:

To receive detailed daily analysis, guidance and the updated daily Buy / Sell trigger levels being generated by the Trading the Line system before the market opens, and intraday alerts when appropriate, please become a Member and Sign up for Alerts & Observations – includes access to Members Area and the Explanatory Notes for all of the concepts discussed.

Disclaimer: This is the diary of a personal trading system, its methodology and the signals that it is producing. You are welcome to follow along but please understand that the information presented here is for educational purposes only. No recommendations are being made to buy, or sell stocks, options or futures contracts. Please consult your own financial advisor before making any investment decisions.


Bathing on the roof

Your faith was strong but you needed proof
You saw her bathing on the roof
Her beauty and the moonlight overthrew ya
She tied you to a kitchen chair
She broke your throne, and she cut your hair
And from your lips she drew the hallelujah

Hallelujah
Hallelujah
Hallelujah
Hallelujah

Leonard Cohen, Hallelujah, 1984

As with anything in life, the first rule of trading is that you cannot know (for sure) what is going to happen next. It is therefore imperative that you surrender your beliefs and expectations at the door and trade what is happening and not what you think will happen. Yesterday price moved upwards through the S/T Buy signal level and it really is that simple. Buy a core position and hold on until the market makes a cover signal. Add to your position on weakness and take profits on strength, but keep the core position until the signal ends.

Green light / Amber light / Red light, currently we have a Green light and that means that the market is more likely to go up.

Today* is a pulse or impulse high and additional highs are projected by the T structures for late this week and early next week.

(I do apologise I said yesterday was a pulse high incorrectly, my software had skipped a day in the upcoming projections)

  Chart of S&P500 for 04 January 2018

Be prepared for whatever is coming next, and trade with confidence:

To receive detailed daily analysis, guidance and the updated daily Buy / Sell trigger levels being generated by the Trading the Line system before the market opens, and intraday alerts when appropriate, please become a Member and Sign up for Alerts & Observations – includes access to Members Area and the Explanatory Notes for all of the concepts discussed.

Disclaimer: This is the diary of a personal trading system, its methodology and the signals that it is producing. You are welcome to follow along but please understand that the information presented here is for educational purposes only. No recommendations are being made to buy, or sell stocks, options or futures contracts. Please consult your own financial advisor before making any investment decisions.


Perihelion

Market opens the year in true style with a gap up and go into a continuation BUY signal at 2686.

The extremely bullish nature of yesterday carries a warning with it as Put/Call ratios drop to a low not seen since December 2016 and suggests some element of panic-buying as well as short-covering.

Today is another pulse high, and so we might expect only a little follow through on the current buy signal, and the Osc oscillator sits just above the Sell signal level still suggesting that we will not see significantly higher prices, yet.

And so, some caution still remains, but with further upcoming projections from the T structures for tomorrow and Monday suggesting that we may also see another peak shortly, and another echo high early next week, perhaps to bring in some selling afterwards. Expect some choppiness and some volatility.

Chart of S&P 500 for 03 January 2018

Be prepared for whatever is coming next, and trade with confidence:

To receive detailed daily analysis, guidance and the updated daily Buy / Sell trigger levels being generated by the Trading the Line system before the market opens, and intraday alerts when appropriate, please become a Member and Sign up for Alerts & Observations – includes access to Members Area and the Explanatory Notes for all of the concepts discussed.

Disclaimer: This is the diary of a personal trading system, its methodology and the signals that it is producing. You are welcome to follow along but please understand that the information presented here is for educational purposes only. No recommendations are being made to buy, or sell stocks, options or futures contracts. Please consult your own financial advisor before making any investment decisions.