Colette

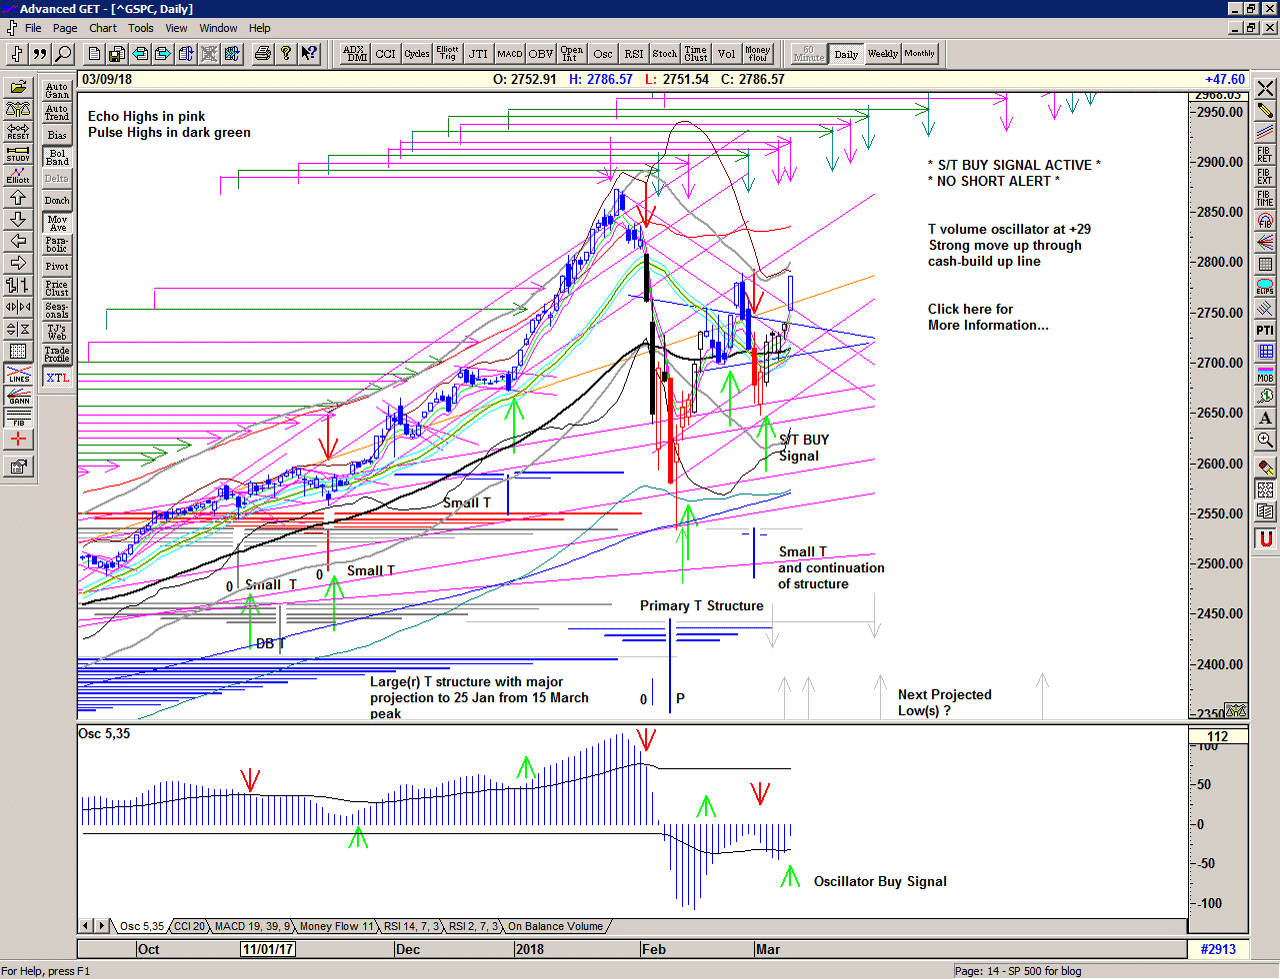
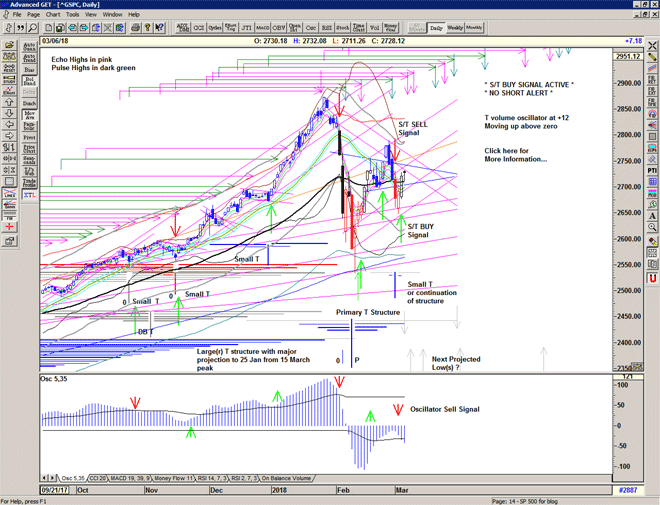
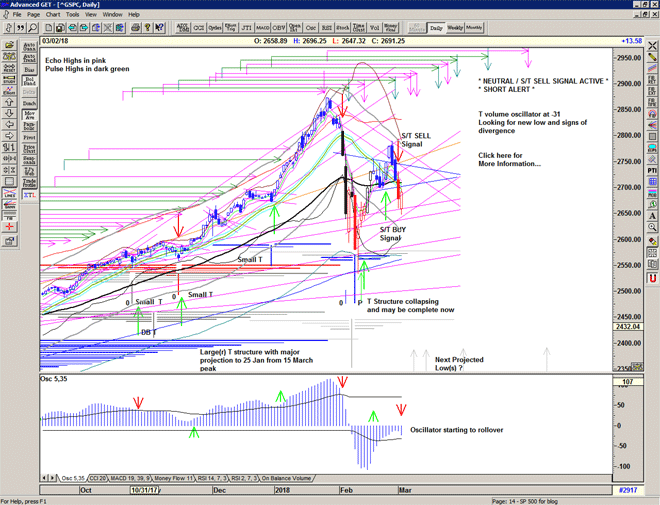
Initial weakness is bought strongly and the market moves rapidly higher through the Buy Signal line at 2713.

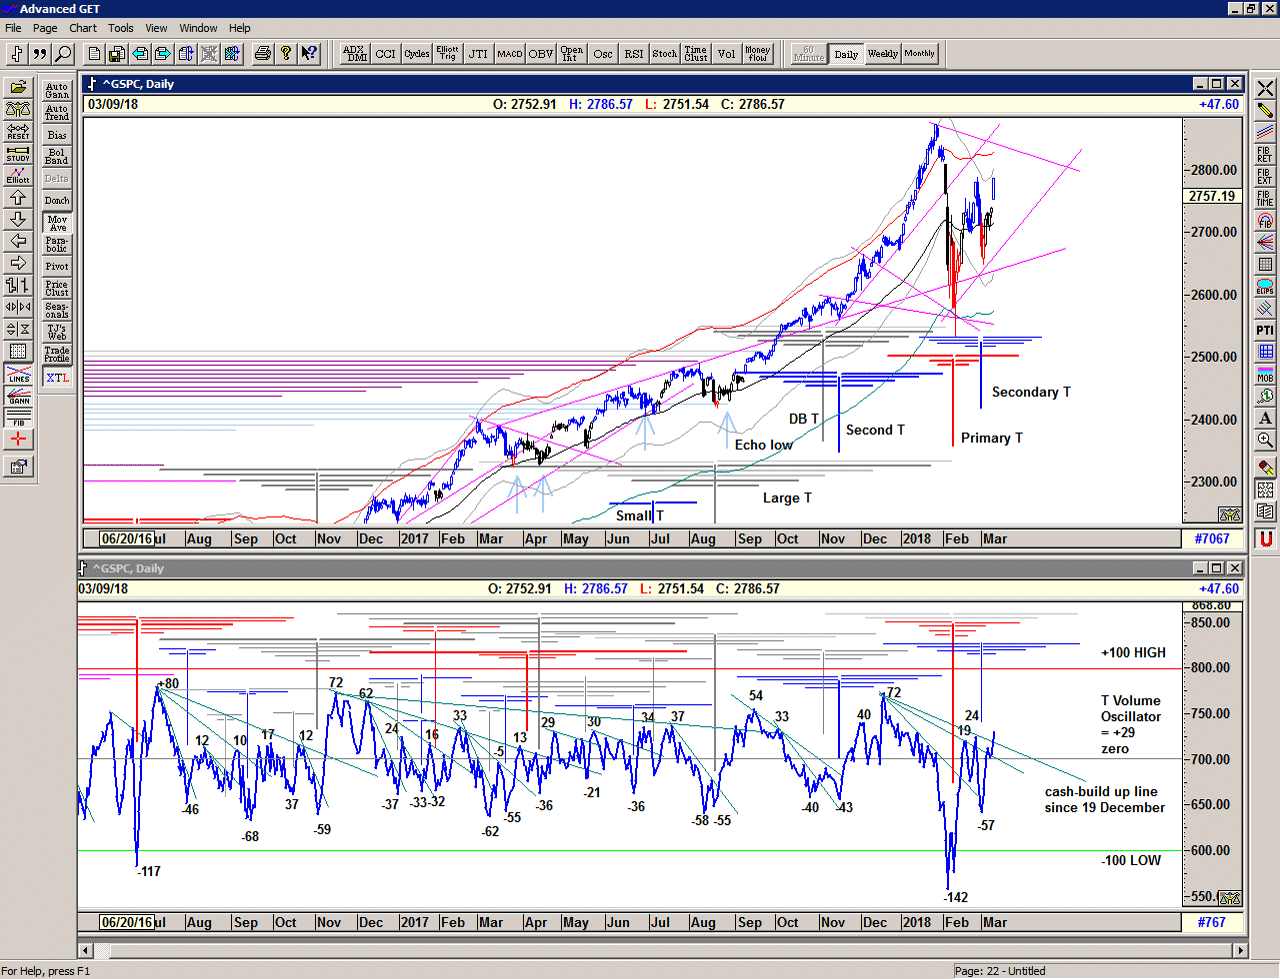
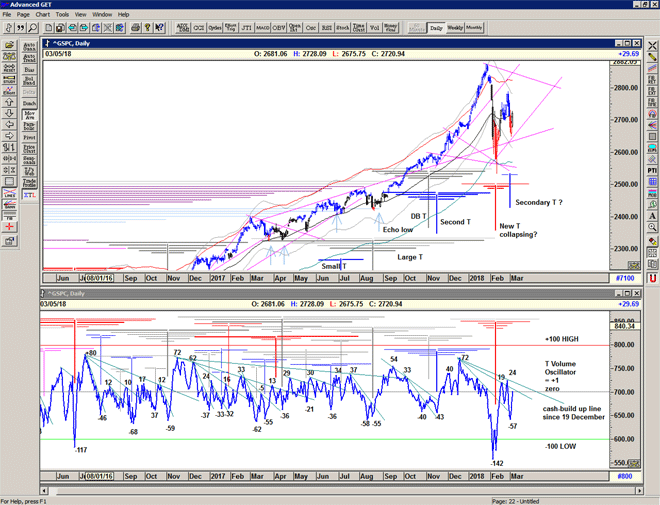
The strong move up is supported by the T volume oscillator which moves up to the zero level.

A positive development but further strength is still required to fully re-activate the cash-build up from December and release the market to the upside.

Chart of S&P 500 for 06 March 2018

Chart of S&P500 with Magic T volume oscillator for 06 March 2018

Be prepared for whatever is coming next, and trade with confidence:

To receive detailed daily analysis, guidance and the updated daily Buy / Sell trigger levels being generated by the Trading the Line system before the market opens, and intraday alerts when appropriate, please become a Member and Sign up for Alerts & Observations – includes access to Members Area and the Explanatory Notes for all of the concepts discussed.

Disclaimer: This is the diary of a personal trading system, its methodology and the signals that it is producing. You are welcome to follow along but please understand that the information presented here is for educational purposes only. No recommendations are being made to buy, or sell stocks, options or futures contracts. Please consult your own financial advisor before making any investment decisions.

 

Piran

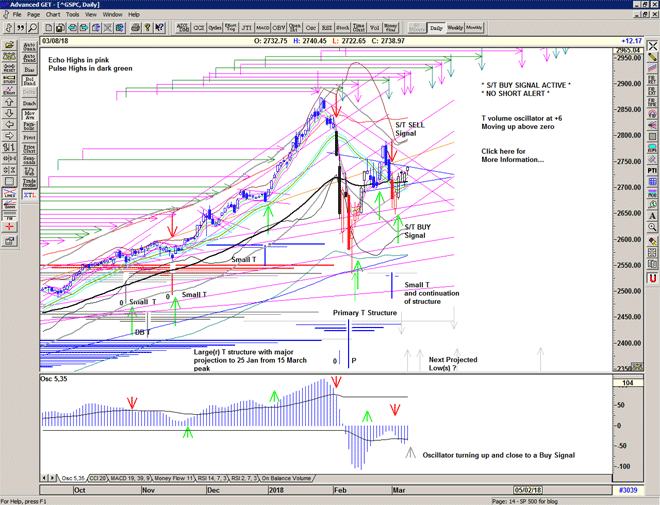
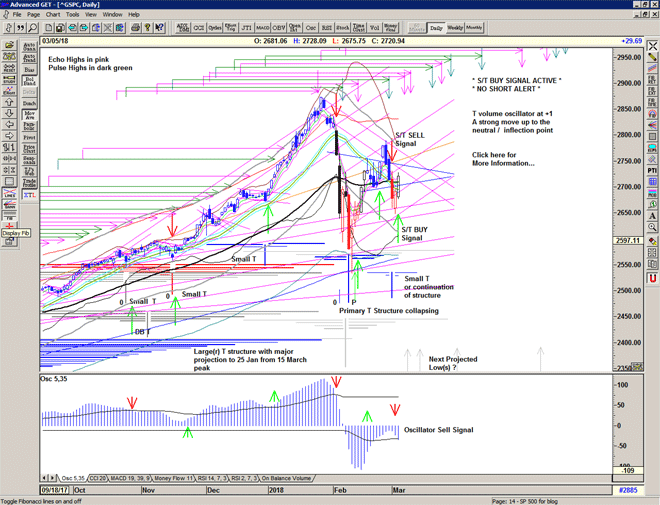
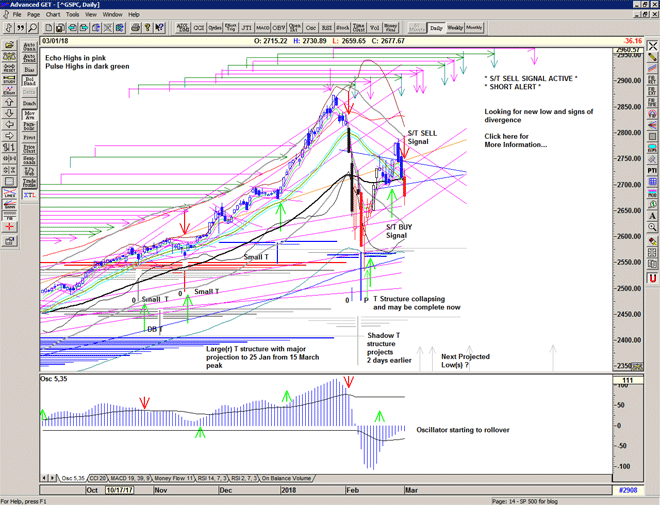
The market gapped down but after initial weakness held the 2650 level and found buyers throughout the day to recover into the close. No follow through to the Sell Signal, and although the signal is technically still active (but only just) it seems likely that the market is stabilising again.

Chart of S&P 500 for 05 March 2018

Be prepared for whatever is coming next, and trade with confidence:

To receive detailed daily analysis, guidance and the updated daily Buy / Sell trigger levels being generated by the Trading the Line system before the market opens, and intraday alerts when appropriate, please become a Member and Sign up for Alerts & Observations – includes access to Members Area and the Explanatory Notes for all of the concepts discussed.

Disclaimer: This is the diary of a personal trading system, its methodology and the signals that it is producing. You are welcome to follow along but please understand that the information presented here is for educational purposes only. No recommendations are being made to buy, or sell stocks, options or futures contracts. Please consult your own financial advisor before making any investment decisions.


Losing Ground

Losing ground
Under my feet
There's a low rumbling
There's a crack in the street
It's just no good
It's just no good anymore
Everything I do
Has been done before

Yeah I found my voice
Yeah I got nothing to say
The whole thing started
Cause my mind has gone away
I used to get high
Now I just get lost
I used to bark at the moon
The first one I came across

PJ Harvey, Losing Ground, 1996

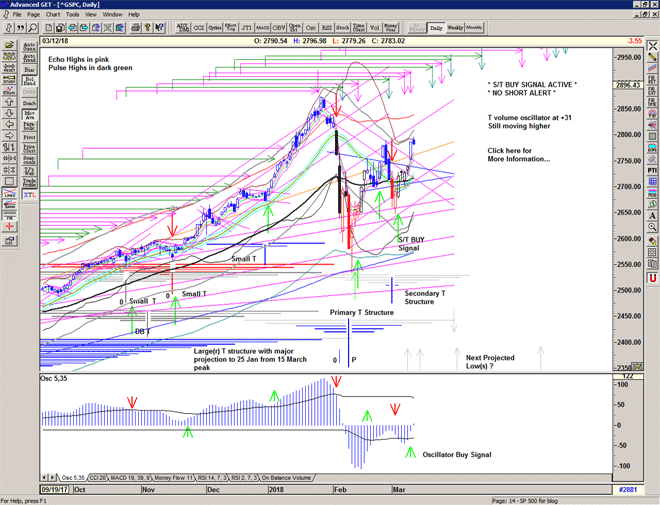
Initial weakness triggers a Sell signal at 2705 but this is quickly bought with a surge to 2730.

The selling resumes and another Sell Signal is triggered at 2705 in early afternoon trade with the market dropping quickly to find buyers at 2660 and a slight recovery into the close.

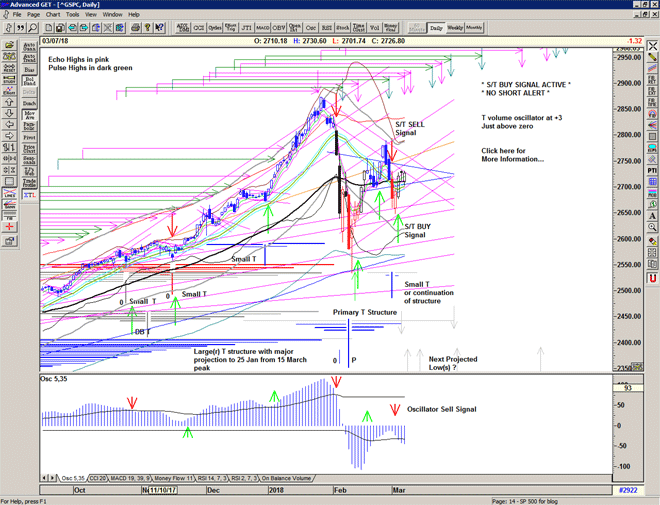
Sell Signal still active but suggest to take profits yesterday and re-assess this morning. Look for selling into bounces to continue if the market is going lower.

With weakness below the important pivot we are now looking for another low and a new structure to form in due course. Watch for divergence.

Chart of S&P 500 for 02 March 2018

Be prepared for whatever is coming next, and trade with confidence:

To receive detailed daily analysis, guidance and the updated daily Buy / Sell trigger levels being generated by the Trading the Line system before the market opens, and intraday alerts when appropriate, please become a Member and Sign up for Alerts & Observations – includes access to Members Area and the Explanatory Notes for all of the concepts discussed.

Disclaimer: This is the diary of a personal trading system, its methodology and the signals that it is producing. You are welcome to follow along but please understand that the information presented here is for educational purposes only. No recommendations are being made to buy, or sell stocks, options or futures contracts. Please consult your own financial advisor before making any investment decisions.


Yoke

Brothers be ye constant.
The yoke which with single mind ye have taken, bear ye to the end;
and whatsoever ye have seen with me and heard, keep and fulfil.

Saint David, † 589

The market continues to sell into any strength and continues lower into the close with a Cover Signal triggered at 2734.

The T volume oscillator drops again significantly in-line with the selling and this now establishes 26 February as an important high, putting the new T under increased pressure and it may now be collapsing or complete. This now identifies 24 January as an important beginning of the decline from the all time high.

This of course now places the market back at what was important support for another test of strength.

IF the selling continues we will be looking for another low to combine with the previous one and form another T structure in due course.

IF the market recovers rapidly, we have additional projections for highs in early and late March.

Chart of S&P 500 for 01 March 2018

Be prepared for whatever is coming next, and trade with confidence:

To receive detailed daily analysis, guidance and the updated daily Buy / Sell trigger levels being generated by the Trading the Line system before the market opens, and intraday alerts when appropriate, please become a Member and Sign up for Alerts & Observations – includes access to Members Area and the Explanatory Notes for all of the concepts discussed.

Disclaimer: This is the diary of a personal trading system, its methodology and the signals that it is producing. You are welcome to follow along but please understand that the information presented here is for educational purposes only. No recommendations are being made to buy, or sell stocks, options or futures contracts. Please consult your own financial advisor before making any investment decisions.


COVER Signal at 2734

Some initial buying interest but this morning the market was still selling into 'strength'.

An afternoon attempt at 2759 is sold into and we are quickly down towards 2735.

Relentless selling this afternoon with barely a bounce at 2730 and heading towards the previous support base around 2700.

Cover Signal at 2734 and confirmed at the close.

Wait for more stabilisation and the next signal.

Andalucia

The Market takes a look at 2789 and at the declining line from the all time high and quickly decides to put in a short-term peak. Profit-taking initiates a sell sequence with selling into each of the subsequent bounces throughout the rest of the day.

The T volume oscillator responds by dropping significantly below zero and this in itself is potentially a warning, as the strength of selling yesterday could indicate that there is more to come.

However, we are still above the Buy Signal level. The high Arms Index reading yesterday is high enough to suggest a wash-out may have occurred (or is nearly complete) and that a quick sell-off may be all that was required to release the pressure of the recent bullish adventure.

The exciting roller-coaster ride continues.

Chart of S&P 500 for 28 February 2018

Be prepared for whatever is coming next, and trade with confidence:

To receive detailed daily analysis, guidance and the updated daily Buy / Sell trigger levels being generated by the Trading the Line system before the market opens, and intraday alerts when appropriate, please become a Member and Sign up for Alerts & Observations – includes access to Members Area and the Explanatory Notes for all of the concepts discussed.

Disclaimer: This is the diary of a personal trading system, its methodology and the signals that it is producing. You are welcome to follow along but please understand that the information presented here is for educational purposes only. No recommendations are being made to buy, or sell stocks, options or futures contracts. Please consult your own financial advisor before making any investment decisions.


Birds Flyin’

Birds flyin' high, you know how I feel
Sun in the sky, you know how I feel
Breeze driftin' on by, you know how I feel
It's a new dawn, it's a new day, it's a new life for me
Yeah, it's a new dawn, it's a new day, it's a new life for me, ooooooooh
And I'm feelin' good

Nina Simone, Feeling Good, 1965
(Songwriters: Leslie Bricusse, Anthony Newley)

Pop!, gap up and go, as the market continues on its squeeze out of the congestion around the previous high and heads for…? Where?

The previous all time high? Maybe.

The Magic T volume oscillator moves up again and adds to the current strength of the structure.

The new large T structure projects highs in early March and then also potentially in late March. Plenty can happen inbetween.

Watch how price behaves at the declining resistance angles from the high and keep an eye on the rising support lines below.

Today brings with it a pulse high which may add a little profit-taking to the mix.

Chart of S&P 500 for 27 February 2018

Be prepared for whatever is coming next, and trade with confidence:

To receive detailed daily analysis, guidance and the updated daily Buy / Sell trigger levels being generated by the Trading the Line system before the market opens, and intraday alerts when appropriate, please become a Member and Sign up for Alerts & Observations – includes access to Members Area and the Explanatory Notes for all of the concepts discussed.

Disclaimer: This is the diary of a personal trading system, its methodology and the signals that it is producing. You are welcome to follow along but please understand that the information presented here is for educational purposes only. No recommendations are being made to buy, or sell stocks, options or futures contracts. Please consult your own financial advisor before making any investment decisions.


Tulsa

S/T Buy Signal at 2717

The market gaps up above the Buy Signal level at 2712, pulls back to find support and then heads higher.

A strong gap up and go and close at the highs type day, with just that a little bit of hesitation midday to remind us of the previous days' afternoon selling.

Strength above the Mid-Channel is a very positive development, and the T volume oscillator moves back above zero supporting the continued projections for highs in March.

Chart of S&P 500 for 24 February 2018

Be prepared for whatever is coming next, and trade with confidence:

To receive detailed daily analysis, guidance and the updated daily Buy / Sell trigger levels being generated by the Trading the Line system before the market opens, and intraday alerts when appropriate, please become a Member and Sign up for Alerts & Observations – includes access to Members Area and the Explanatory Notes for all of the concepts discussed.

Disclaimer: This is the diary of a personal trading system, its methodology and the signals that it is producing. You are welcome to follow along but please understand that the information presented here is for educational purposes only. No recommendations are being made to buy, or sell stocks, options or futures contracts. Please consult your own financial advisor before making any investment decisions.