Little Boy

"Little Boy" was the codename for the nuclear bomb dropped on the Japanese city of Hiroshima on 6 August 1945. It was the first nuclear weapon to be used in warfare.

Wikipedia

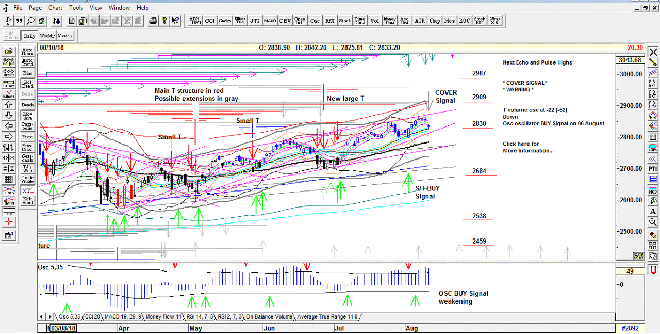
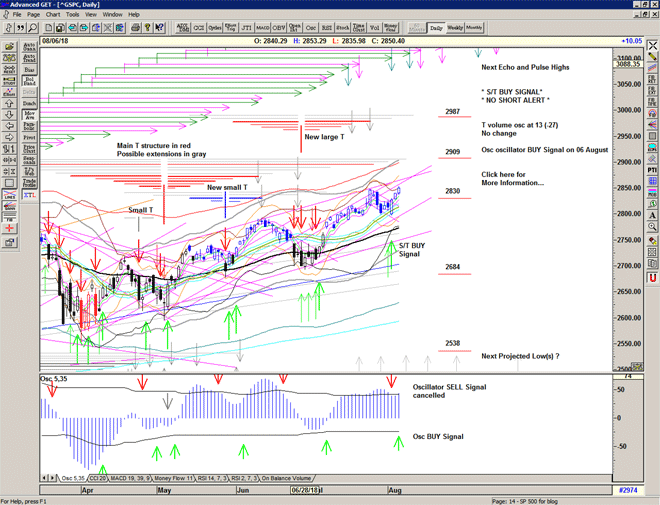
Strength above the Buy Signal line, and above the recent declining angle, finds the market looking at the recent highs again.

The oscillators improve and the market seems back on track.

Chart of S&P 500 for 04 August 2018

Be prepared for whatever is coming next, and trade with confidence:

To receive detailed daily analysis, guidance and the updated daily Buy / Sell trigger levels being generated by the Trading the Line system before the market opens, and intraday alerts when appropriate, please become a Member and Sign up for Alerts & Observations – includes access to Members Area and the Explanatory Notes for all of the concepts discussed.

Disclaimer: This is the diary of a personal trading system, its methodology and the signals that it is producing. You are welcome to follow along but please understand that the information presented here is for educational purposes only. No recommendations are being made to buy, or sell stocks, options or futures contracts. Please consult your own financial advisor before making any investment decisions.


Frontera

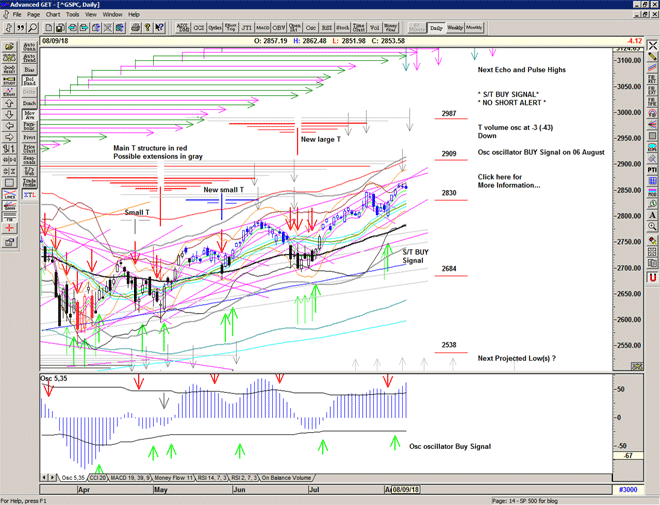
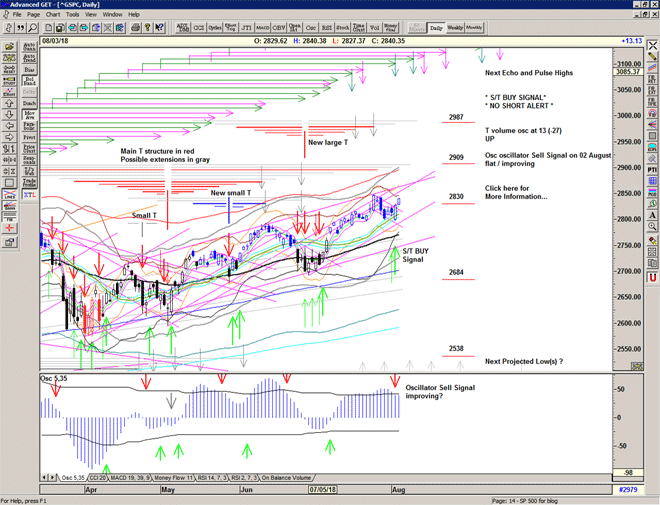
The market opens down just below the important 2800 level and rapidly moves higher, triggering an S/T Buy Signal as it moves up and holds above 2822 into the close.

Still some warnings as the Osc oscillator continues to decline and makes a 'Sell' Signal.

Chart of S&P 500 for 03 August

Be prepared for whatever is coming next, and trade with confidence:

To receive detailed daily analysis, guidance and the updated daily Buy / Sell trigger levels being generated by the Trading the Line system before the market opens, and intraday alerts when appropriate, please become a Member and Sign up for Alerts & Observations – includes access to Members Area and the Explanatory Notes for all of the concepts discussed.

Disclaimer: This is the diary of a personal trading system, its methodology and the signals that it is producing. You are welcome to follow along but please understand that the information presented here is for educational purposes only. No recommendations are being made to buy, or sell stocks, options or futures contracts. Please consult your own financial advisor before making any investment decisions.


Negrita

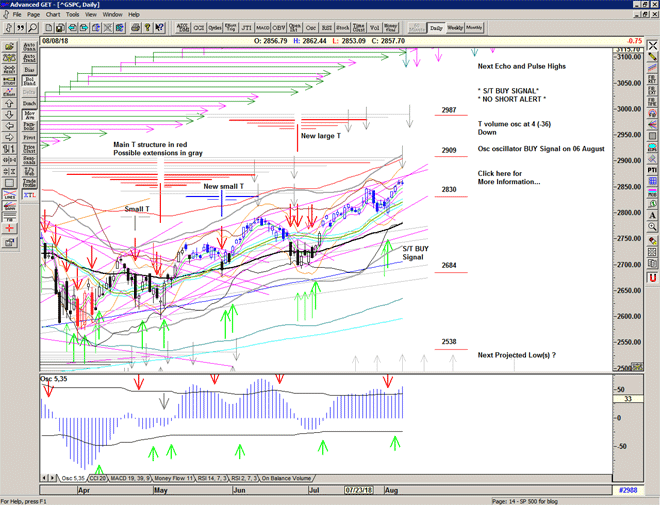
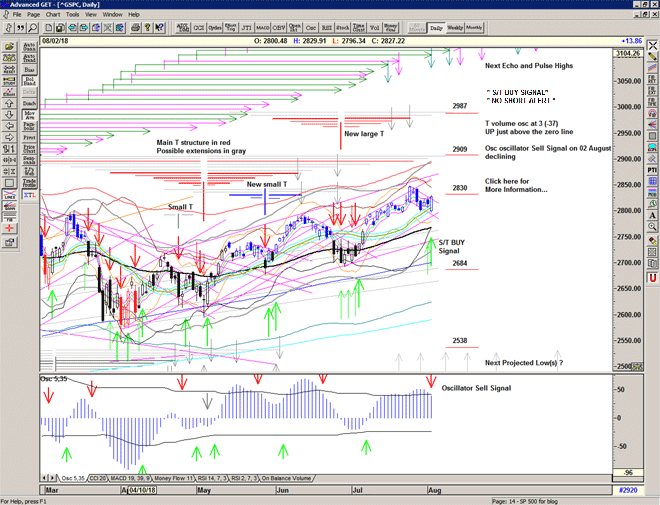
Another attempt at the Buy Signal level is sold down as the market shows strong resistance to price at 2825.

The T volume oscillator drops to zero and the Osc oscillator starts to decline – both flashing warnings.

The recent weakness continues and Futures are significantly lower this morning, it looks like we have a sell signal developing.

Chart of S&P500 for 02 August

Be prepared for whatever is coming next, and trade with confidence:

To receive detailed daily analysis, guidance and the updated daily Buy / Sell trigger levels being generated by the Trading the Line system before the market opens, and intraday alerts when appropriate, please become a Member and Sign up for Alerts & Observations – includes access to Members Area and the Explanatory Notes for all of the concepts discussed.

Disclaimer: This is the diary of a personal trading system, its methodology and the signals that it is producing. You are welcome to follow along but please understand that the information presented here is for educational purposes only. No recommendations are being made to buy, or sell stocks, options or futures contracts. Please consult your own financial advisor before making any investment decisions.


Lunasa

Did she wake you up
to tell you that
It was only a change of plan?
Dream up, dream up,
let me fill your cup
With the promise of a man.

Neil Young, Harvest, 1972

Lammas, Lughnasadh or Lúnasa – the ancient festival marking the beginning of the harvest season

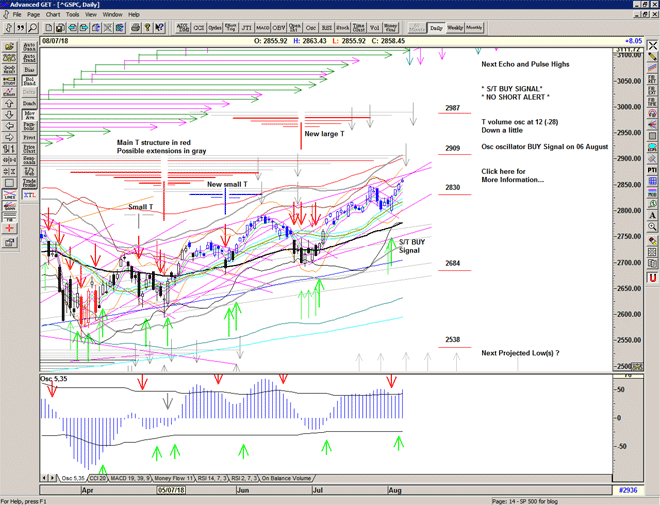
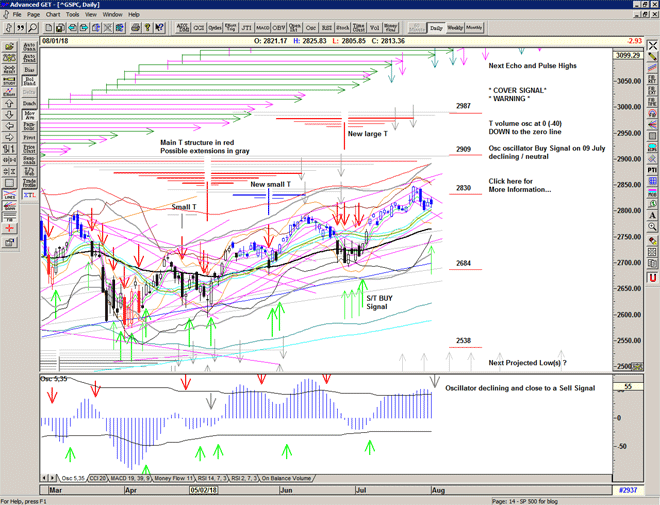
The market 'pops' at the open and makes a valient attempt on the Buy Signal level.

Still displaying some downward pressure.

The T volume oscillator rises but the Osc oscillator flattens off further indicating the slight reduction of momentum.

Chart of S&P 500 for 01 August 2018

Be prepared for whatever is coming next, and trade with confidence:

To receive detailed daily analysis, guidance and the updated daily Buy / Sell trigger levels being generated by the Trading the Line system before the market opens, and intraday alerts when appropriate, please become a Member and Sign up for Alerts & Observations – includes access to Members Area and the Explanatory Notes for all of the concepts discussed.

Disclaimer: This is the diary of a personal trading system, its methodology and the signals that it is producing. You are welcome to follow along but please understand that the information presented here is for educational purposes only. No recommendations are being made to buy, or sell stocks, options or futures contracts. Please consult your own financial advisor before making any investment decisions.


Ranger

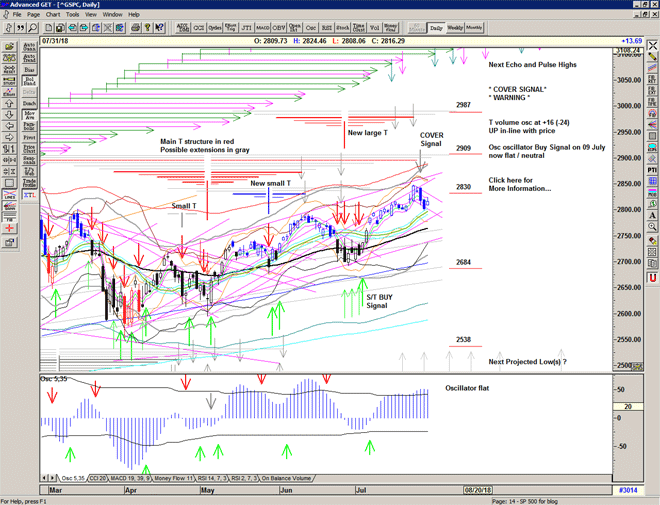
The market continues to retrace, finding some support at 2800 but now moving into a Warning Phase.

The T volume oscillator ticks up and the Osc oscillator turns flat.

Mixed signals and the risk of a more serious decline ahead seems high.

Chart of S&P 500 for 31 July 2018

Be prepared for whatever is coming next, and trade with confidence:

To receive detailed daily analysis, guidance and the updated daily Buy / Sell trigger levels being generated by the Trading the Line system before the market opens, and intraday alerts when appropriate, please become a Member and Sign up for Alerts & Observations – includes access to Members Area and the Explanatory Notes for all of the concepts discussed.

Disclaimer: This is the diary of a personal trading system, its methodology and the signals that it is producing. You are welcome to follow along but please understand that the information presented here is for educational purposes only. No recommendations are being made to buy, or sell stocks, options or futures contracts. Please consult your own financial advisor before making any investment decisions.


Falcon

The market sells down from the open, drops through 2820 and initiates a cover signal.

The bounce off 2807 is not enough to re-activate the Buy Signal and the market will need to re-establish its bullish intent.

Still, considering the drop, the oscillators remain positive for now.

Chart of S&P 500 for 29 July 2018

Be prepared for whatever is coming next, and trade with confidence:

To receive detailed daily analysis, guidance and the updated daily Buy / Sell trigger levels being generated by the Trading the Line system before the market opens, and intraday alerts when appropriate, please become a Member and Sign up for Alerts & Observations – includes access to Members Area and the Explanatory Notes for all of the concepts discussed.

Disclaimer: This is the diary of a personal trading system, its methodology and the signals that it is producing. You are welcome to follow along but please understand that the information presented here is for educational purposes only. No recommendations are being made to buy, or sell stocks, options or futures contracts. Please consult your own financial advisor before making any investment decisions.


Blood Moon

Catherine liked high places
High up, high up on the hills
A place for making noises
Like whales
Noises like the whales
Here she built a chapel
With her image
An image on the wall
A place where she could rest and
And a place where she could wash
And listen to the wind blowing

PJ Harvey, The Wind, 1998

_

A consolidation day just below the high relieving some of the pressure from the recent surge.

Chart of S&P 500 for 27 July 2018

Be prepared for whatever is coming next, and trade with confidence:

To receive detailed daily analysis, guidance and the updated daily Buy / Sell trigger levels being generated by the Trading the Line system before the market opens, and intraday alerts when appropriate, please become a Member and Sign up for Alerts & Observations – includes access to Members Area and the Explanatory Notes for all of the concepts discussed.

Disclaimer: This is the diary of a personal trading system, its methodology and the signals that it is producing. You are welcome to follow along but please understand that the information presented here is for educational purposes only. No recommendations are being made to buy, or sell stocks, options or futures contracts. Please consult your own financial advisor before making any investment decisions.


Explorer

He came riding fast like a phoenix out of fire flames
He came dressed in black with a cross bearing my name
He came bathed in light and the splendor and glory
I can't believe what the lord has finally sent me

PJ Harvey, The Dancer, 1995

_

The market grinds up to the 2830 pivot and then thrusts dramatically higher to 2846 – the price last seen on 26 January prior to the February collapse.

Mission accomplished?

Chart of S&P500 for 26 July 2018

Be prepared for whatever is coming next, and trade with confidence:

To receive detailed daily analysis, guidance and the updated daily Buy / Sell trigger levels being generated by the Trading the Line system before the market opens, and intraday alerts when appropriate, please become a Member and Sign up for Alerts & Observations – includes access to Members Area and the Explanatory Notes for all of the concepts discussed.

Disclaimer: This is the diary of a personal trading system, its methodology and the signals that it is producing. You are welcome to follow along but please understand that the information presented here is for educational purposes only. No recommendations are being made to buy, or sell stocks, options or futures contracts. Please consult your own financial advisor before making any investment decisions.