Leon

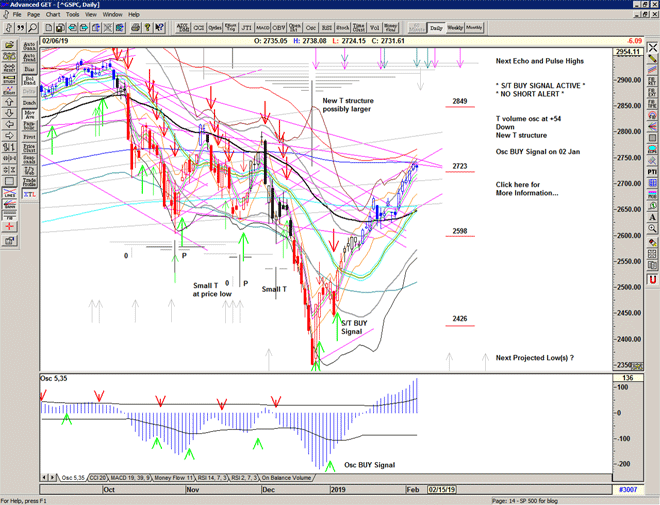
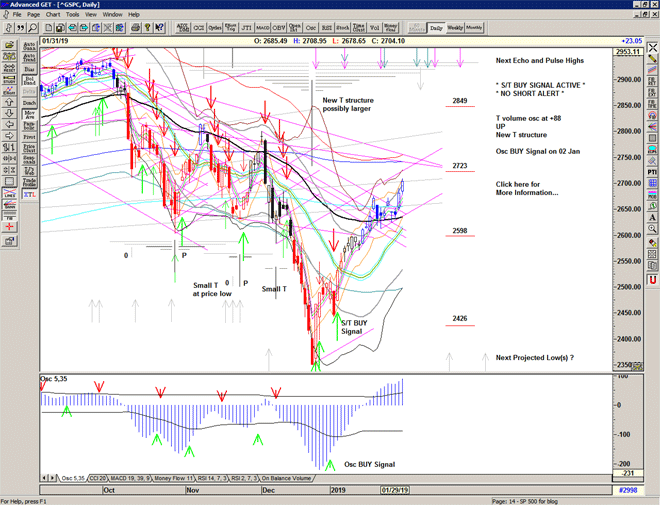
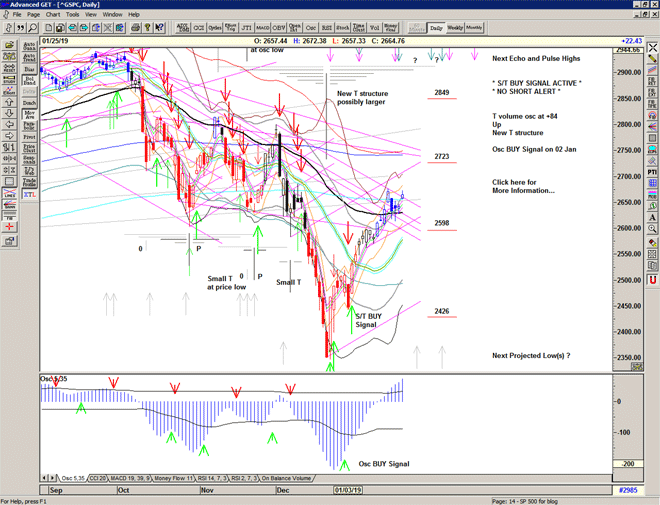
Strength above 2650 before the Fed and the market explodes higher on Fed-speak.

Chart of S&P 500 for 31 January 2019

Be prepared for whatever is coming next, and trade with confidence:

To receive detailed daily analysis, guidance and the updated daily Buy / Sell trigger levels being generated by the Trading the Line system before the market opens, and intraday alerts when appropriate, please become a Member and Sign up for Alerts & Observations – includes access to Members Area and the Explanatory Notes for all of the concepts discussed.

Disclaimer: This is the diary of a personal trading system, its methodology and the signals that it is producing. You are welcome to follow along but please understand that the information presented here is for educational purposes only. No recommendations are being made to buy, or sell stocks, options or futures contracts. Please consult your own financial advisor before making any investment decisions.


Saudade

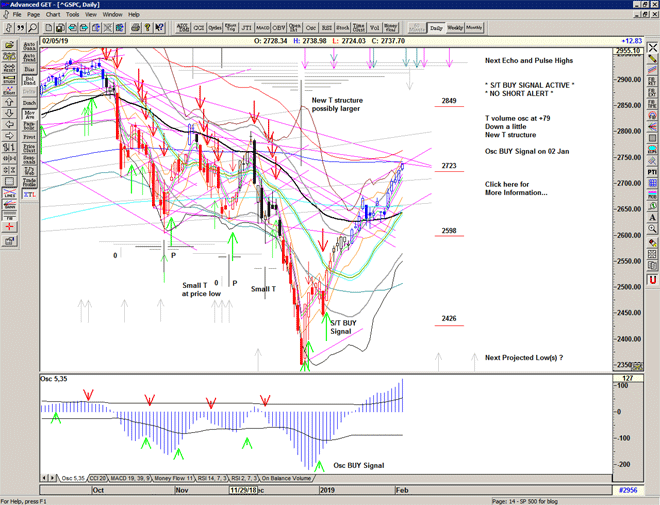
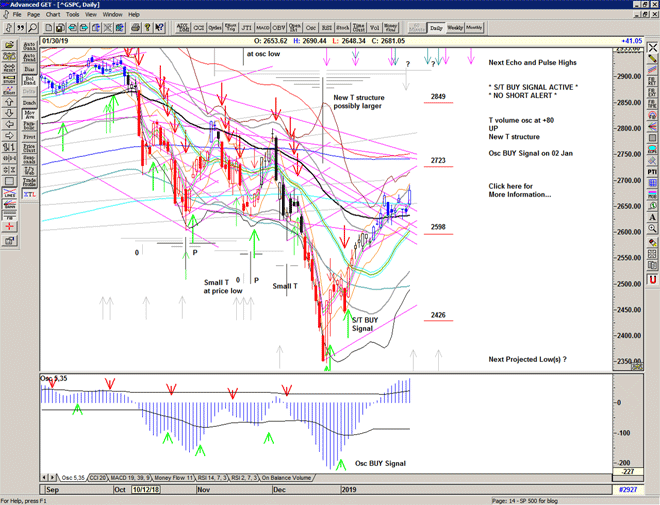
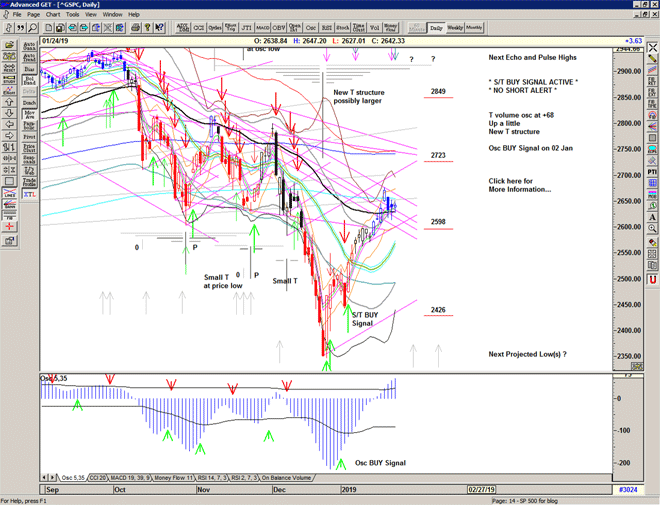
A look at 2650 and a look at 2631 triggering another cover signal intraday, but holding up into the close.

Buy signal continues for now.

Waiting for the Fed.

Chart of S&P500 for 30 January 2019

Be prepared for whatever is coming next, and trade with confidence:

To receive detailed daily analysis, guidance and the updated daily Buy / Sell trigger levels being generated by the Trading the Line system before the market opens, and intraday alerts when appropriate, please become a Member and Sign up for Alerts & Observations – includes access to Members Area and the Explanatory Notes for all of the concepts discussed.

Disclaimer: This is the diary of a personal trading system, its methodology and the signals that it is producing. You are welcome to follow along but please understand that the information presented here is for educational purposes only. No recommendations are being made to buy, or sell stocks, options or futures contracts. Please consult your own financial advisor before making any investment decisions.


Juniper

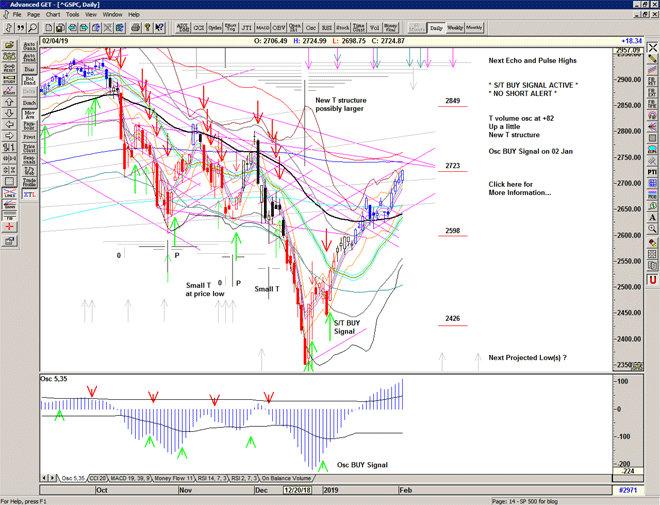
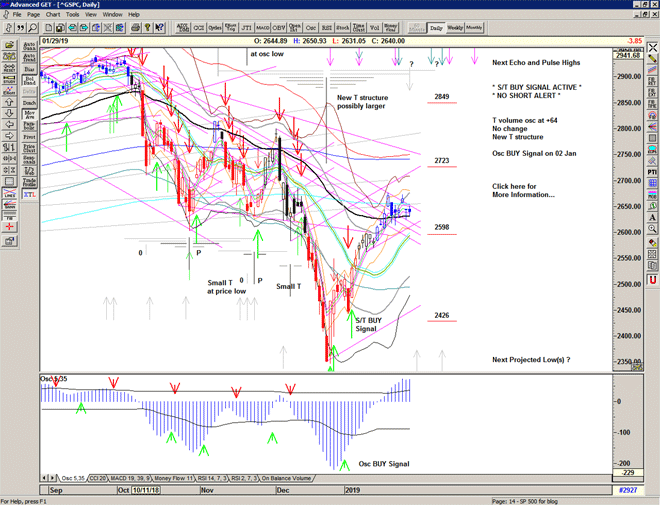
A heavy gap down triggering a cover signal, a look at 2625 and a grind back up above the Buy Signal line.

Holding up above recent support for now.

Chart of S&P 500 for 29 January 2019

Be prepared for whatever is coming next, and trade with confidence:

To receive detailed daily analysis, guidance and the updated daily Buy / Sell trigger levels being generated by the Trading the Line system before the market opens, and intraday alerts when appropriate, please become a Member and Sign up for Alerts & Observations – includes access to Members Area and the Explanatory Notes for all of the concepts discussed.

Disclaimer: This is the diary of a personal trading system, its methodology and the signals that it is producing. You are welcome to follow along but please understand that the information presented here is for educational purposes only. No recommendations are being made to buy, or sell stocks, options or futures contracts. Please consult your own financial advisor before making any investment decisions.


Serendipity

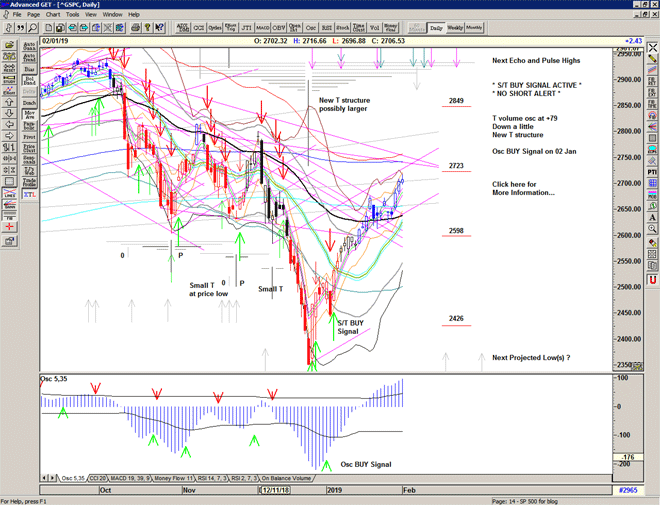
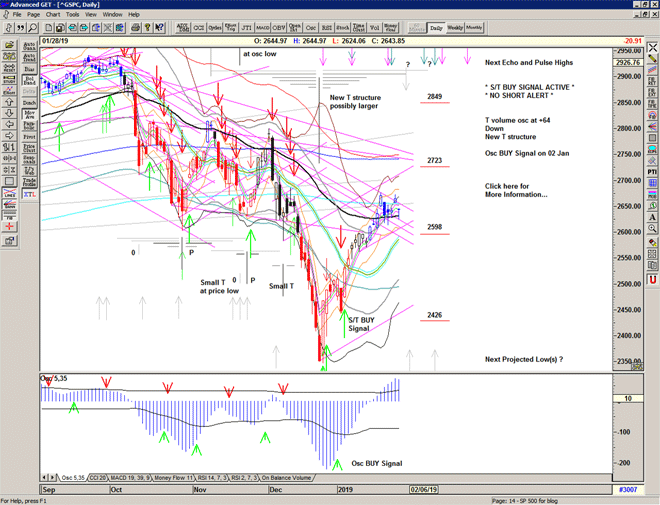
A gap up and go and another look at the 2670s.

Continuing to mark out an upper range.

Chart of S&P 500 for 28 January 2019

Be prepared for whatever is coming next, and trade with confidence:

To receive detailed daily analysis, guidance and the updated daily Buy / Sell trigger levels being generated by the Trading the Line system before the market opens, and intraday alerts when appropriate, please become a Member and Sign up for Alerts & Observations – includes access to Members Area and the Explanatory Notes for all of the concepts discussed.

Disclaimer: This is the diary of a personal trading system, its methodology and the signals that it is producing. You are welcome to follow along but please understand that the information presented here is for educational purposes only. No recommendations are being made to buy, or sell stocks, options or futures contracts. Please consult your own financial advisor before making any investment decisions.


Burns

But pleasures are like poppies spread,
You seize the flower, it's bloom is shed;
Or, like the snow-fall in the river,
A moment white, then melts forever.

Robert Burns, Tam O'Shanter, 1791

A choppy inside day as the market holds up above recent support.

The Buy Signal continues.

Chart of S&P 500 for 25 January 2019

Be prepared for whatever is coming next, and trade with confidence:

To receive detailed daily analysis, guidance and the updated daily Buy / Sell trigger levels being generated by the Trading the Line system before the market opens, and intraday alerts when appropriate, please become a Member and Sign up for Alerts & Observations – includes access to Members Area and the Explanatory Notes for all of the concepts discussed.

Disclaimer: This is the diary of a personal trading system, its methodology and the signals that it is producing. You are welcome to follow along but please understand that the information presented here is for educational purposes only. No recommendations are being made to buy, or sell stocks, options or futures contracts. Please consult your own financial advisor before making any investment decisions.


Alasitas

An Echo high – a gap up takes a look at 2653 before a steep decline into yesterday's support area in another challenge to the current Buy Signal.

Afternoon strength takes the market back above the Buy Signal line.

Chart of S&P 500 for 24 January 2019

Be prepared for whatever is coming next, and trade with confidence:

To receive detailed daily analysis, guidance and the updated daily Buy / Sell trigger levels being generated by the Trading the Line system before the market opens, and intraday alerts when appropriate, please become a Member and Sign up for Alerts & Observations – includes access to Members Area and the Explanatory Notes for all of the concepts discussed.

Disclaimer: This is the diary of a personal trading system, its methodology and the signals that it is producing. You are welcome to follow along but please understand that the information presented here is for educational purposes only. No recommendations are being made to buy, or sell stocks, options or futures contracts. Please consult your own financial advisor before making any investment decisions.


Exchange

A gap down and a steady decline is defended at the important 2626 level triggering a cover signal but last minute buying keeps the market above the Buy Signal level, for now.

Chart of S&P 500 for 23 January 2019

Be prepared for whatever is coming next, and trade with confidence:

To receive detailed daily analysis, guidance and the updated daily Buy / Sell trigger levels being generated by the Trading the Line system before the market opens, and intraday alerts when appropriate, please become a Member and Sign up for Alerts & Observations – includes access to Members Area and the Explanatory Notes for all of the concepts discussed.

Disclaimer: This is the diary of a personal trading system, its methodology and the signals that it is producing. You are welcome to follow along but please understand that the information presented here is for educational purposes only. No recommendations are being made to buy, or sell stocks, options or futures contracts. Please consult your own financial advisor before making any investment decisions.


Out of the Box

Welcome to the Trading the Line Special Report.

Since my last report the market has continued to surge higher shrugging off the possibility of any weakness at that time and at the critical 2600 level.

As mentioned, the first major projection for a high from the new T structure was 14 January with the expectation of a pullback of some kind last week, and that put us on alert to the possibility of another rapid decline.

As we have seen, the shallowest of pullbacks on 14 January provided no more than entry for a continuation higher and the current S/T Buy signal has continued without a cover signal. In effect this confirms the strength of the T structure overall, and is activating the next projection, from the earlier high on 08 November for another high at the end of January, and quite possibly beyond.

Daily chart of S&P 500 for 22 January 2019

Save the image to your desktop to view a larger version

As we can see in the chart below, the very strong oscillator – an indcation of buying power in the market as a whole – has fully supported the recent move higher which has now taken the market above some of the potential obstacles to a recovery.

The collapse in price below 2625 in November opened Pandora's Box of price discovery as the market quickly dropped throughout December, and so, should we now assume that the recovery back above 2625 will set the path back to 2800 and beyond?

In this bi-polar market there seems to be little choice, either down relentlessly or up relentlessly.

Would I be correct in saying that this bi-polar characteristic is increasing with more dramatic movement up or down? And if so, is this, in of itself a warning of something more significant to come…?

Could this expanding range be described as a megaphone?

Chart of S&P 500 for 22 January 2019

Save the image to your desktop to view a larger version

Zooming out to the weekly chart contextualizes the market's recent activity of pushing higher and lower in a range that appears to be increasing.

As you can see 2800 presents itself as strong resistance to higher prices with the possibility of a re-test of the panic low and perhaps even lower, but if 2800 is overcome this should re-open the possibility of another all time high.

Weekly Chart of S&P 500 for 22 January 2019

Save the image to your desktop to view a larger version

As we can see in the monthly chart the strong bounce back above the warning level of 2622 is very encouraging but still well within the context of either a full recovery or a dead-cat bounce . The next negotiation is the down-trending monthly 10 ema currently at about 2735 and what happens in this area – if reached – will be revealing.

Monthly chart of S&P 500 for 22 January 2019

Save the image to your desktop to view a larger version

All in all, 2019 has started with a move that continues the dynamic range of 2018 – far beyond the experience of previous years. We should expect price volatility to continue and trade accordingly. This is a Brave New World.

Regardless of whether the market can continue to recover or whether deeper low(s) are ahead of us, the simplicity of the proprietary price based S/T Signalling System continues to keep us on the correct side of the market, providing a timely Buy Signal in early January that is still active.

If you would like to learn more about using the S/T Signalling System please get in touch.

Be prepared for whatever is coming next, and trade with confidence:

To receive detailed daily analysis, guidance and the updated daily Buy / Sell trigger levels being generated by the Trading the Line system before the market opens, and intraday alerts when appropriate, please become a Member and Sign up for Alerts & Observations – includes access to Members Area and the Explanatory Notes for all of the concepts discussed.

Disclaimer: This is the diary of a personal trading system, its methodology and the signals that it is producing. You are welcome to follow along but please understand that the information presented here is for educational purposes only. No recommendations are being made to buy, or sell stocks, options or futures contracts. Please consult your own financial advisor before making any investment decisions.


Dream

I still have a dream, a dream deeply rooted in the American dream
– one day this nation will rise up and live up to its creed,
"We hold these truths to be self evident: that all men are created equal."
I have a dream …

Martin Luther King Jr. (1963)

The market continues higher putting the December 'nightmare' behind with strength that, for now, would have us believe that the panic is over.

Chart of S&P500 for 22 January 2019

Be prepared for whatever is coming next, and trade with confidence:

To receive detailed daily analysis, guidance and the updated daily Buy / Sell trigger levels being generated by the Trading the Line system before the market opens, and intraday alerts when appropriate, please become a Member and Sign up for Alerts & Observations – includes access to Members Area and the Explanatory Notes for all of the concepts discussed.

Disclaimer: This is the diary of a personal trading system, its methodology and the signals that it is producing. You are welcome to follow along but please understand that the information presented here is for educational purposes only. No recommendations are being made to buy, or sell stocks, options or futures contracts. Please consult your own financial advisor before making any investment decisions.


Prisca

The market finds additional strength and the current Buy Signal continues with a push up through the important 2626 level – the major pivot which also coincidentally lies at the same level that opened up Pandora's Box.

Are we reaching out of the box?

Chart of S&P 500 for 18 January 2019

Be prepared for whatever is coming next, and trade with confidence:

To receive detailed daily analysis, guidance and the updated daily Buy / Sell trigger levels being generated by the Trading the Line system before the market opens, and intraday alerts when appropriate, please become a Member and Sign up for Alerts & Observations – includes access to Members Area and the Explanatory Notes for all of the concepts discussed.

Disclaimer: This is the diary of a personal trading system, its methodology and the signals that it is producing. You are welcome to follow along but please understand that the information presented here is for educational purposes only. No recommendations are being made to buy, or sell stocks, options or futures contracts. Please consult your own financial advisor before making any investment decisions.