Fabric

Market chopping around at 3000.

Strong selling at the gap up open, but buying back and pushing higher as the market takes profit and re-cycles.

Price continues to be bullish, but breadth drops a little.

Chart of S&P 500 for 12 July 2019

Be prepared for whatever is coming next, and trade with confidence:

To receive detailed daily analysis, guidance and the updated daily Buy / Sell trigger levels being generated by the Trading the Line system before the market opens, and intraday alerts when appropriate, please become a Member and Sign up for Alerts & Observations – includes access to Members Area and the Explanatory Notes for all of the concepts discussed.

Disclaimer: This is the diary of a personal trading system, its methodology and the signals that it is producing. You are welcome to follow along but please understand that the information presented here is for educational purposes only. No recommendations are being made to buy, or sell stocks, options or futures contracts. Please consult your own financial advisor before making any investment decisions.


Speculation

Although this may be a most difficult thing, if one will do it, it can be done.
There is nothing that one should suppose cannot be done.

Tsunetomo Yamamoto, Hagakure: The Book of the Samurai, 1716

The market gaps higher and visits 3000 for the first time, triggering some initial heavy profit-taking.

Chart of S&P 500 for 11 July 2019

Be prepared for whatever is coming next, and trade with confidence:

To receive detailed daily analysis, guidance and the updated daily Buy / Sell trigger levels being generated by the Trading the Line system before the market opens, and intraday alerts when appropriate, please become a Member and Sign up for Alerts & Observations – includes access to Members Area and the Explanatory Notes for all of the concepts discussed.

Disclaimer: This is the diary of a personal trading system, its methodology and the signals that it is producing. You are welcome to follow along but please understand that the information presented here is for educational purposes only. No recommendations are being made to buy, or sell stocks, options or futures contracts. Please consult your own financial advisor before making any investment decisions.


Warrior

Move swift as the Wind and closely-formed as the Wood.
Attack like the Fire and be still as the Mountain.

Sun Tzu, The Art of War, 5th century BC

A gap down just below the Buy Signal line is met with strength and price pushes back higher.

Chart of S&P 500 for 10 July 2019

Be prepared for whatever is coming next, and trade with confidence:

To receive detailed daily analysis, guidance and the updated daily Buy / Sell trigger levels being generated by the Trading the Line system before the market opens, and intraday alerts when appropriate, please become a Member and Sign up for Alerts & Observations – includes access to Members Area and the Explanatory Notes for all of the concepts discussed.

Disclaimer: This is the diary of a personal trading system, its methodology and the signals that it is producing. You are welcome to follow along but please understand that the information presented here is for educational purposes only. No recommendations are being made to buy, or sell stocks, options or futures contracts. Please consult your own financial advisor before making any investment decisions.


Starfish

The market gaps back down into the channel.

The Buy Signal continues for now, marking the range prior to the next move.

Some signs of deceleration in breadth.

Chart of S&P 500 for 09 July 2019

Be prepared for whatever is coming next, and trade with confidence:

To receive detailed daily analysis, guidance and the updated daily Buy / Sell trigger levels being generated by the Trading the Line system before the market opens, and intraday alerts when appropriate, please become a Member and Sign up for Alerts & Observations – includes access to Members Area and the Explanatory Notes for all of the concepts discussed.

Disclaimer: This is the diary of a personal trading system, its methodology and the signals that it is producing. You are welcome to follow along but please understand that the information presented here is for educational purposes only. No recommendations are being made to buy, or sell stocks, options or futures contracts. Please consult your own financial advisor before making any investment decisions.


Dingle

The market pulls back for a re-test of the 2970s after the pulse high, before moving back higher.

Chart of S&P500 for 08 July 2019

Be prepared for whatever is coming next, and trade with confidence:

To receive detailed daily analysis, guidance and the updated daily Buy / Sell trigger levels being generated by the Trading the Line system before the market opens, and intraday alerts when appropriate, please become a Member and Sign up for Alerts & Observations – includes access to Members Area and the Explanatory Notes for all of the concepts discussed.

Disclaimer: This is the diary of a personal trading system, its methodology and the signals that it is producing. You are welcome to follow along but please understand that the information presented here is for educational purposes only. No recommendations are being made to buy, or sell stocks, options or futures contracts. Please consult your own financial advisor before making any investment decisions.


Maverick

"I feel the need, the need for speed."

Top Gun, 1986, Dir: Tony Scott

A gap up and go heads for 3000 for Independence.

Chart of S&P 500 for 07 July 2019

Be prepared for whatever is coming next, and trade with confidence:

To receive detailed daily analysis, guidance and the updated daily Buy / Sell trigger levels being generated by the Trading the Line system before the market opens, and intraday alerts when appropriate, please become a Member and Sign up for Alerts & Observations – includes access to Members Area and the Explanatory Notes for all of the concepts discussed.

Disclaimer: This is the diary of a personal trading system, its methodology and the signals that it is producing. You are welcome to follow along but please understand that the information presented here is for educational purposes only. No recommendations are being made to buy, or sell stocks, options or futures contracts. Please consult your own financial advisor before making any investment decisions.

Sirius

Priam saw him first, with his old man's eyes,
A single point of light on Troy's dusty plain.
Sirius rises late in the dark, liquid sky
On summer nights, star of stars,
Orion's Dog they call it, brightest
Of all, but an evil portent, bringing heat
And fevers to suffering humanity.
Achilles' bronze gleamed like this as he ran.

Homer, The Iliad
(from Stanley Lombardo, Homer, 1997)

A choppy day with price ultimately resolving to the upside in a late afternoon surge.

Buy Signal continues.

Chart of S&P 500 for 03 July 2019

Be prepared for whatever is coming next, and trade with confidence:

To receive detailed daily analysis, guidance and the updated daily Buy / Sell trigger levels being generated by the Trading the Line system before the market opens, and intraday alerts when appropriate, please become a Member and Sign up for Alerts & Observations – includes access to Members Area and the Explanatory Notes for all of the concepts discussed.

Disclaimer: This is the diary of a personal trading system, its methodology and the signals that it is producing. You are welcome to follow along but please understand that the information presented here is for educational purposes only. No recommendations are being made to buy, or sell stocks, options or futures contracts. Please consult your own financial advisor before making any investment decisions.


Medusa

A huge gap up into virgin territory triggers some heavy profit-taking at a new all time high.

Chart of S&P 500 for 02 July 2019

Be prepared for whatever is coming next, and trade with confidence:

To receive detailed daily analysis, guidance and the updated daily Buy / Sell trigger levels being generated by the Trading the Line system before the market opens, and intraday alerts when appropriate, please become a Member and Sign up for Alerts & Observations – includes access to Members Area and the Explanatory Notes for all of the concepts discussed.

Disclaimer: This is the diary of a personal trading system, its methodology and the signals that it is producing. You are welcome to follow along but please understand that the information presented here is for educational purposes only. No recommendations are being made to buy, or sell stocks, options or futures contracts. Please consult your own financial advisor before making any investment decisions.


Maspasi

Maspasi or Keti Koti: The chains are cut…

The market gaps up above 2932 triggering an S/T Buy Signal which is confirmed with the closing surge in anticipation of positive expectations.

Chart of S&P 500 for 01 July 2019

Be prepared for whatever is coming next, and trade with confidence:

To receive detailed daily analysis, guidance and the updated daily Buy / Sell trigger levels being generated by the Trading the Line system before the market opens, and intraday alerts when appropriate, please become a Member and Sign up for Alerts & Observations – includes access to Members Area and the Explanatory Notes for all of the concepts discussed.

Disclaimer: This is the diary of a personal trading system, its methodology and the signals that it is producing. You are welcome to follow along but please understand that the information presented here is for educational purposes only. No recommendations are being made to buy, or sell stocks, options or futures contracts. Please consult your own financial advisor before making any investment decisions.


Vespa

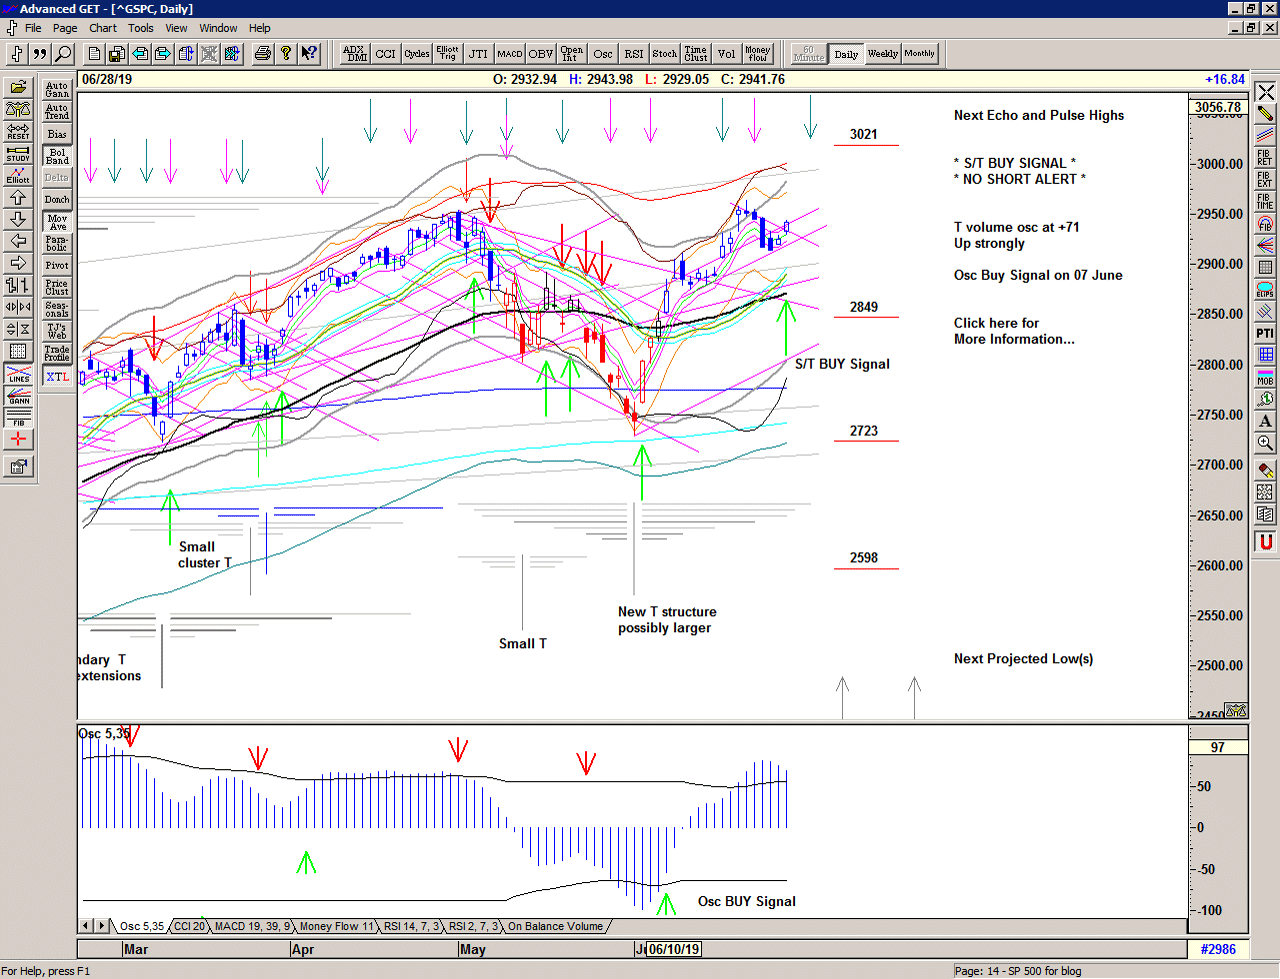
A Bear Market Warning in late May is quickly cancelled as the market rapidly recovers with a Buy Signal on 04 June seeing new all time highs before backing off at the echo high on 24 June.

Some rapid selling from the high finds support around 2915 and subsequent recovery triggers a new Buy Signal on Friday 28 June.

You can't make this stuff up.

Daily chart of S&P 500 for 01 July 2019

Save the image to your desktop to view a larger version

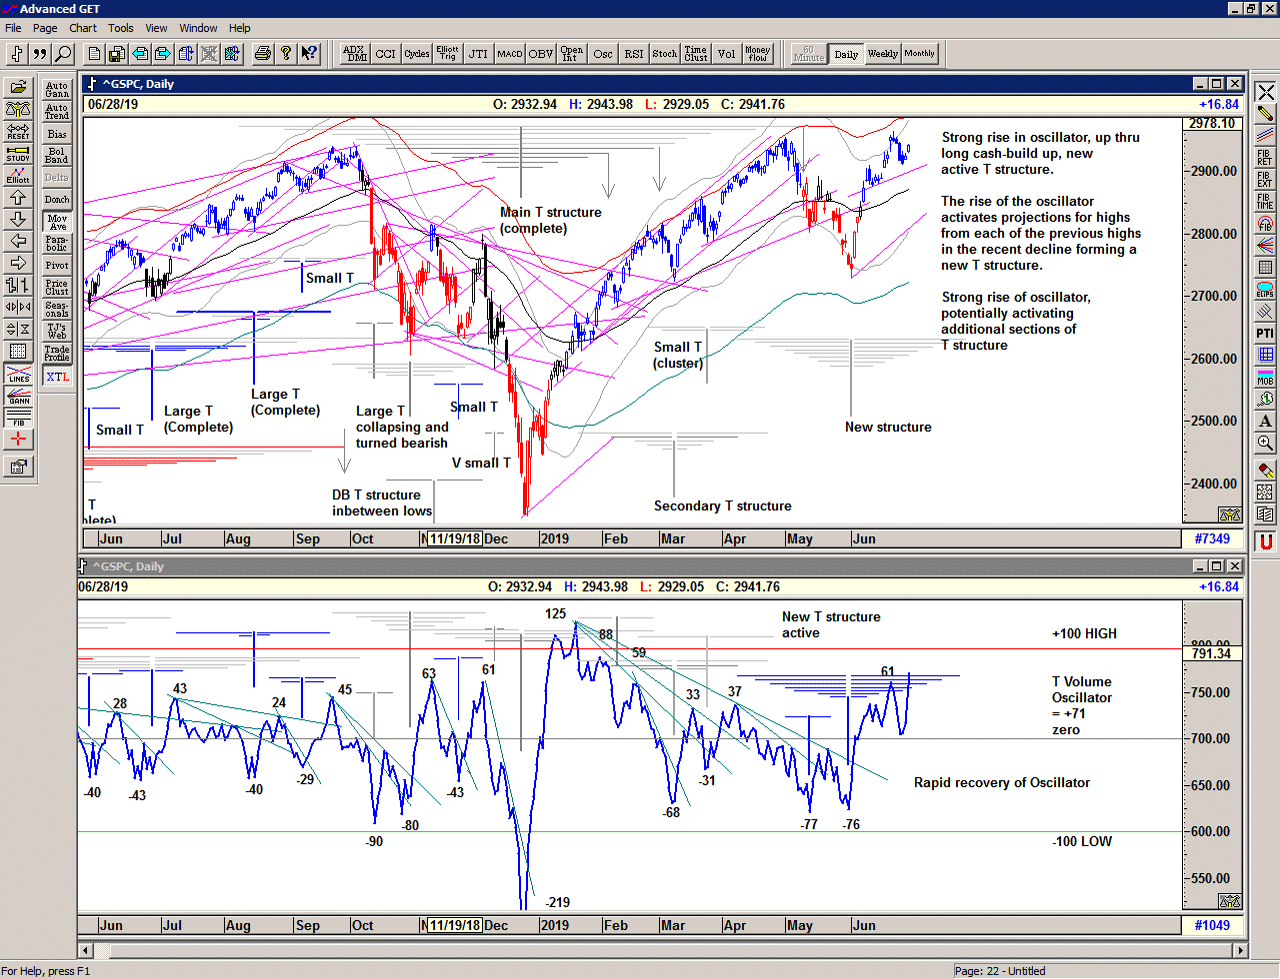
As we can see in the chart below with the T volume oscillator*, the 04 June recovery was accompanied by a rapid rise in the T volume oscillator up through the declining cash build-up line and this in turn describes a new T structure, activating projections from the previous highs in price and/or oscillator.

* The T volume oscillator is an indication of Buying Power within the market as a whole

Chart of S&P 500 for 01 July 2019

Save the image to your desktop to view a larger version

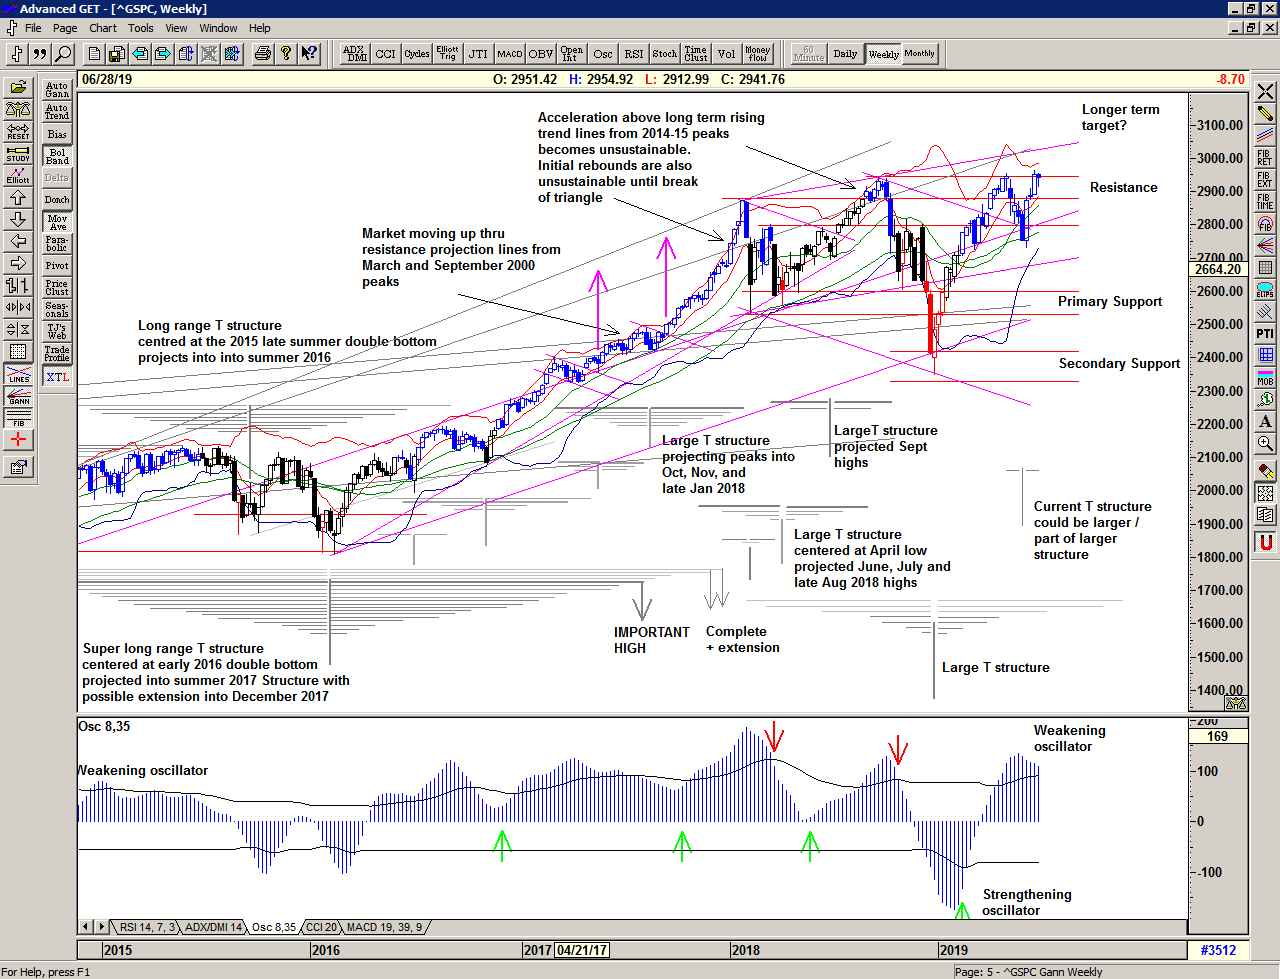
Zooming out to the weekly chart below.

Selling in May from the previous high, presumably in response to the potential of a double top, found support at the 55 week exponential moving average, a longer term pivot, and the market is now back at the previous resistance, with trend line resistance above around 3030. The rapid recovery from the May low suggests that the Large T structure centered at the December low is still active and drawing power from the declines throughout 2018. The full scale of this structure points to highs in October and November but with the potential for many bumps along the way.

Weekly Chart of S&P 500 for 01 July 2019

Save the image to your desktop to view a larger version

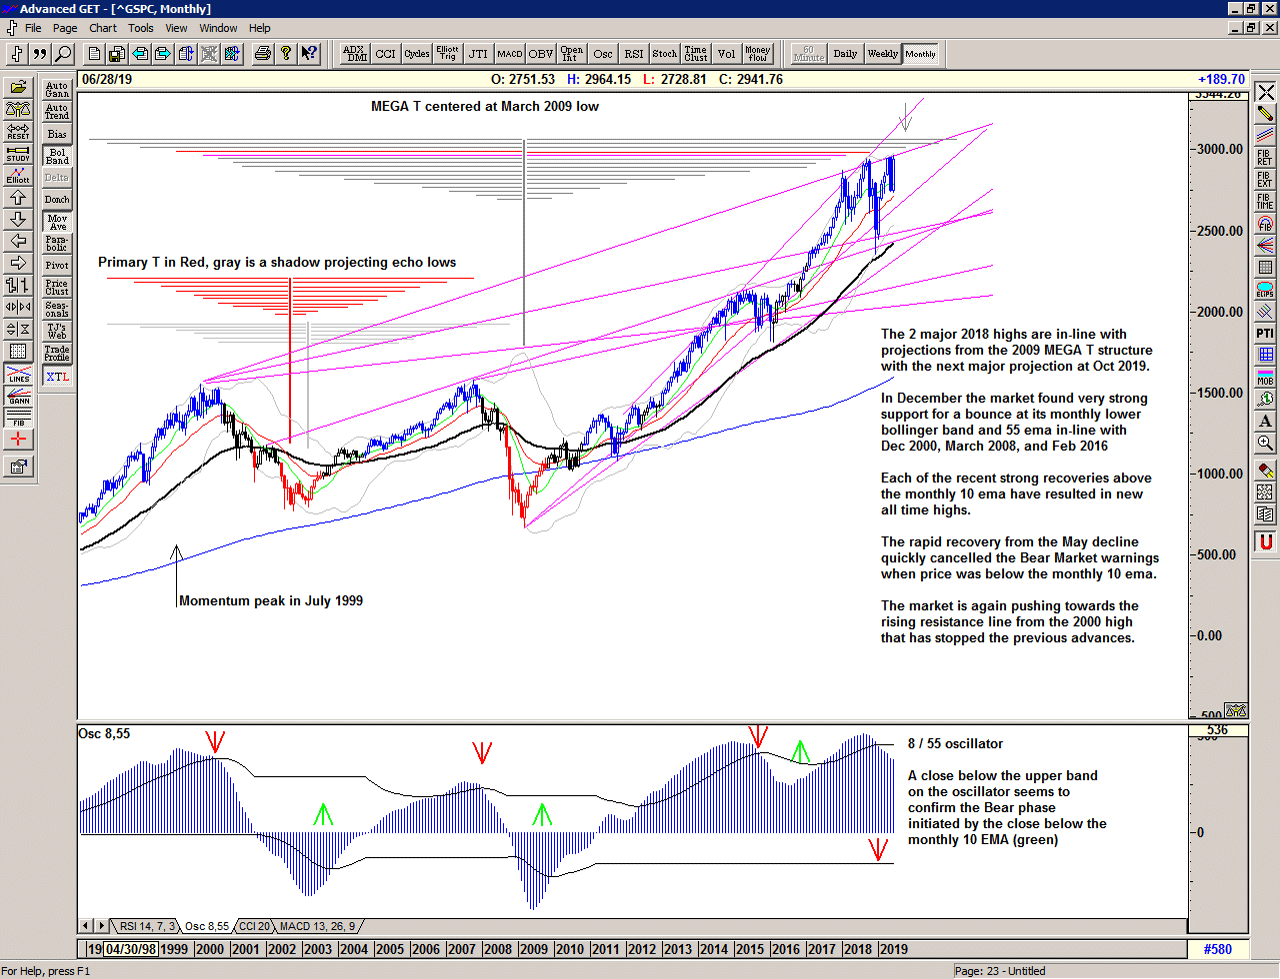
As we can see in the monthly chart the rising trend line from the 2000 high continues to be very strong resistance, but as we can see from the lower parallel trend line from the 2007 high, if this level is penetrated as the lower one was in early 2017, it could unlock significant gains.

The 10 month exponential moving average continues to be a good indicator of strength, and weakness below would be another Bear Market warning.

Monthly chart of S&P 500 for 01 July 2019

Save the image to your desktop to view a larger version

2019 continues to bring some fast and furious action in the market with a range that continues to be expansive. We can only assume that this will continue. This is a Brave New World.

Regardless of whether the market can continue higher or whether deeper lows are ahead of us, the simplicity of the proprietary price based S/T Signalling System continues to keep us on the correct side of the market, with price back above Buy Signal levels and close to all time highs.

If you would like to learn more about using the S/T Signalling System please get in touch.

Fair warning: Subscription fees have not been increased since 2017 but will be increased in August 2019. I would therefore like to encourage those considering membership to do so sooner than later.

Be prepared for whatever is coming next, and trade with confidence:

To receive detailed daily analysis, guidance and the updated daily Buy / Sell trigger levels being generated by the Trading the Line system before the market opens, and intraday alerts when appropriate, please become a Member and Sign up for Alerts & Observations – includes access to Members Area and the Explanatory Notes for all of the concepts discussed.

Disclaimer: This is the diary of a personal trading system, its methodology and the signals that it is producing. You are welcome to follow along but please understand that the information presented here is for educational purposes only. No recommendations are being made to buy, or sell stocks, options or futures contracts. Please consult your own financial advisor before making any investment decisions.