Voyager

The market continues to chop around at 3000.

The market awaits clarification from the Fed, and obviously how the market responds to the policy and commentary will have significant influence upon the direction.

Price remains strong but very mixed signals under the hood.

Chart of S&P 500 for 17 September 2019

Be prepared for whatever is coming next, and trade with confidence:

To receive detailed daily analysis, guidance and the updated daily Buy / Sell trigger levels being generated by the Trading the Line system before the market opens, and intra-day alerts when appropriate, please become a Member and Sign up for Alerts & Observations – includes access to Members Area and the Explanatory Notes for all of the concepts discussed.

Disclaimer: This is the diary of a personal trading system, its methodology and the signals that it is producing. You are welcome to follow along but please understand that the information presented here is for educational purposes only. No recommendations are being made to buy, or sell stocks, options or futures contracts. Please consult your own financial advisor before making any investment decisions.


Viriditas

The market gaps down a little but holds up above the Buy Signal line.

Chart of S&P 500 for 17 September 2019

Be prepared for whatever is coming next, and trade with confidence:

To receive detailed daily analysis, guidance and the updated daily Buy / Sell trigger levels being generated by the Trading the Line system before the market opens, and intra-day alerts when appropriate, please become a Member and Sign up for Alerts & Observations – includes access to Members Area and the Explanatory Notes for all of the concepts discussed.

Disclaimer: This is the diary of a personal trading system, its methodology and the signals that it is producing. You are welcome to follow along but please understand that the information presented here is for educational purposes only. No recommendations are being made to buy, or sell stocks, options or futures contracts. Please consult your own financial advisor before making any investment decisions.


P is for patience

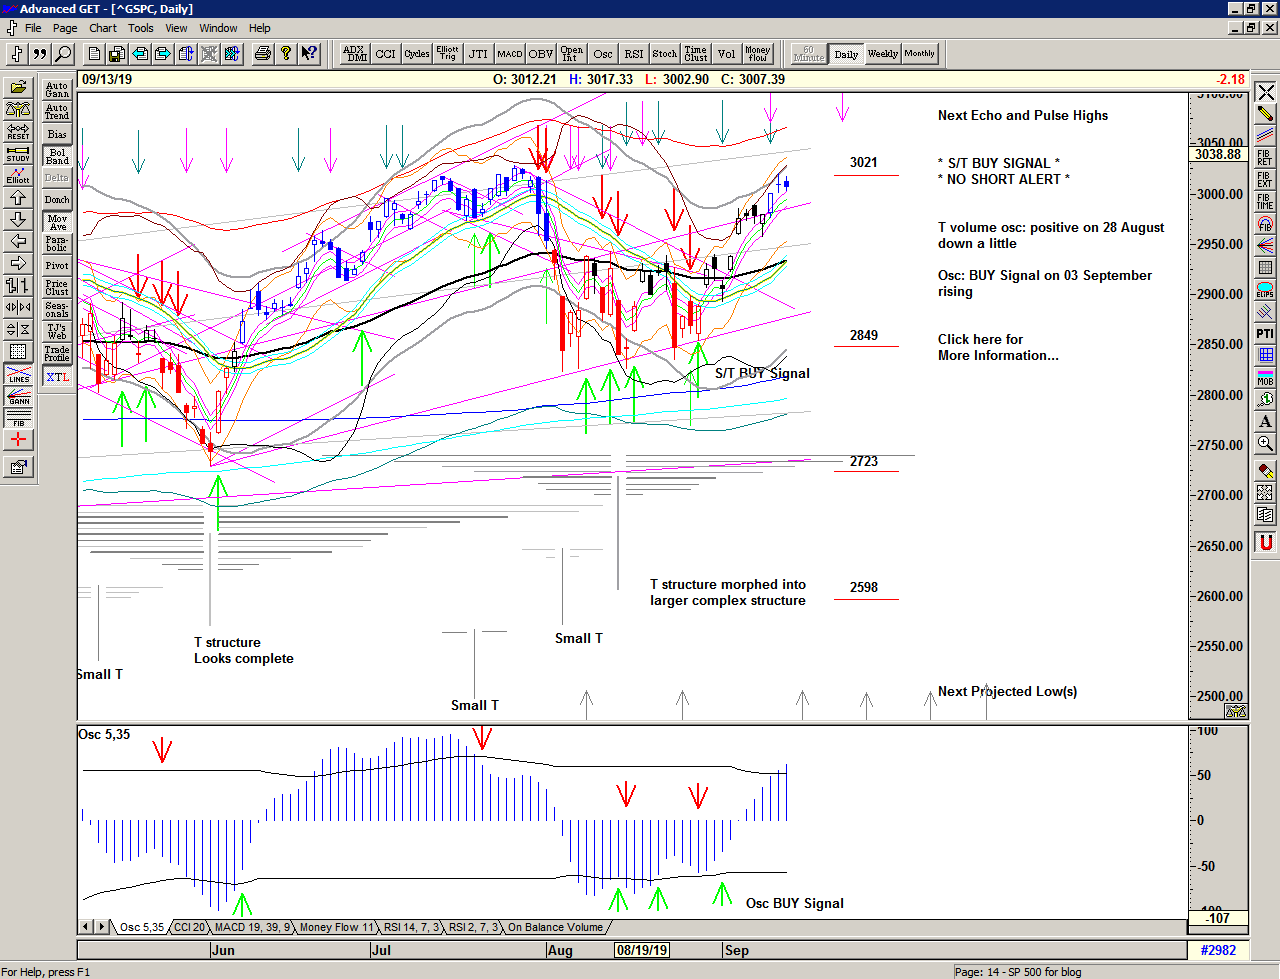
The market rips higher in September and all of a sudden we are back at 3000 and back in the Zone – the Zone that the last wave of selling started at.

As we can see those 3 important August lows with signs of divergence developing in both oscillators suggested a positive outcome as the market refused to break lower than the initial low on 05 August, revealing that the process was one of consolidation, and that patience was required.

So, back near all time highs and at a projection for an initial high from the current T structure and an active Buy Signal.

Is there more?

Daily chart of S&P 500 for 16 September 2019

Save the image to your desktop to view a larger version

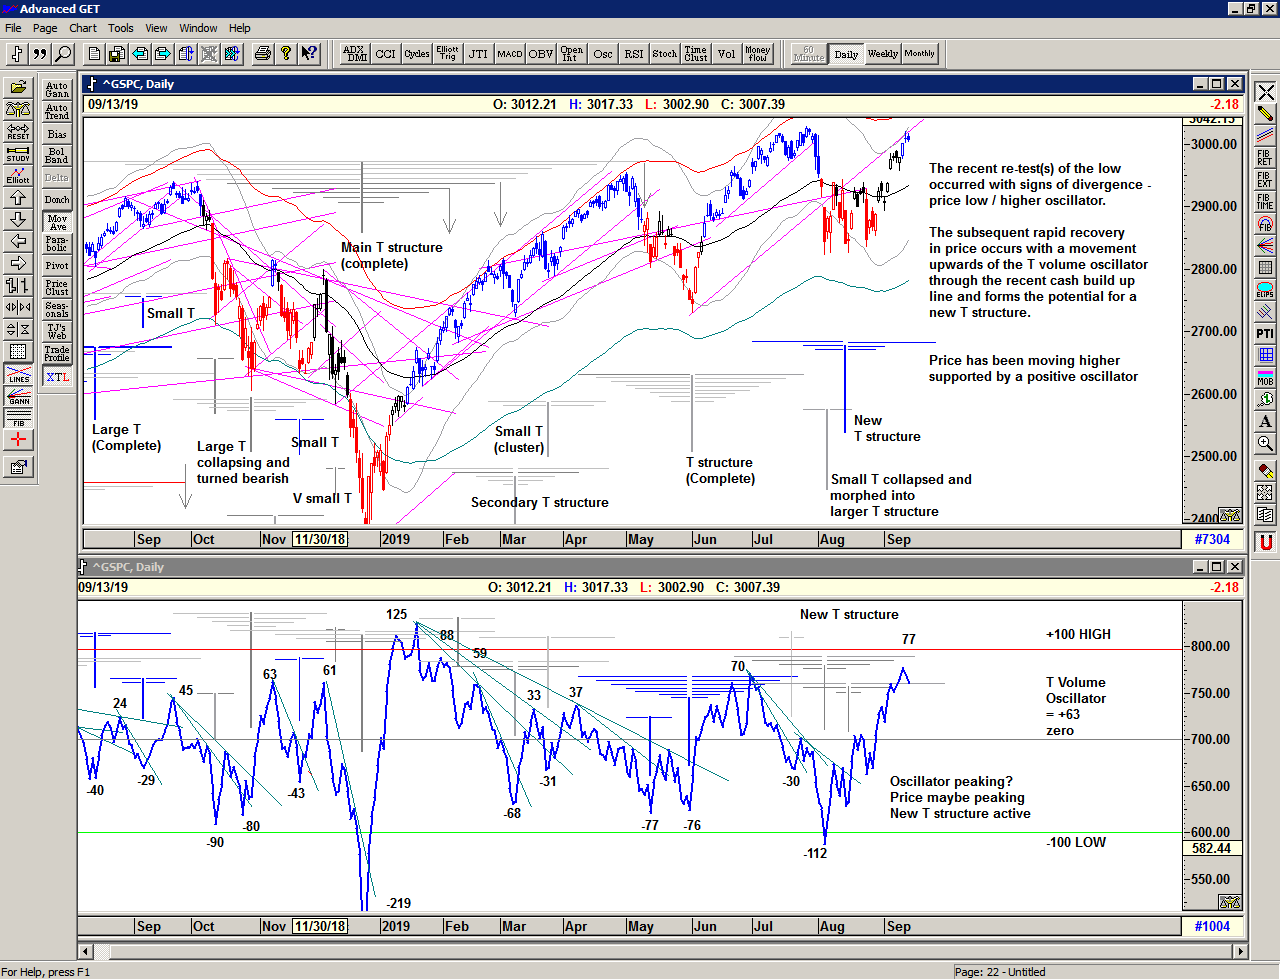
As we can see in the chart below with the T volume oscillator*, the oscillator was generally recovering throughout August, hinting of an increase in liquidity and buying power, and that it has now reached a similar level as it did in the early July period – the momentum peak of the last advance.

We can see that the oscillator peaks are not usually associated with the final price highs in the advance except when these occur in bear market rallies, and we can see instead that price usually continues to advance until the oscillator starts to fade, and especially when it drops below zero, making the market vulnerable to a steep decline.

The declining oscillator can therefore be seen as profit-taking, providing the liquidity for buying the dips until such time as price becomes exhausted.

* The T volume oscillator is an indication of Buying Power within the market as a whole

Chart of S&P 500 for 16 September 2019

Save the image to your desktop to view a larger version

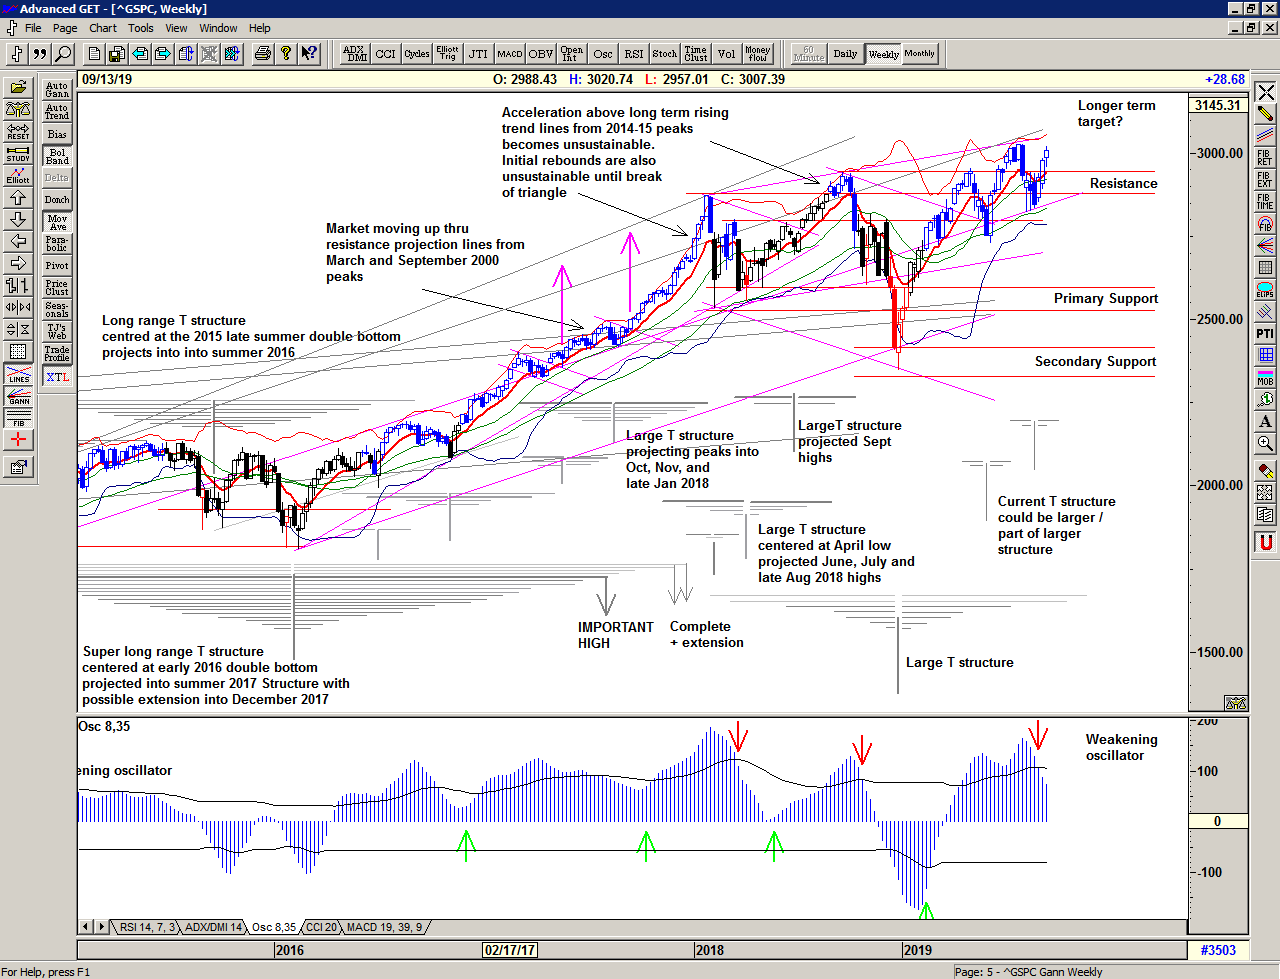
The weekly chart continues to show a bullish market within the context of the long term trajectory having found support at the long term rising angle and with price now making another attempt on the previous highs.

The oscillator continues to be weak and continues to suggest exploration of the downside ahead, but for now, with price above 2940 or so, the long term trend is still up.

Weekly Chart of S&P 500 for 16 September 2019

Save the image to your desktop to view a larger version

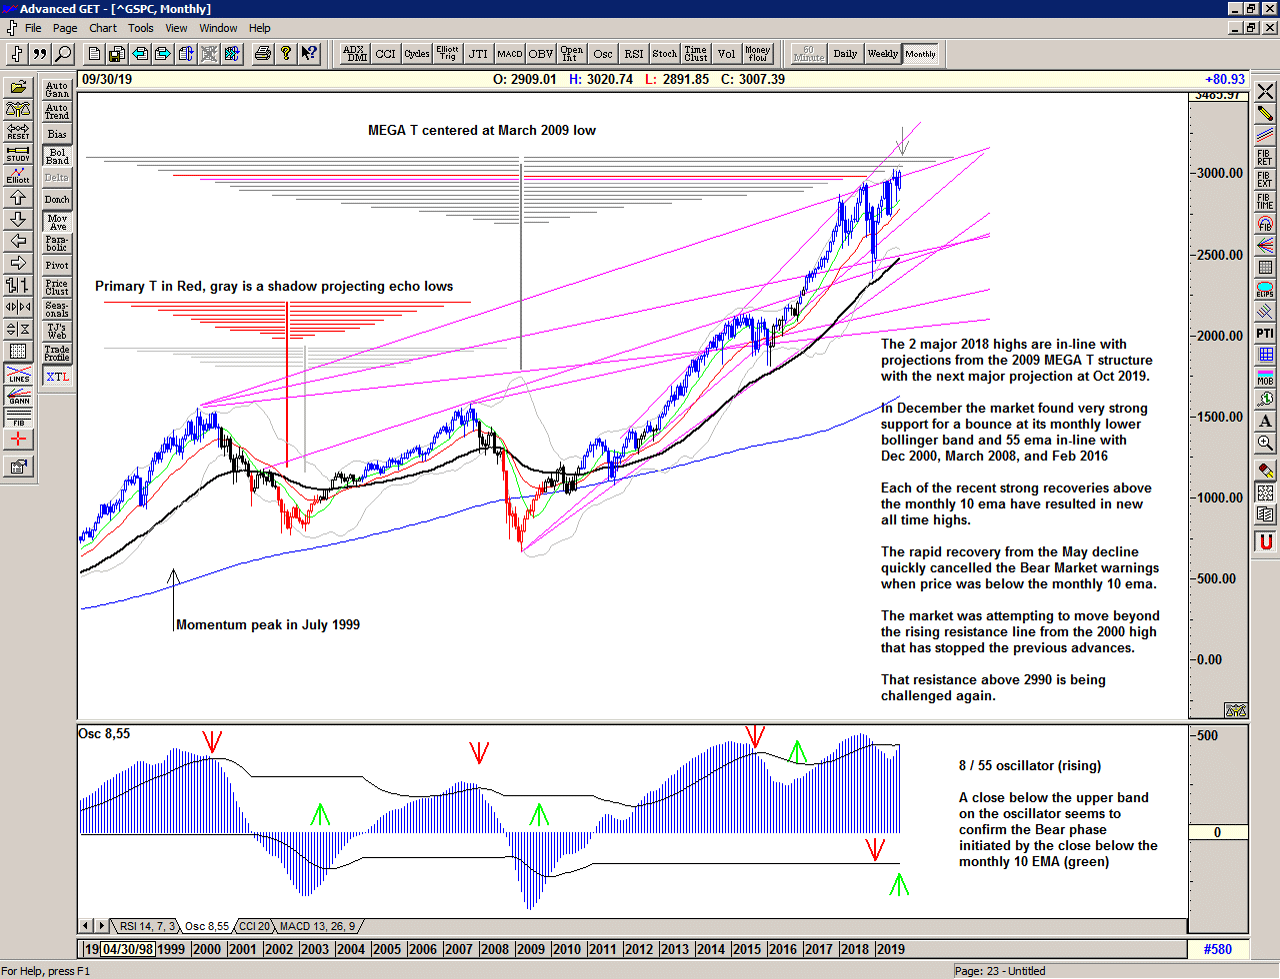
The monthly chart highlights the important resistance above coinciding with the 4 important peaks.

The Mega T structure projects another important high for October, and the oscillator remains strong supporting the possibility of new highs and perhaps ultimately a break out above that resistance line in due course.

Monthly chart of S&P 500 for 16 September 2019

Save the image to your desktop to view a larger version

2019 continues to bring some fast and furious action in the market with a range that continues to be expansive. We can only assume that this will continue. This is a Brave New World.

Regardless of whether the market can continue higher or whether significant lows are ahead of us, the simplicity of the proprietary price based S/T Signalling System continues to keep us on the correct side of the market, with price currently on a Buy Signal since 2887 on 28 August 2019

If you would like to learn more about using the S/T Signalling System please get in touch.

Be prepared for whatever is coming next, and trade with confidence:

To receive detailed daily analysis, guidance and the updated daily Buy / Sell trigger levels being generated by the Trading the Line system before the market opens, and intra-day alerts when appropriate, please become a Member and Sign up for Alerts & Observations – includes access to Members Area and the Explanatory Notes for all of the concepts discussed.

Disclaimer: This is the diary of a personal trading system, its methodology and the signals that it is producing. You are welcome to follow along but please understand that the information presented here is for educational purposes only. No recommendations are being made to buy, or sell stocks, options or futures contracts. Please consult your own financial advisor before making any investment decisions.


Zone

Let everything that's been planned come true. Let them believe. And let them have a laugh at their passions. Because what they call passion actually is not some emotional energy, but just the friction between their souls and the outside world. And most important, let them believe in themselves. Let them be helpless like children, because weakness is a great thing, and strength is nothing. When a man is just born, he is weak and flexible. When he dies, he is hard and insensitive. When a tree is growing, it's tender and pliant. But when it's dry and hard, it dies. Hardness and strength are death's companions. Pliancy and weakness are expressions of the freshness of being. Because what has hardened will never win.

Andrei Tarkovsky, Stalker, 1979

Some hesitation as a look at the recent high is sold into, and signs of profit-taking.

Buy Signal continues for now as price looks to catch up with itself.

Chart of S&P 500 for 16 September 2019

Be prepared for whatever is coming next, and trade with confidence:

To receive detailed daily analysis, guidance and the updated daily Buy / Sell trigger levels being generated by the Trading the Line system before the market opens, and intra-day alerts when appropriate, please become a Member and Sign up for Alerts & Observations – includes access to Members Area and the Explanatory Notes for all of the concepts discussed.

Disclaimer: This is the diary of a personal trading system, its methodology and the signals that it is producing. You are welcome to follow along but please understand that the information presented here is for educational purposes only. No recommendations are being made to buy, or sell stocks, options or futures contracts. Please consult your own financial advisor before making any investment decisions.


Magic

And above all, watch with glittering eyes the whole world around you
because the greatest secrets are always hidden in the most unlikely places.
Those who don't believe in magic will never find it.

Roald Dahl, The Minpins, 1991

The market gaps up and takes a look at 3020.

Buy Signal continues.

Back at the upper edge of the gray channel

Chart of S&P 500 for 13 September 2019

Be prepared for whatever is coming next, and trade with confidence:

To receive detailed daily analysis, guidance and the updated daily Buy / Sell trigger levels being generated by the Trading the Line system before the market opens, and intra-day alerts when appropriate, please become a Member and Sign up for Alerts & Observations – includes access to Members Area and the Explanatory Notes for all of the concepts discussed.

Disclaimer: This is the diary of a personal trading system, its methodology and the signals that it is producing. You are welcome to follow along but please understand that the information presented here is for educational purposes only. No recommendations are being made to buy, or sell stocks, options or futures contracts. Please consult your own financial advisor before making any investment decisions.


Marathon

To stand up straight with your shoulders back is to accept the terrible responsibility of life, with eyes wide open. It means deciding to voluntarily transform the chaos of potential into the realities of habitable order. It means adopting the burden of self-conscious vulnerability, and accepting the end of the unconscious paradise of childhood, where finitude and mortality are only dimly comprehended. It means willingly undertaking the sacrifices necessary to generate a productive and meaningful reality.

Jordan B. Peterson, 12 Rules for Life: An Antidote to Chaos, 2018

The current Buy Signal continues higher with a straight up day reaching 3000 on the echo and pulse high.

Price and momentum look very strong but Arms and Put/Call ratios flash warnings of over exuberance.

Chart of S&P 500 for 12 September 2019

Be prepared for whatever is coming next, and trade with confidence:

To receive detailed daily analysis, guidance and the updated daily Buy / Sell trigger levels being generated by the Trading the Line system before the market opens, and intra-day alerts when appropriate, please become a Member and Sign up for Alerts & Observations – includes access to Members Area and the Explanatory Notes for all of the concepts discussed.

Disclaimer: This is the diary of a personal trading system, its methodology and the signals that it is producing. You are welcome to follow along but please understand that the information presented here is for educational purposes only. No recommendations are being made to buy, or sell stocks, options or futures contracts. Please consult your own financial advisor before making any investment decisions.


Broch

In memory of the tragic loss of life on September 11, 2001.

The market marks the range with a look-see at 2960 and a successful test before finding support and heading back higher.

Today is both a scheduled echo high and also a pulse high suggesting that a turn of some sort is imminent.

Chart of S&P 500 for 11 September 2019

Be prepared for whatever is coming next, and trade with confidence:

To receive detailed daily analysis, guidance and the updated daily Buy / Sell trigger levels being generated by the Trading the Line system before the market opens, and intra-day alerts when appropriate, please become a Member and Sign up for Alerts & Observations – includes access to Members Area and the Explanatory Notes for all of the concepts discussed.

Disclaimer: This is the diary of a personal trading system, its methodology and the signals that it is producing. You are welcome to follow along but please understand that the information presented here is for educational purposes only. No recommendations are being made to buy, or sell stocks, options or futures contracts. Please consult your own financial advisor before making any investment decisions.


Nyon

Selling from the gap up high and buying the dip as the market absorbs the recent price move.

Chart of S&P 500 for 10 September 2019

Be prepared for whatever is coming next, and trade with confidence:

To receive detailed daily analysis, guidance and the updated daily Buy / Sell trigger levels being generated by the Trading the Line system before the market opens, and intra-day alerts when appropriate, please become a Member and Sign up for Alerts & Observations – includes access to Members Area and the Explanatory Notes for all of the concepts discussed.

Disclaimer: This is the diary of a personal trading system, its methodology and the signals that it is producing. You are welcome to follow along but please understand that the information presented here is for educational purposes only. No recommendations are being made to buy, or sell stocks, options or futures contracts. Please consult your own financial advisor before making any investment decisions.


Hermann

The market chops around at the recent high as the Buy Signal continues.

Chart of S&P 500 for 09 September 2019

Be prepared for whatever is coming next, and trade with confidence:

To receive detailed daily analysis, guidance and the updated daily Buy / Sell trigger levels being generated by the Trading the Line system before the market opens, and intra-day alerts when appropriate, please become a Member and Sign up for Alerts & Observations – includes access to Members Area and the Explanatory Notes for all of the concepts discussed.

Disclaimer: This is the diary of a personal trading system, its methodology and the signals that it is producing. You are welcome to follow along but please understand that the information presented here is for educational purposes only. No recommendations are being made to buy, or sell stocks, options or futures contracts. Please consult your own financial advisor before making any investment decisions.


Emersion

The market pops out of the box and heads up into the 2980s.

Chart of S&P 500 for 06 September 2019

Be prepared for whatever is coming next, and trade with confidence:

To receive detailed daily analysis, guidance and the updated daily Buy / Sell trigger levels being generated by the Trading the Line system before the market opens, and intra-day alerts when appropriate, please become a Member and Sign up for Alerts & Observations – includes access to Members Area and the Explanatory Notes for all of the concepts discussed.

Disclaimer: This is the diary of a personal trading system, its methodology and the signals that it is producing. You are welcome to follow along but please understand that the information presented here is for educational purposes only. No recommendations are being made to buy, or sell stocks, options or futures contracts. Please consult your own financial advisor before making any investment decisions.