Blackjack

I would like to wish all of my readers a very successful New Year, as we look back on an Extraordinary Year, a Brave New World, and perhaps a New World Order emerging.

2021, a coming of age, Blackjack.

An end of year advance with an important Buy Signal on 03 November quickly saw new all time highs and persistent follow through and with subsequent extension Buy Signals on 24 November, 15 December and 24 December, to close the year with impressive strength, all things considered.
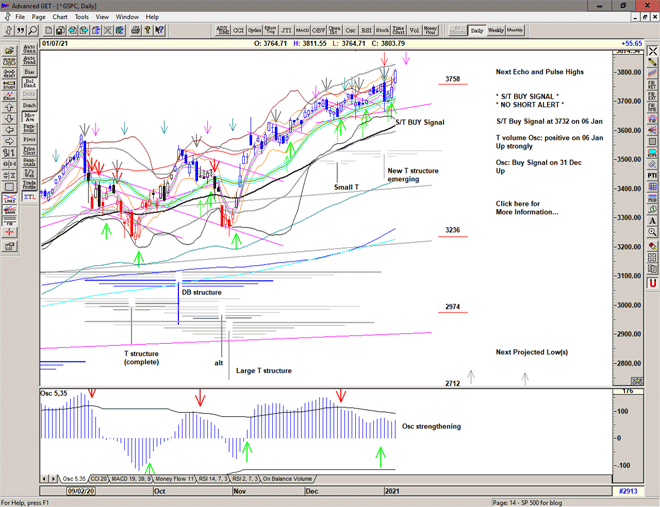
Daily chart of S&P 500 for 04 January 2021

Save the image to your desktop to view a larger version

The T volume oscillator* rose rapidly from the late October low up through the cash build-up line** from the 12 October lower high indicating a new T structure was emerging projecting initial price highs in early and mid November. Also with price breaking out above the previous all time high a Double Bottom DB structure could be drawn projecting further potential strength into end of year.

Since early December the T volume oscillator has been declining whilst price has held strong and continued to rise. This is potentially a bearish divergence and indicates profit-taking and re-cycling under the hood as buying power originating in earlier declines continues to drive price higher, but for how much longer?

* The T volume oscillator is an indication of Buying Power within the market as a whole
** The cash build-up line is a declining line drawn above a series of lower highs made in the oscillator.
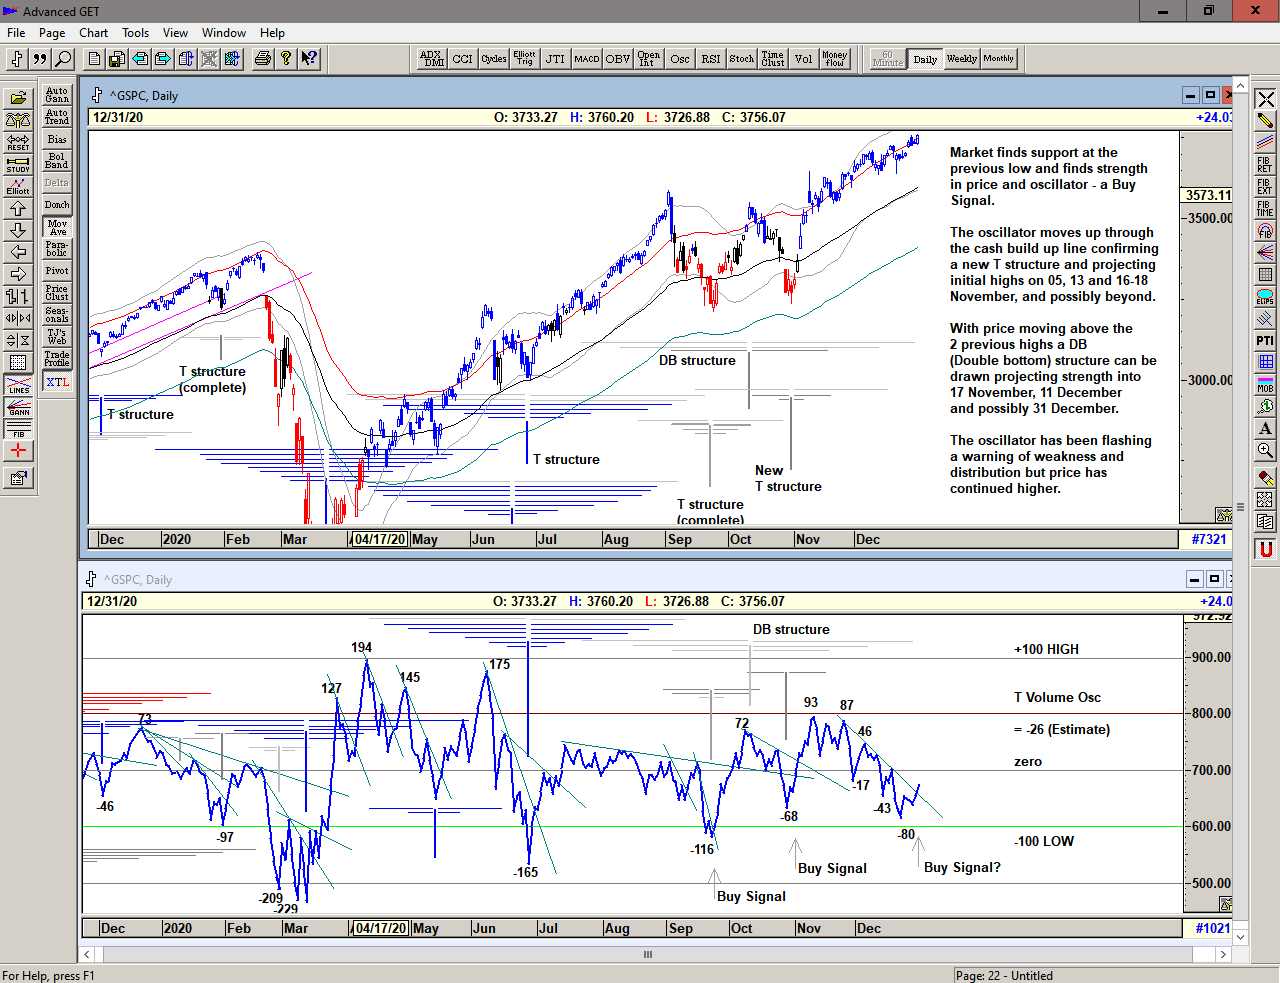
Chart of S&P 500 with T volume oscillator for 04 January 2021

Save the image to your desktop to view a larger version

Zooming out to the weekly chart, we can see that price has been breaking upwards above the important trend line from the 2012-14 peaks. This shows extreme strength with a vacuum above but whether it is sustainable is difficult to evaluate.

The large T structure centered at the March 2020 low continues to project strength into Mid February from the May 2019 high, and could project further strength from the earlier declines in 2018.

In previous breakouts up through important price levels, we have seen the market eventually re-test with urgency and so we should remember the break out level (3510-90) if or when the market revisits again.
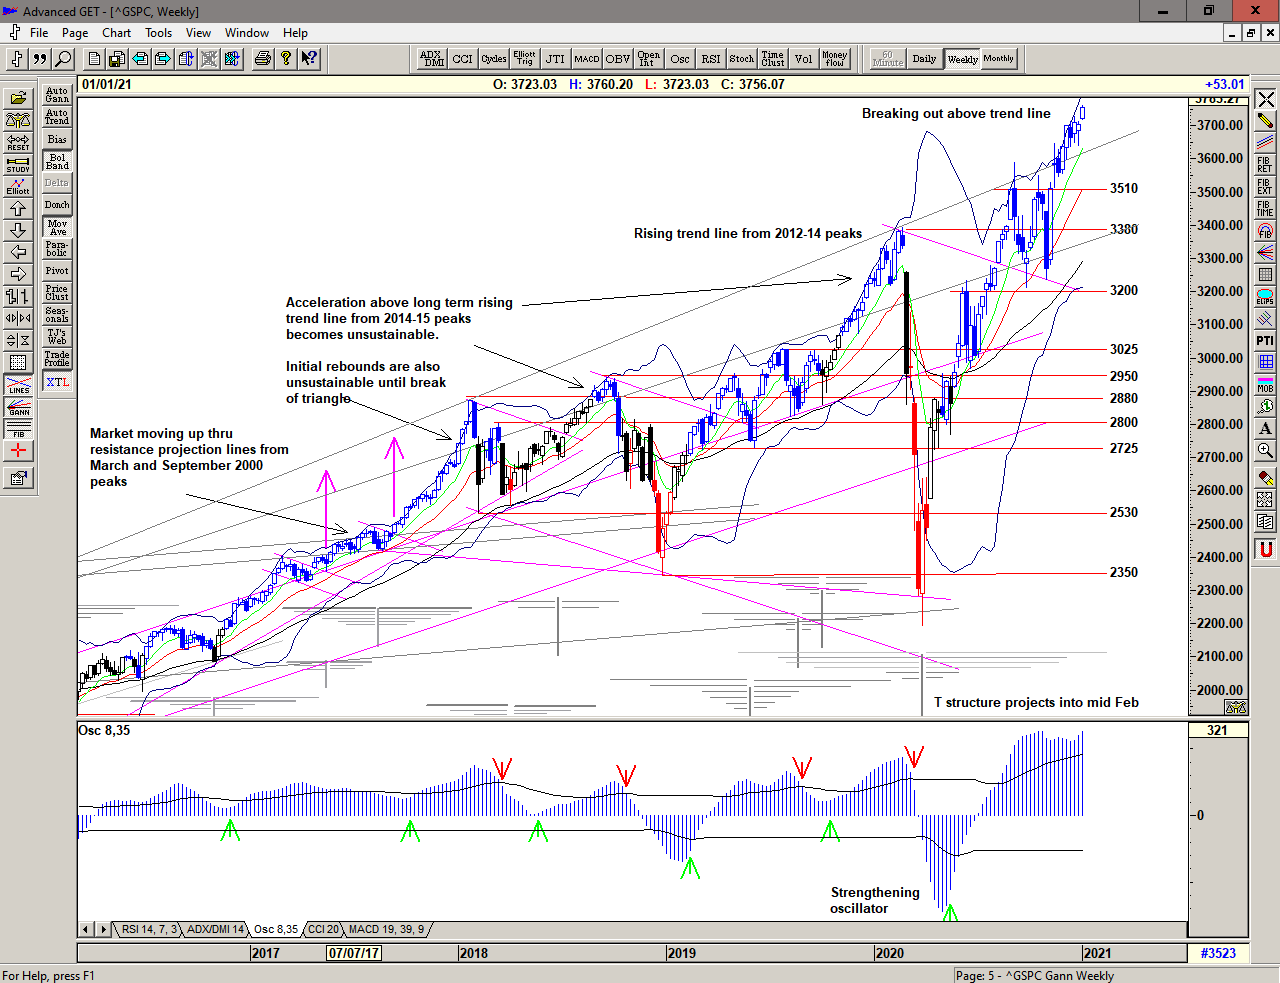
Weekly chart of S&P 500 for 04 January 2021

Save the image to your desktop to view a larger version

The monthly chart returned to strength after the October low with price clearly moving above all previous rising trend lines. A blow off top, maybe. but impressive strength all the same.

The new large structure centered at the March low seems to be superseding the previous structures which projected highs in September as it now projects highs for January 2021, August 2021 and March 2022.

The Mega T structure projects a final high in March 2021.

We shall see how this unfolds.
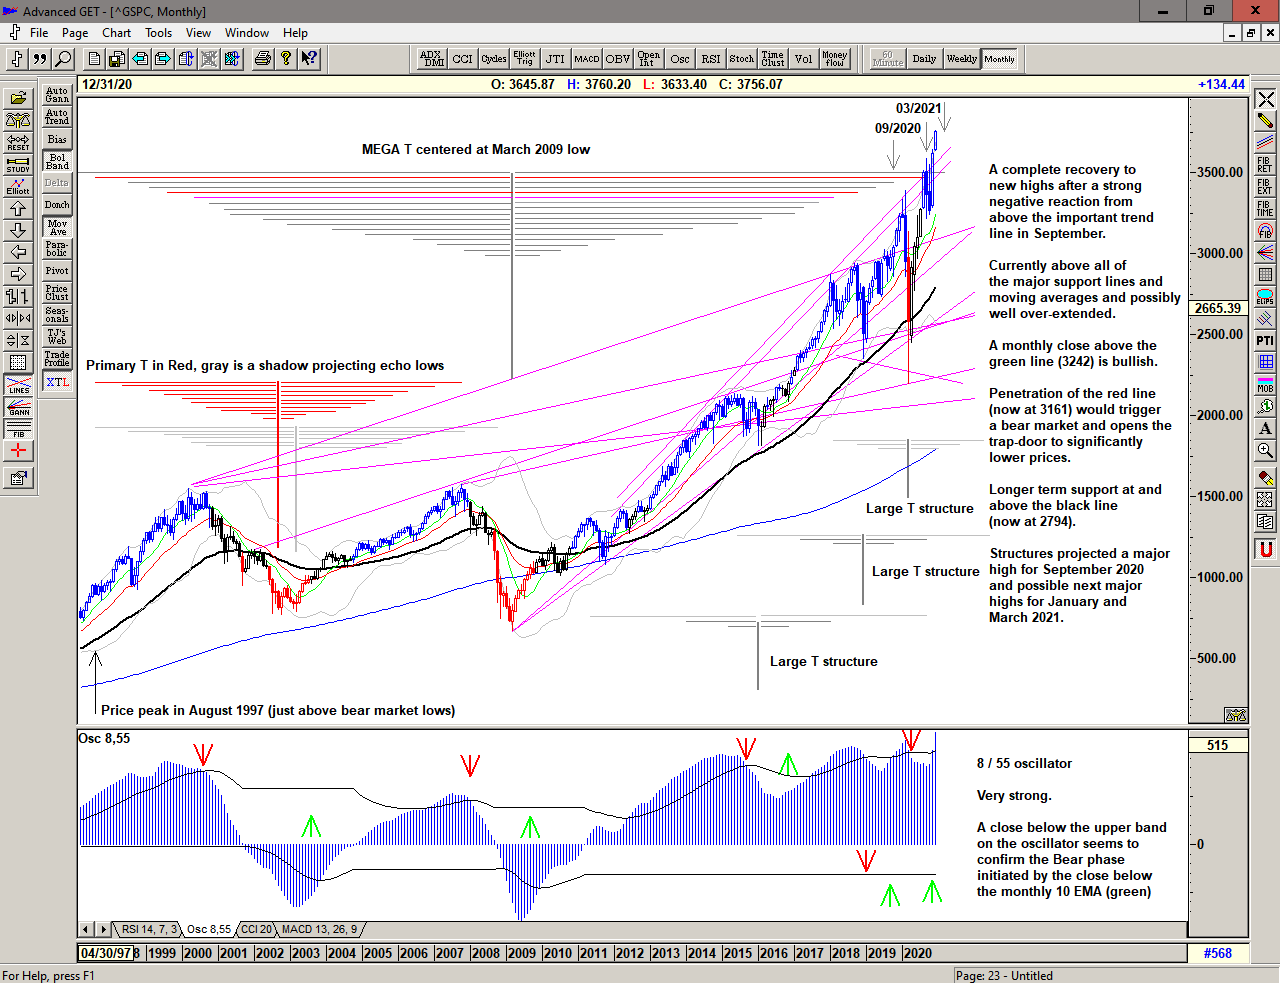
Monthly chart of S&P 500 fo 04 January 2021

Save the image to your desktop to view a larger version

2020 brought some extraordinary action in the market with a range that has become increasingly expansive since the move above 2500. With price above 3700 we can only assume that this will continue into 2021. This is a Brave New World.

Regardless of whether the market can continue higher or whether significant lows are ahead of us, the simplicity of the proprietary price based S/T Signalling System will continue to keep us on the correct side of the market, with price currently on a Buy Signal since moving above 3702 on 24 December 2020.

If you would like to learn more about using the S/T Signalling System please get in touch.

Braille

A push to all time highs at the close of the year.

Buy Signal continues.

Chart of S&P 500 for 04 January 2021

To receive detailed daily analysis, guidance and the updated daily Buy / Sell trigger levels being generated by the Trading the Line system before the market opens, and intra-day alerts when appropriate, please become a Member and Sign up for Alerts & Observations – includes access to Members Area, Explanatory Notes (pdf) for all of the concepts discussed, and Notes on Day Trading (pdf)

Disclaimer: This is the diary of a personal trading system, its methodology and the signals that it is producing. You are welcome to follow along but please understand that the information presented here is for educational purposes only. No recommendations are being made to buy, or sell stocks, options or futures contracts. Please consult your own financial advisor before making any investment decisions.


Karamu

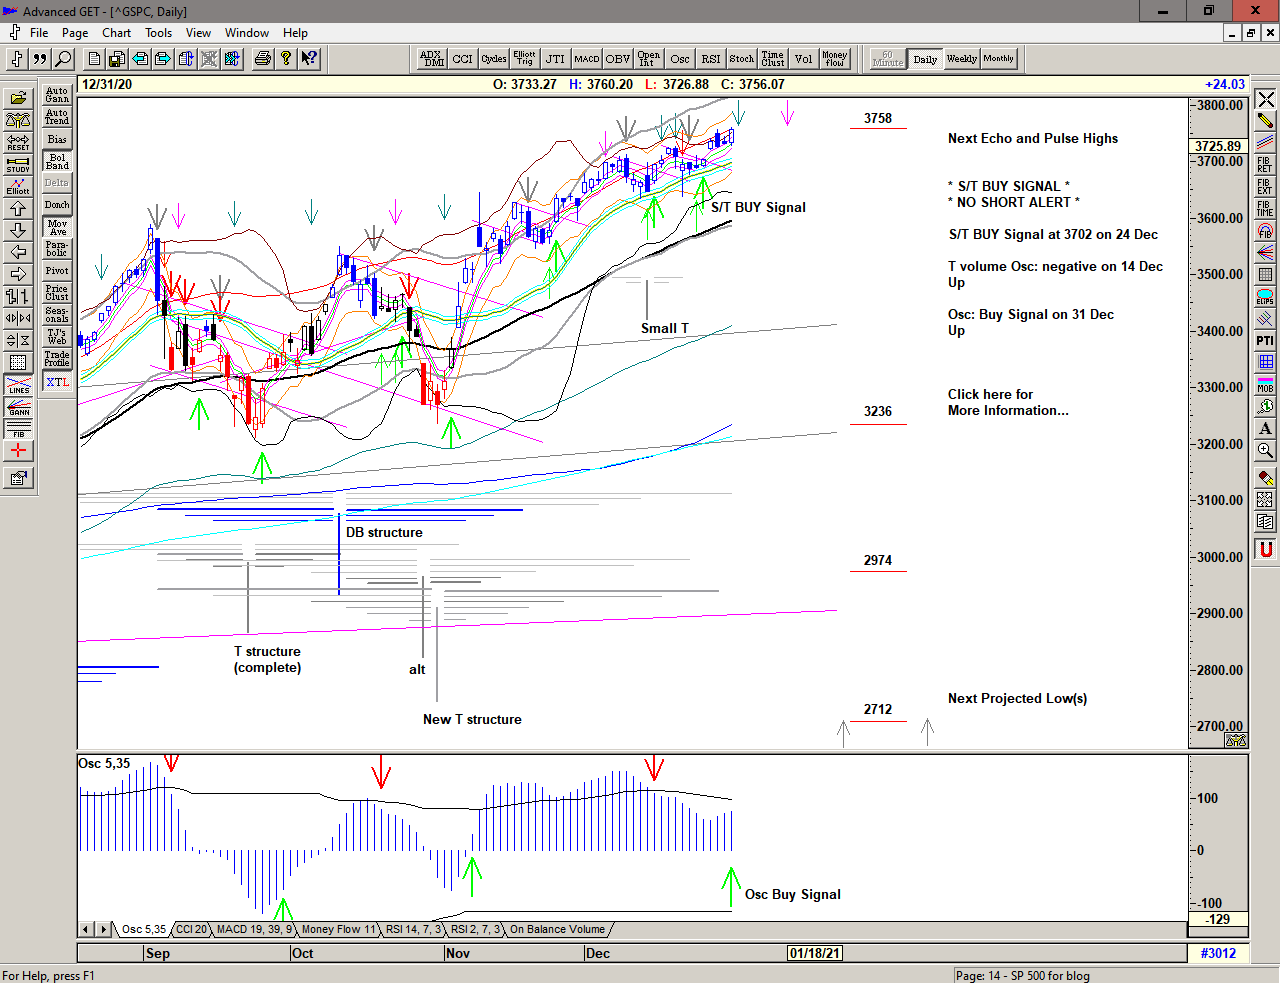
A gap up and look at 3743 before grinding lower.

Buy Signal continues.

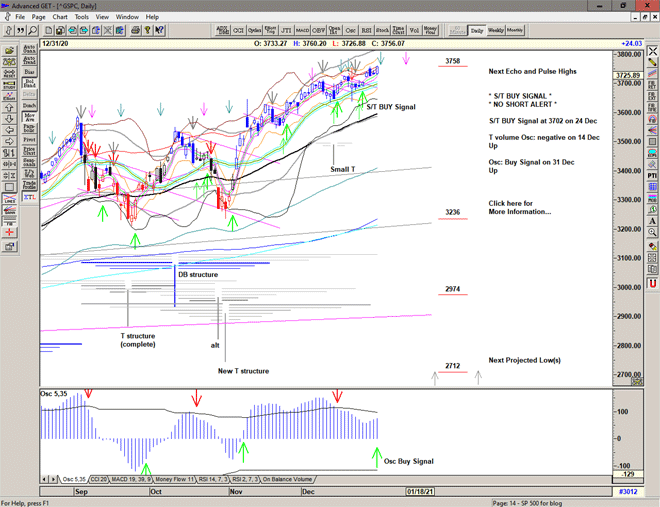
A closing of a very strange year.

Happy New Year to all my readers

Chart of S&P 500 for 31 December 2020

To receive detailed daily analysis, guidance and the updated daily Buy / Sell trigger levels being generated by the Trading the Line system before the market opens, and intra-day alerts when appropriate, please become a Member and Sign up for Alerts & Observations – includes access to Members Area, Explanatory Notes (pdf) for all of the concepts discussed, and Notes on Day Trading (pdf)

Disclaimer: This is the diary of a personal trading system, its methodology and the signals that it is producing. You are welcome to follow along but please understand that the information presented here is for educational purposes only. No recommendations are being made to buy, or sell stocks, options or futures contracts. Please consult your own financial advisor before making any investment decisions.


Granada

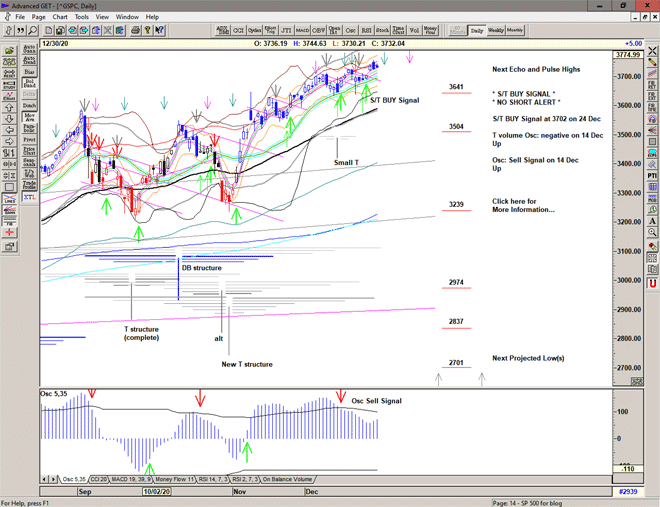
Pop and drop at the high. The market takes a look above 3750 before profit-taking and a decline to 3725.

Buy Signal continues.

Chart of S&P 500 for 30 December 2020

To receive detailed daily analysis, guidance and the updated daily Buy / Sell trigger levels being generated by the Trading the Line system before the market opens, and intra-day alerts when appropriate, please become a Member and Sign up for Alerts & Observations – includes access to Members Area, Explanatory Notes (pdf) for all of the concepts discussed, and Notes on Day Trading (pdf)

Disclaimer: This is the diary of a personal trading system, its methodology and the signals that it is producing. You are welcome to follow along but please understand that the information presented here is for educational purposes only. No recommendations are being made to buy, or sell stocks, options or futures contracts. Please consult your own financial advisor before making any investment decisions.


Portrait

I will tell you what I will do and what I will not do. I will not serve that in which I no longer believe, whether it calls itself my home, my fatherland, or my church: and I will try to express myself in some mode of life or art as freely as I can and as wholly as I can, using for my defense the only arms I allow myself to use — silence, exile, and cunning.

James Joyce, A Portrait of the Artist as a Young Man, 1916

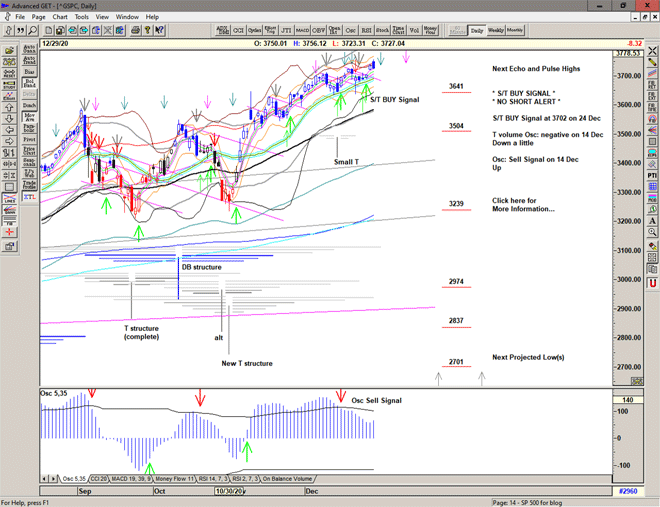
A gap up and a grind into new all time highs in quiet holiday action.

Buy Signal continues.

Chart of S&P 500 for 29 December 2020

To receive detailed daily analysis, guidance and the updated daily Buy / Sell trigger levels being generated by the Trading the Line system before the market opens, and intra-day alerts when appropriate, please become a Member and Sign up for Alerts & Observations – includes access to Members Area, Explanatory Notes (pdf) for all of the concepts discussed, and Notes on Day Trading (pdf)

Disclaimer: This is the diary of a personal trading system, its methodology and the signals that it is producing. You are welcome to follow along but please understand that the information presented here is for educational purposes only. No recommendations are being made to buy, or sell stocks, options or futures contracts. Please consult your own financial advisor before making any investment decisions.


Inocentadas

The market creeps up to the Buy Signal line in holiday action triggering a Buy Signal at 3702.

Chart of S&P 500 for 28 December 2020

To receive detailed daily analysis, guidance and the updated daily Buy / Sell trigger levels being generated by the Trading the Line system before the market opens, and intra-day alerts when appropriate, please become a Member and Sign up for Alerts & Observations – includes access to Members Area, Explanatory Notes (pdf) for all of the concepts discussed, and Notes on Day Trading (pdf)

Disclaimer: This is the diary of a personal trading system, its methodology and the signals that it is producing. You are welcome to follow along but please understand that the information presented here is for educational purposes only. No recommendations are being made to buy, or sell stocks, options or futures contracts. Please consult your own financial advisor before making any investment decisions.


Oskoreia

The Wild Hunt begins.

An overnight recovery and gap up into the Buy Signal line, a small pullback and a grind higher to 3710 before profit-taking, a drop back below the Buy Signal line and selling into the close.

A Buy Signal at 3704 but recommended to protect below breakeven.

Cover Signal continues.

Seasonal Greetings to all my readers – Enjoy the Holiday

Chart of S&P 500 for 24 December 2020

To receive detailed daily analysis, guidance and the updated daily Buy / Sell trigger levels being generated by the Trading the Line system before the market opens, and intra-day alerts when appropriate, please become a Member and Sign up for Alerts & Observations – includes access to Members Area, Explanatory Notes (pdf) for all of the concepts discussed, and Notes on Day Trading (pdf)

Disclaimer: This is the diary of a personal trading system, its methodology and the signals that it is producing. You are welcome to follow along but please understand that the information presented here is for educational purposes only. No recommendations are being made to buy, or sell stocks, options or futures contracts. Please consult your own financial advisor before making any investment decisions.


Reserve

A choppy day under yesterday's high and bouncing above and below the Buy/Cover Signal line, eventually closing slightly below.

Fairly inconclusive but a Cover Signal all the same.

Cover Signal at 3689

Chart of S&P 500 for 23 December 2020

To receive detailed daily analysis, guidance and the updated daily Buy / Sell trigger levels being generated by the Trading the Line system before the market opens, and intra-day alerts when appropriate, please become a Member and Sign up for Alerts & Observations – includes access to Members Area, Explanatory Notes (pdf) for all of the concepts discussed, and Notes on Day Trading (pdf)

Disclaimer: This is the diary of a personal trading system, its methodology and the signals that it is producing. You are welcome to follow along but please understand that the information presented here is for educational purposes only. No recommendations are being made to buy, or sell stocks, options or futures contracts. Please consult your own financial advisor before making any investment decisions.