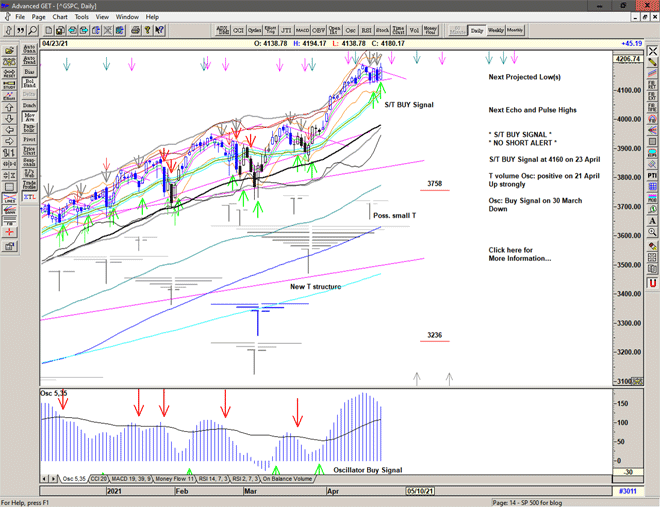
S/T BUY Signal at 4160
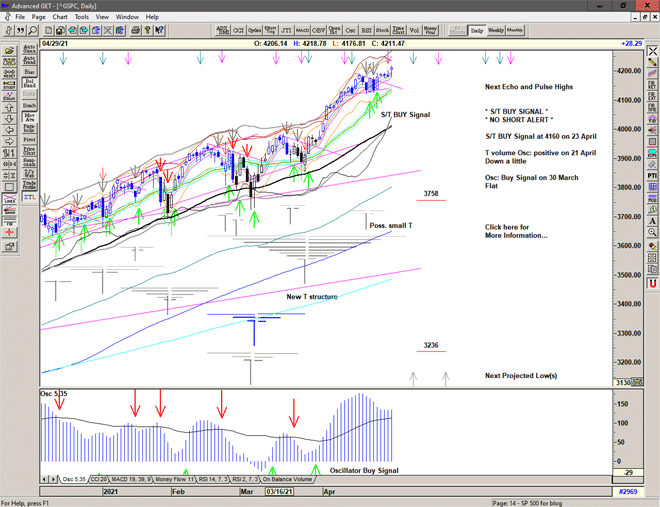
Market shrugs off yesterday's negativity and heads quickly higher with bullish strength triggering an S/T Buy Signal at 4160 and making new all time high at 4194 before pulling back into the close.
Buy Signal active
…
A navigation system for trading the S&P500 index
Market shrugs off yesterday's negativity and heads quickly higher with bullish strength triggering an S/T Buy Signal at 4160 and making new all time high at 4194 before pulling back into the close.
Buy Signal active
…
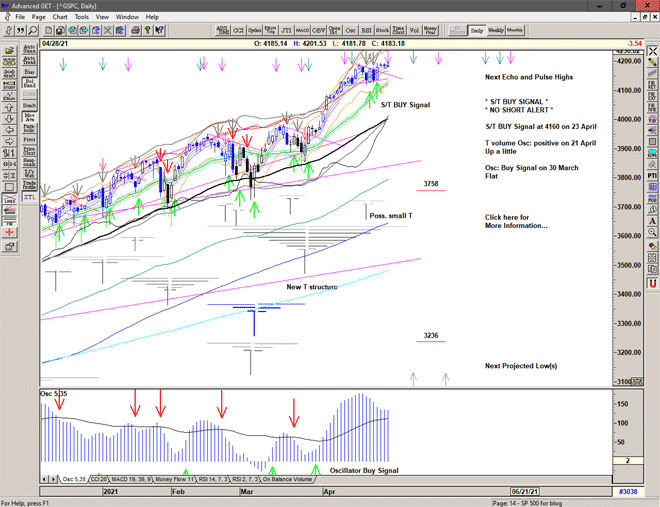
A slight pull-back and grinding higher in early action is met with strong selling after the capital tax increase announcement.
A Cover Signal at 4146.
Market looking increasingly vulnerable.
To receive detailed daily analysis, guidance and the updated daily Buy / Sell trigger levels being generated by the Trading the Line system before the market opens, and intra-day alerts when appropriate, please become a Member and Sign up for Alerts & Observations – includes access to Members Area, Explanatory Notes (pdf) for all of the concepts discussed, and Notes on Day Trading (pdf)
Disclaimer: This is the diary of a personal trading system, its methodology and the signals that it is producing. You are welcome to follow along but please understand that the information presented here is for educational purposes only. No recommendations are being made to buy, or sell stocks, options or futures contracts. Please consult your own financial advisor before making any investment decisions.
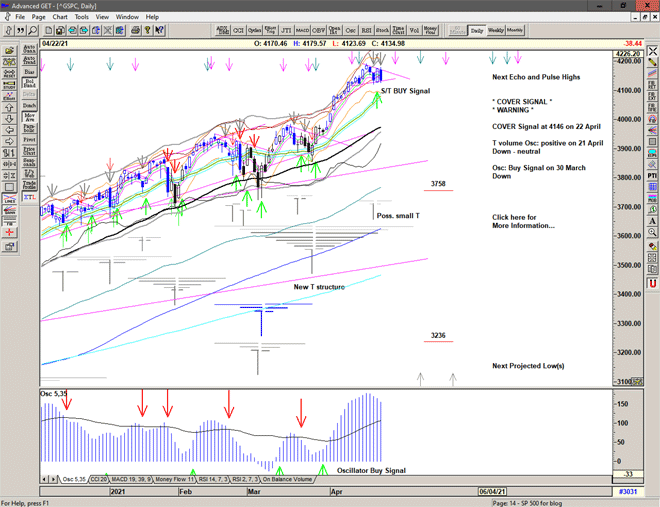
A slight pullback and grind higher to 4179 before sudden news related selling drops the market quickly to the Cover Signal line. A quick bounce but further selling through the Cover signal line into a low at 4124 before further attempts to stabilize.
A COVER Signal at 4146.
…
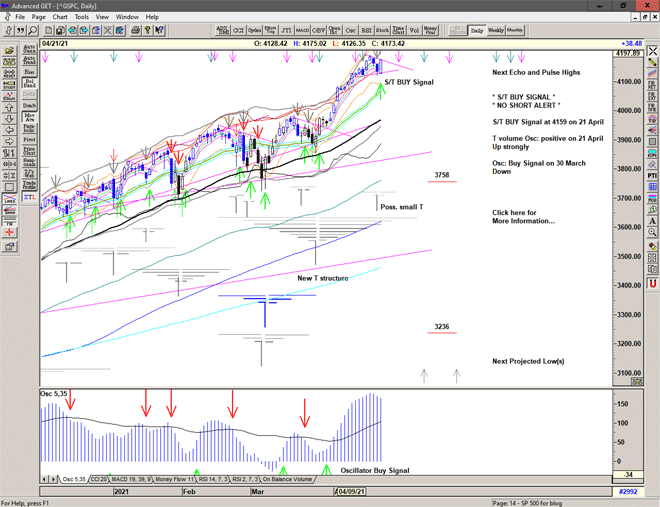
Market reverses with strength from the open, quickly moving higher and triggering an S/T Buy Signal at 4159.
Further strength into the close.
Buy Signal active.
To receive detailed daily analysis, guidance and the updated daily Buy / Sell trigger levels being generated by the Trading the Line system before the market opens, and intra-day alerts when appropriate, please become a Member and Sign up for Alerts & Observations – includes access to Members Area, Explanatory Notes (pdf) for all of the concepts discussed, and Notes on Day Trading (pdf)
Disclaimer: This is the diary of a personal trading system, its methodology and the signals that it is producing. You are welcome to follow along but please understand that the information presented here is for educational purposes only. No recommendations are being made to buy, or sell stocks, options or futures contracts. Please consult your own financial advisor before making any investment decisions.

Early morning bullish strength takes price quickly above yesterday afternoon's high, triggering an S/T Buy Signal at 4159.
Buy Signal active.
…
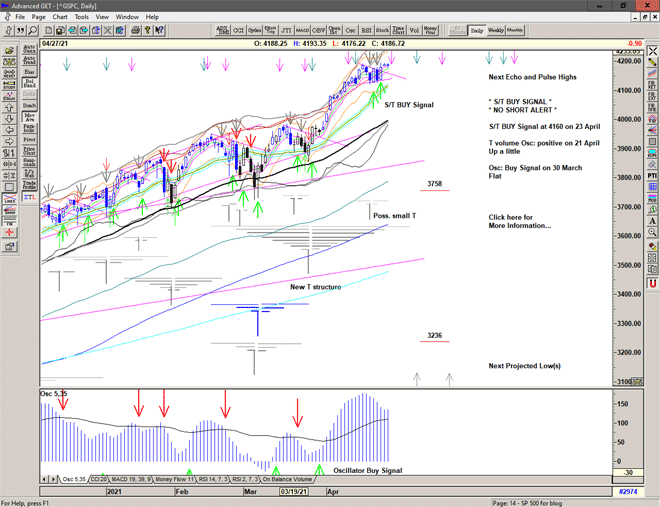
Market continues lower, triggering a Cover Signal at 4145.
Some support found at the previous low – 4120 – for an attempt at recovery.
A Cover Signal.
To receive detailed daily analysis, guidance and the updated daily Buy / Sell trigger levels being generated by the Trading the Line system before the market opens, and intra-day alerts when appropriate, please become a Member and Sign up for Alerts & Observations – includes access to Members Area, Explanatory Notes (pdf) for all of the concepts discussed, and Notes on Day Trading (pdf)
Disclaimer: This is the diary of a personal trading system, its methodology and the signals that it is producing. You are welcome to follow along but please understand that the information presented here is for educational purposes only. No recommendations are being made to buy, or sell stocks, options or futures contracts. Please consult your own financial advisor before making any investment decisions.
Market continues to decline triggering a Cover Signal at 4145, finding support at 4120 and a late afternoon attempt to recover.
A Cover Signal at 4145
…
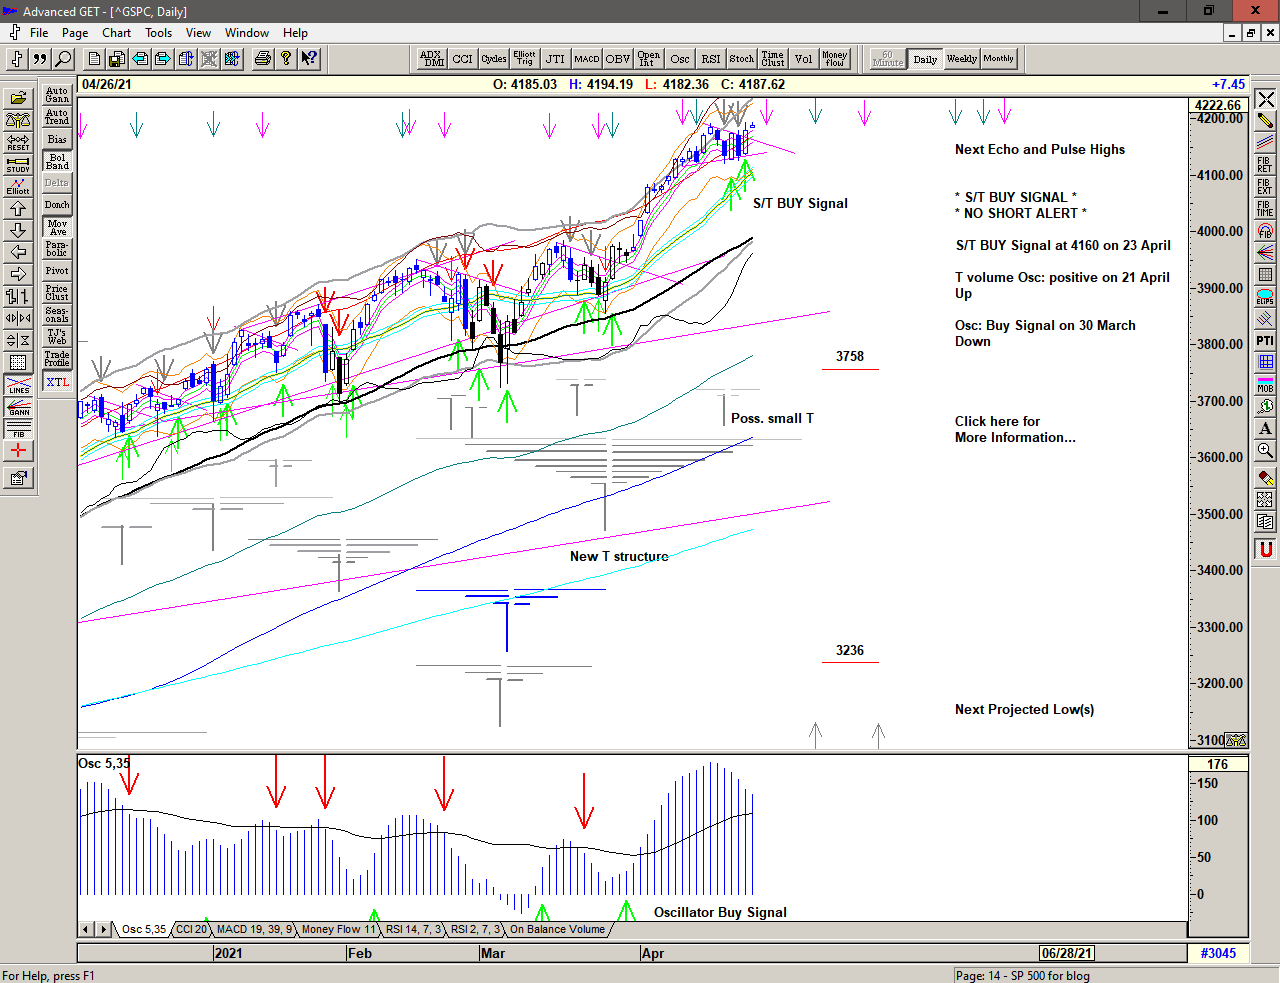
Market gaps lower, finding support at 4150.
Buy Signal continues.
To receive detailed daily analysis, guidance and the updated daily Buy / Sell trigger levels being generated by the Trading the Line system before the market opens, and intra-day alerts when appropriate, please become a Member and Sign up for Alerts & Observations – includes access to Members Area, Explanatory Notes (pdf) for all of the concepts discussed, and Notes on Day Trading (pdf)
Disclaimer: This is the diary of a personal trading system, its methodology and the signals that it is producing. You are welcome to follow along but please understand that the information presented here is for educational purposes only. No recommendations are being made to buy, or sell stocks, options or futures contracts. Please consult your own financial advisor before making any investment decisions.
I'll shoot the moon right out of the sky
For you baby
I'll be the pennies on your eyes
For you baby
I want to take you out to the fair
Here is a red rose ribbon for your hair
I'll shoot the moon right out of the sky
For you baby
I'll shoot the moon for you
Tom Waits, I'll Shoot The Moon, 1990
…
Market at all time highs, money printing to the moon, tulip manias, inflation in commodities and assets.
What could possibly go wrong?
Save the image to your desktop to view a larger version
The market consolidated under 3950 in late March before popping up and through with the most recent S/T Buy Signal on 26 March at 3927, breaking a declining sequence and making several weeks of new all time highs.
The T volume oscillator* rose rapidly with price up through the cash build up line ** indicating a new T structure was emerging projecting initial price highs in early and mid April, possibly beyond.
Price has continued higher but the T volume oscillator has remained relatively muted and not made new highs. This is a bearish divergence and indicates profit-taking and re-cycling as price becomes increasingly exhausted and potentially unsustainable.
A slight improvement in recent days but this is flashing a warning.
* The T volume oscillator is an indication of Buying Power within the market as a whole
** The cash build-up line is a declining line drawn above a series of lower highs made in the oscillator.
Save the image to your desktop to view a larger version
In the weekly chart below, we can see that price continues to break upwards above the important trend line from the 2012-14 peaks. This shows extreme strength and especially during the last 2 weeks as it moves outside the range of normality (from a bollinger band perspective at least.)
Previous parabolic moves have eventually resulted in significant corrections adding to the current danger and have the potential for declines to the 'mean' or to the lower edge of the channel, or even to the beginning of the previous advance.
A move below 4000 could therefore target 3550-3600 or even lower to 3280 or thereabouts.
Save the image to your desktop to view a larger version
The monthly chart provides an interesting perspective with April already looking excessive.
The recent Large T structures could be projecting highs in August 2021 and April 2022.
BUT the Mega T structure projects an important high for April 2021 and it may be this structure that is drawing price higher and higher. Given that price seems delirious and excessive, it would be sensible at least to take this projection with some seriousness.
The Mega T structure is drawn from as far back as possible and potentially projects the final high from the 2009 low because it is drawn from the high that is above the 2009 low that is as far back in time as possible – April 1997.
Hopefully I am wrong and there other forces at play but the recent tulip mania in the stockmarket (think Gamestop, Bitcoin, Tesla, etc) also suggests that we are now seeing a bubble… and bubbles can burst.
Be prepared.
Save the image to your desktop to view a larger version
2021 continues to bring a market with a range that has become increasingly expansive since the move above 2500. With price above 4000 we can only assume that this will continue. This is a Brave New World.
–
Regardless of whether the market can continue higher or whether significant lows are ahead of us, the simplicity of the proprietary price based S/T Signalling System will continue to keep us on the correct side of the market, with price currently on a Buy Signal since moving above 3927 on 26 March 2021.
If you would like to learn more about using the S/T Signalling System please get in touch.
–
To receive detailed daily analysis, guidance and the updated daily Buy / Sell trigger levels being generated by the Trading the Line system before the market opens, and intra-day alerts when appropriate, please become a Member and Sign up for Alerts & Observations – includes access to Members Area, Explanatory Notes (pdf) for all of the concepts discussed, and Notes on Day Trading (pdf)
Disclaimer: This is the diary of a personal trading system, its methodology and the signals that it is producing. You are welcome to follow along but please understand that the information presented here is for educational purposes only. No recommendations are being made to buy, or sell stocks, options or futures contracts. Please consult your own financial advisor before making any investment decisions.
Market continues higher with another pop and grind higher.
Price above the gray channel and becoming increasingly dangerous.
Buy Signal continues.
To receive detailed daily analysis, guidance and the updated daily Buy / Sell trigger levels being generated by the Trading the Line system before the market opens, and intra-day alerts when appropriate, please become a Member and Sign up for Alerts & Observations – includes access to Members Area, Explanatory Notes (pdf) for all of the concepts discussed, and Notes on Day Trading (pdf)
Disclaimer: This is the diary of a personal trading system, its methodology and the signals that it is producing. You are welcome to follow along but please understand that the information presented here is for educational purposes only. No recommendations are being made to buy, or sell stocks, options or futures contracts. Please consult your own financial advisor before making any investment decisions.