Priam saw him first, with his old man's eyes,
A single point of light on Troy's dusty plain.
Sirius rises late in the dark, liquid sky
On summer nights, star of stars,
Orion's Dog they call it, brightest
Of all, but an evil portent, bringing heat
And fevers to suffering humanity.
Achilles' bronze gleamed like this as he ran.
The Iliad by Homer, c 8th century BC
(Stanley Lombardo, 1997)
…
The market shrugs off all concerns and heads higher, 7 days in a row…
The dog days of summer begin.
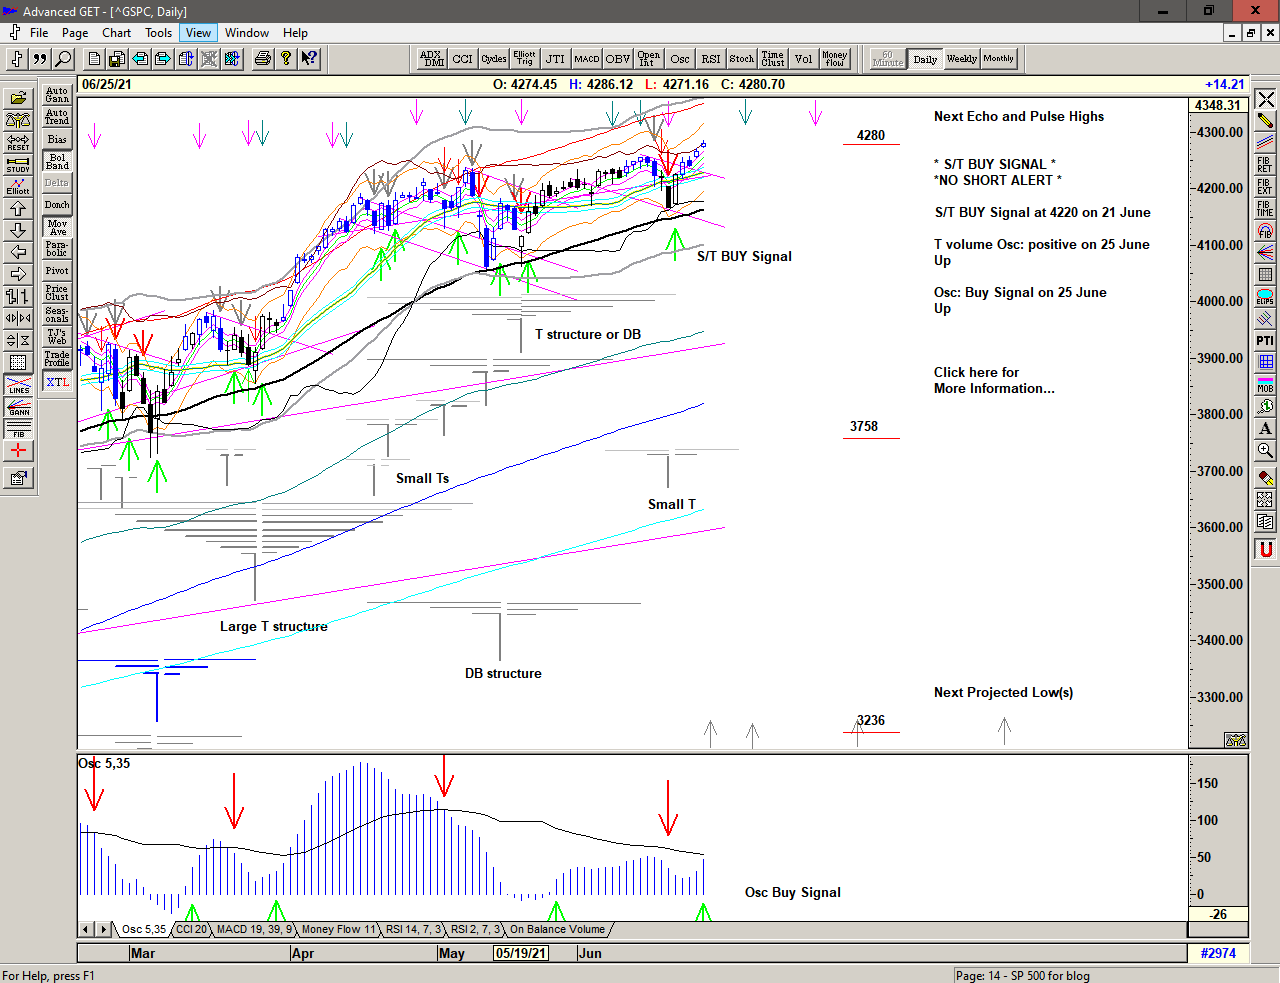
The Buy Signal triggered on 21 June continues.
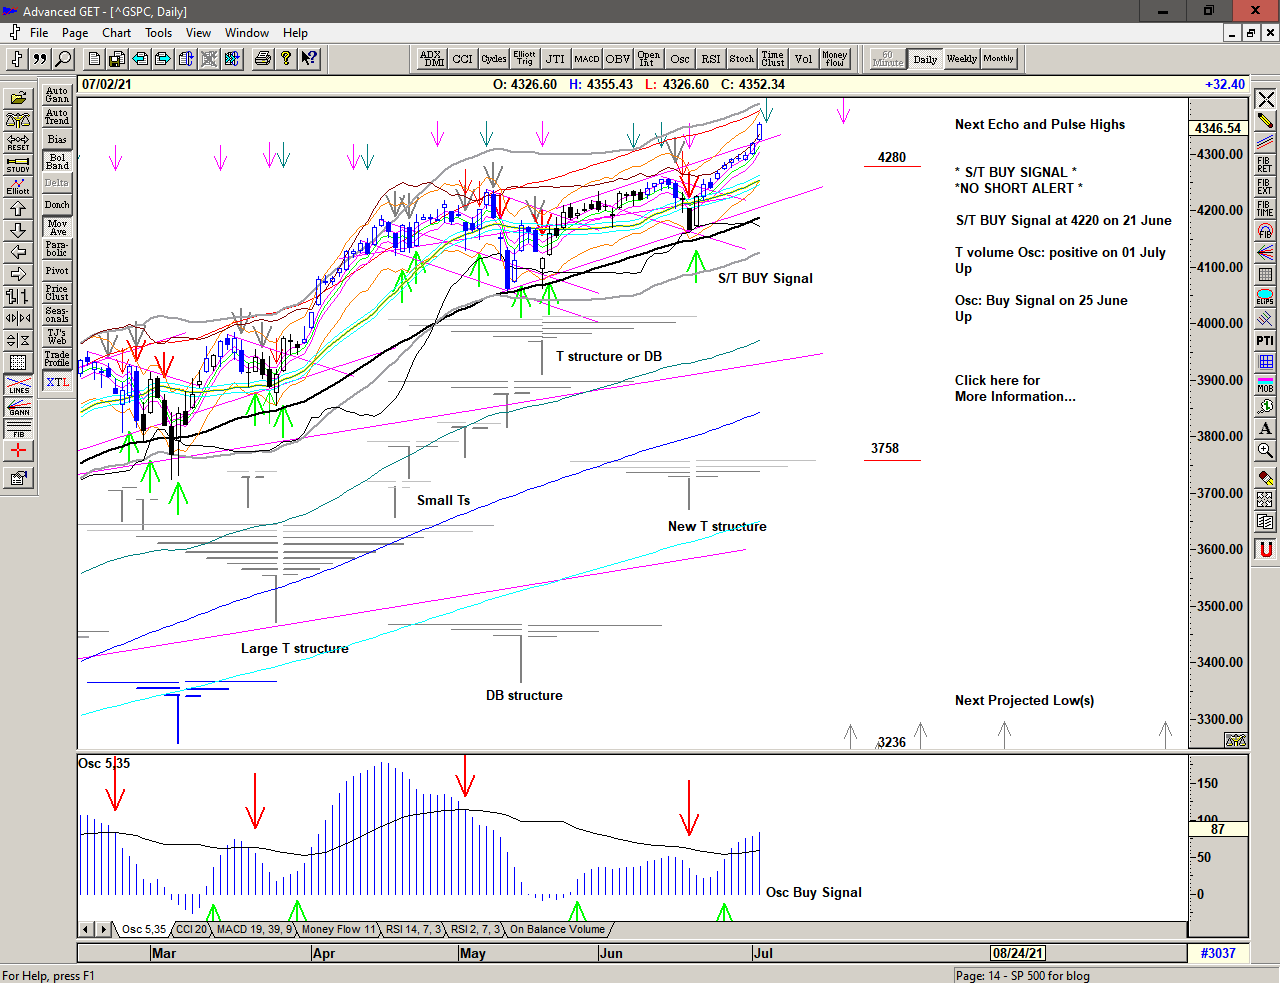
Save the image to your desktop to view a larger version
Pushing above the rising trajectory since 24 May and releasing the energy built up during the last few months of 'range trading' to the upside and looking for the next resistance level.
Over-extended by most 'normal' metrics and at or near to the next projection for a high by the new T structure centered at the 18 June low but further projections are certainly possible.
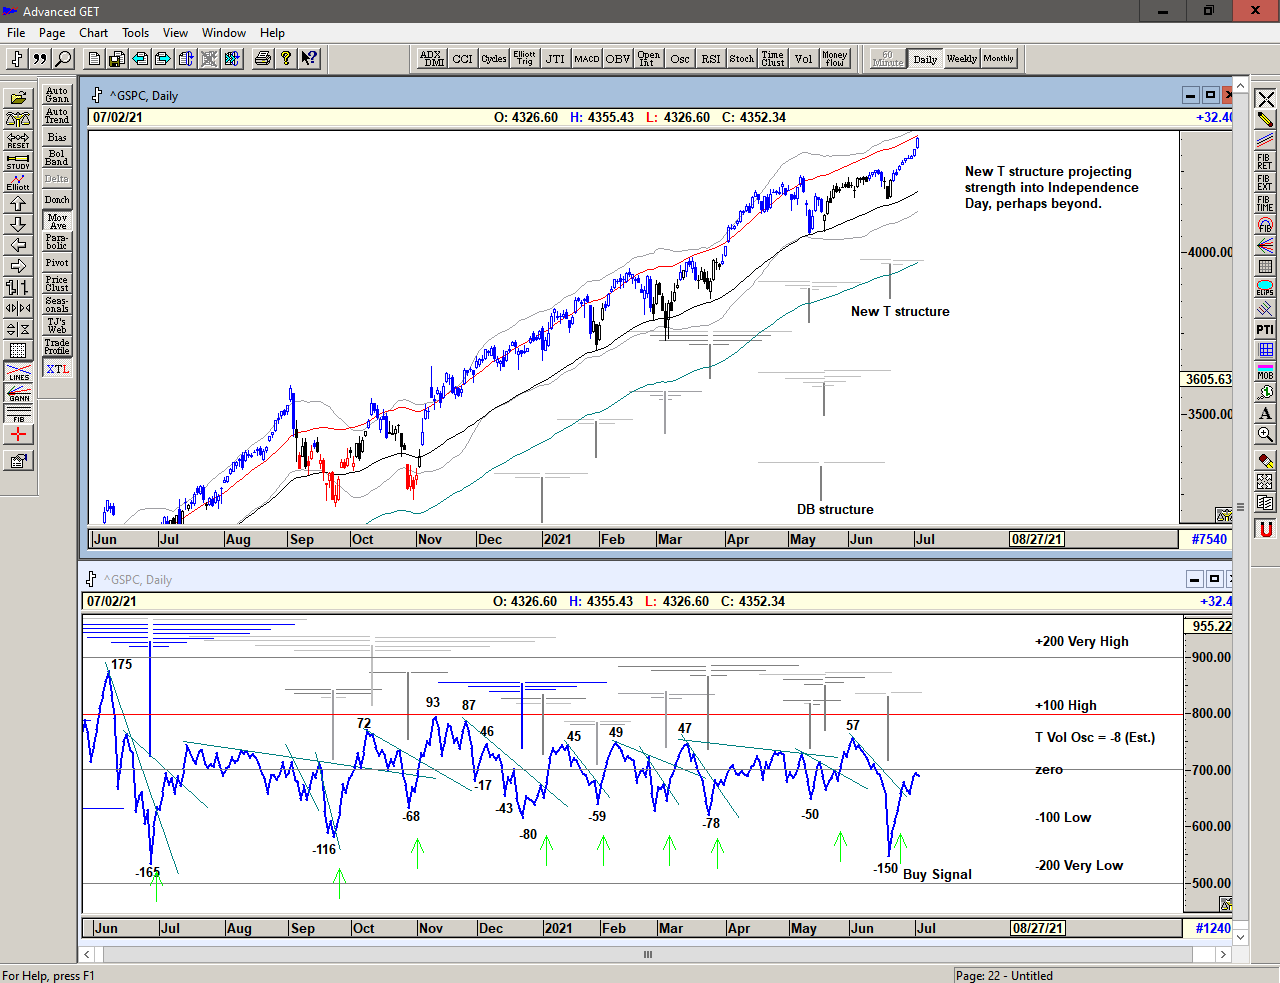
Save the image to your desktop to view a larger version
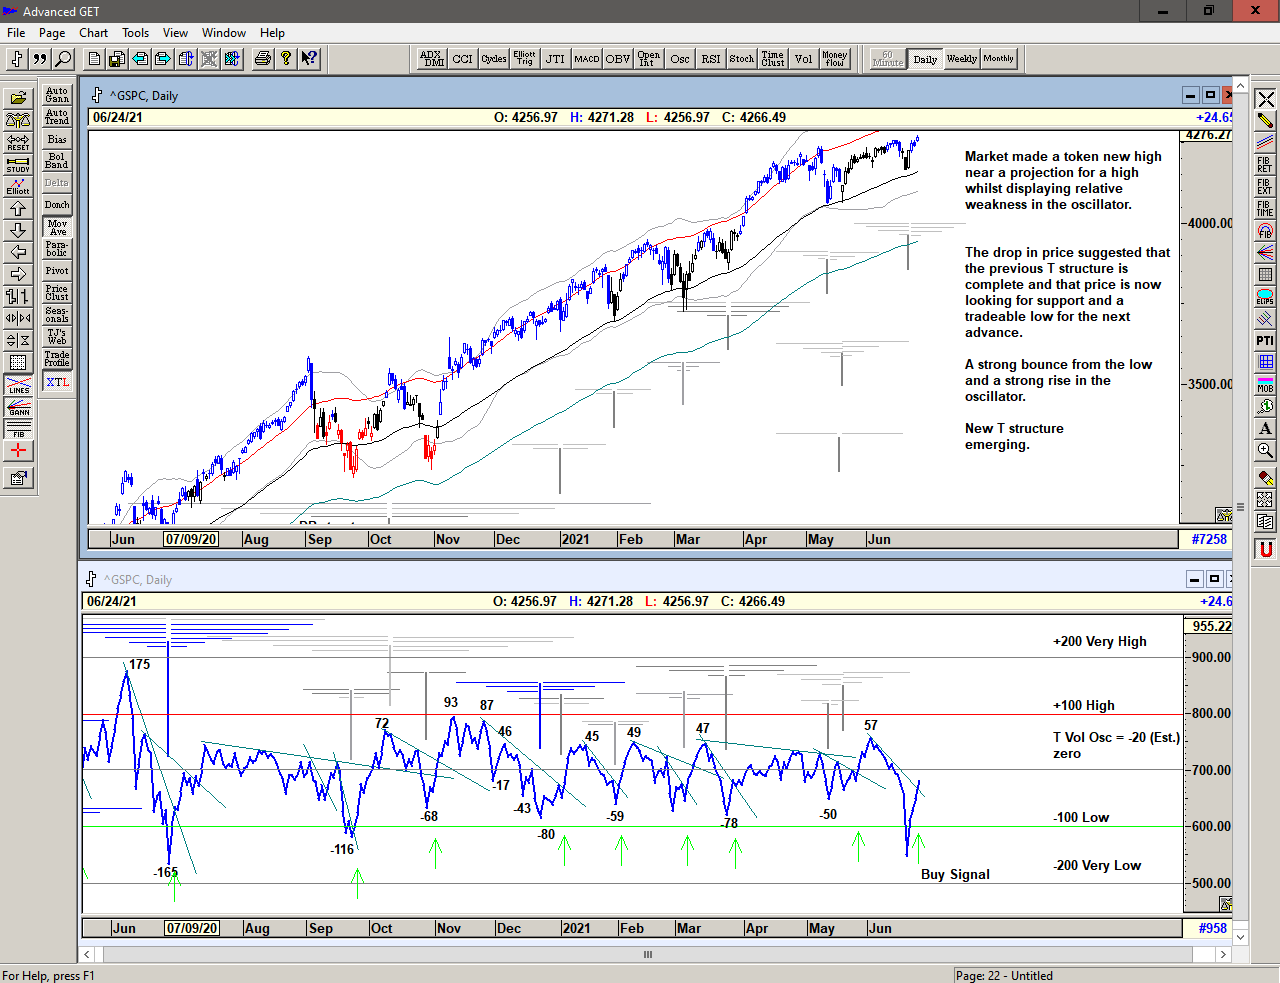
The T volume oscillator 1 has risen from the low value on 18 June and moved up through the cash build up line 2 on 24 June – a T Theory oscillator Buy Signal.
The oscillator however, remains relatively weak compared to the price action and this is indicating profit-taking under the hood and perhaps a lack of conviction or participation in the current advance. We should therefore expect some consolidation in due course,
1 The T volume oscillator is an indication of Buying Power within the market as a whole
2 The cash build-up line is a declining line drawn above a series of lower highs made in the oscillator.
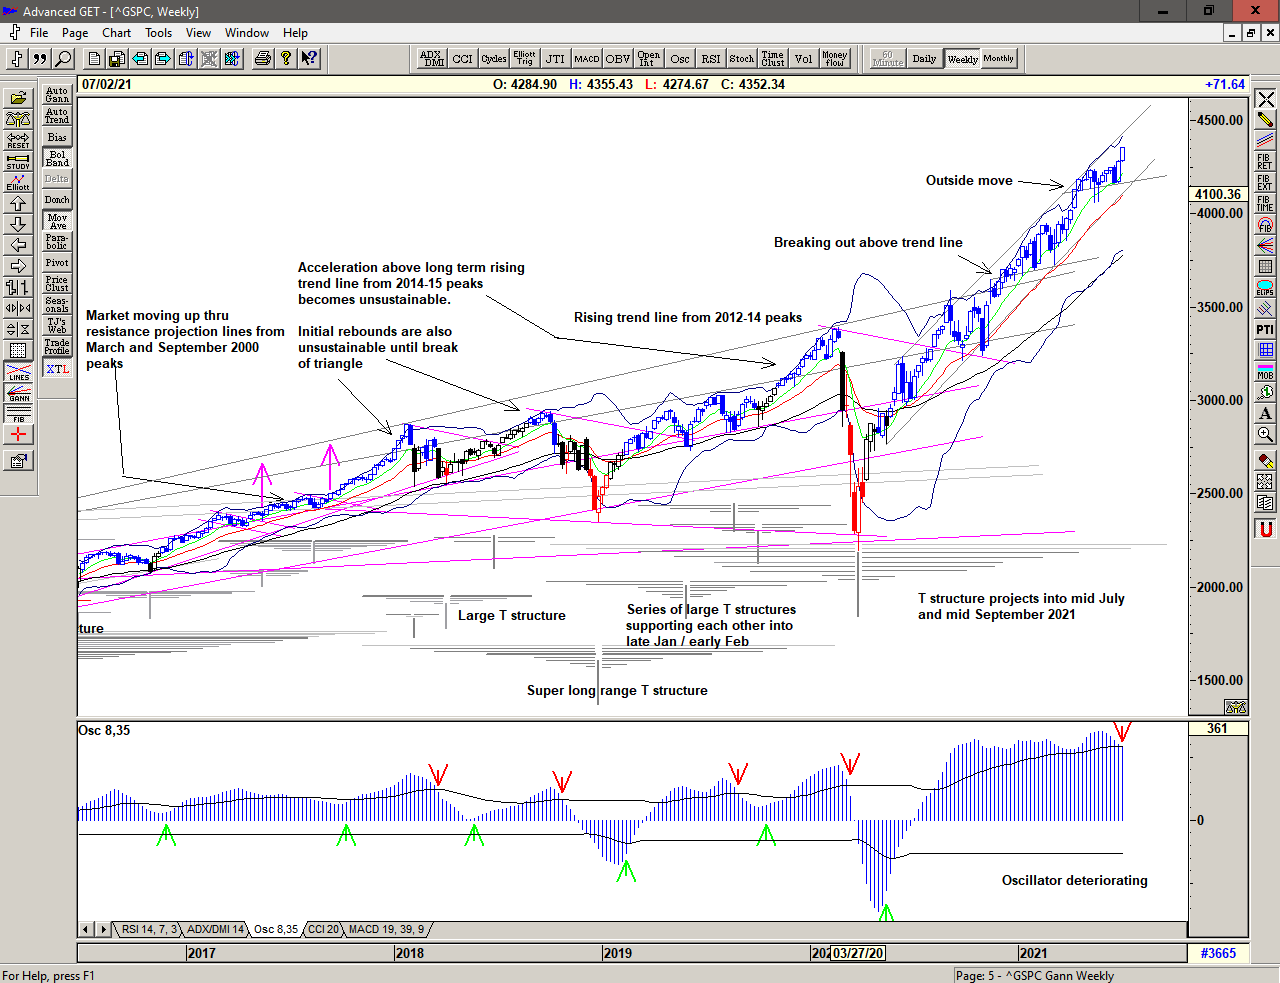
Save the image to your desktop to view a larger version
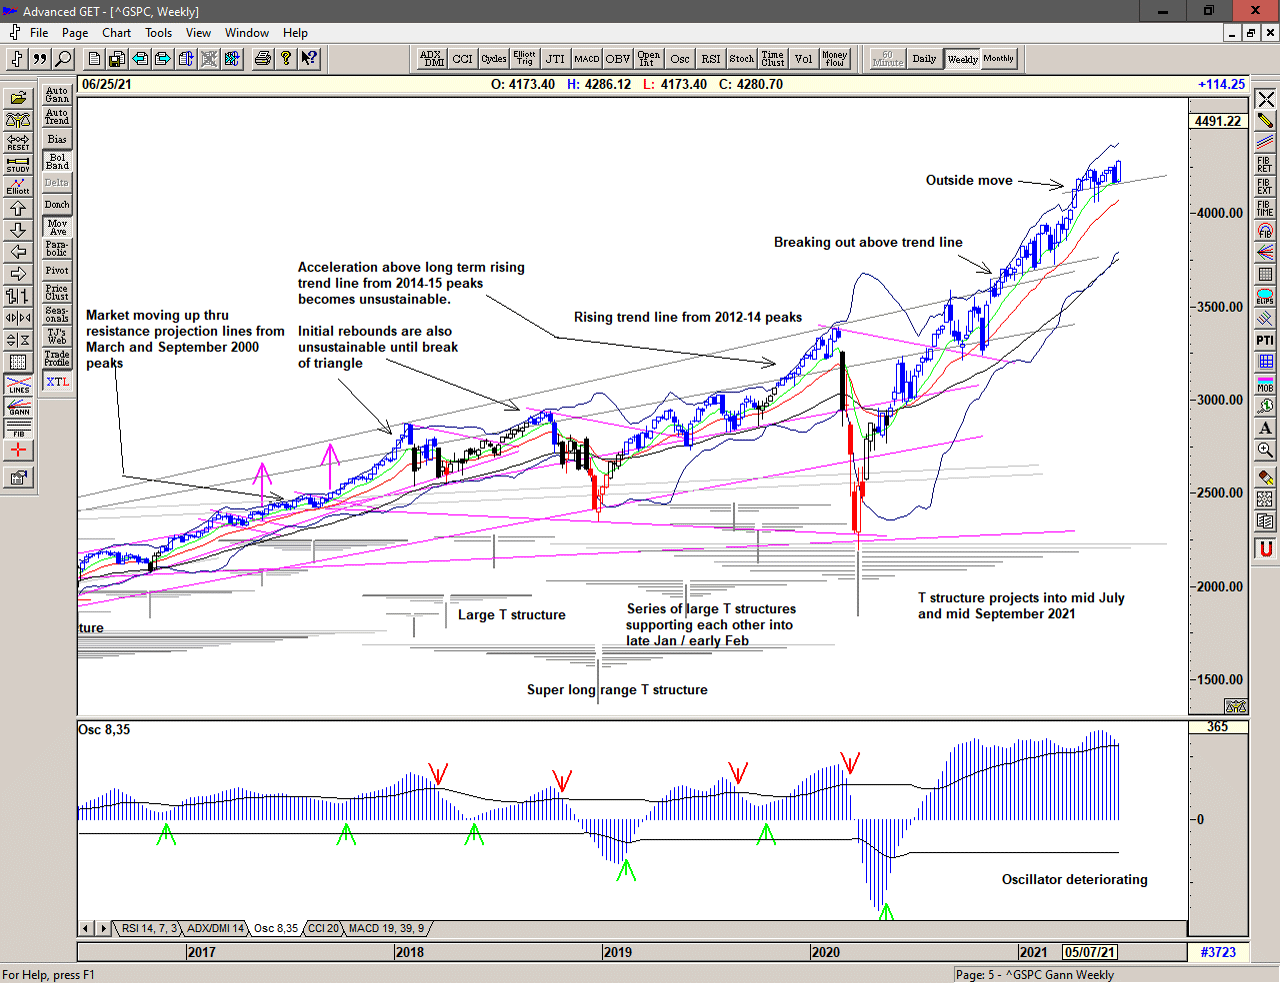
In the weekly chart above, we can see that price continues to be strong within a rising channel established over the past year, The oscillator is however, declining and this is flashing a warning that this move may not be sustainable. The large structure, centered at the March 2020 low projects strength into Mid July and possibly into Mid September.
For now, the 4160 level is important support.
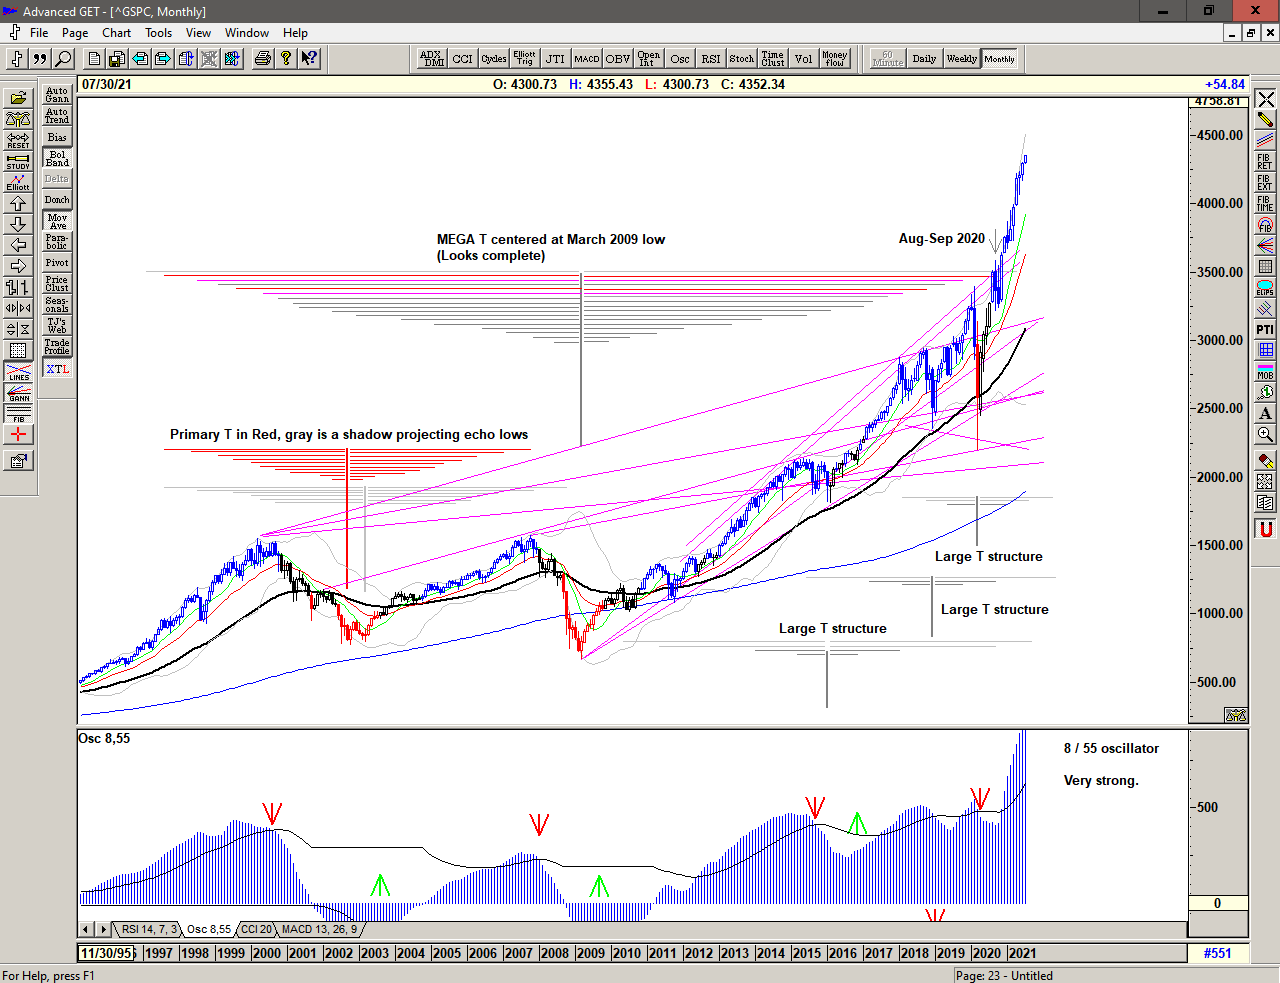
Save the image to your desktop to view a larger version
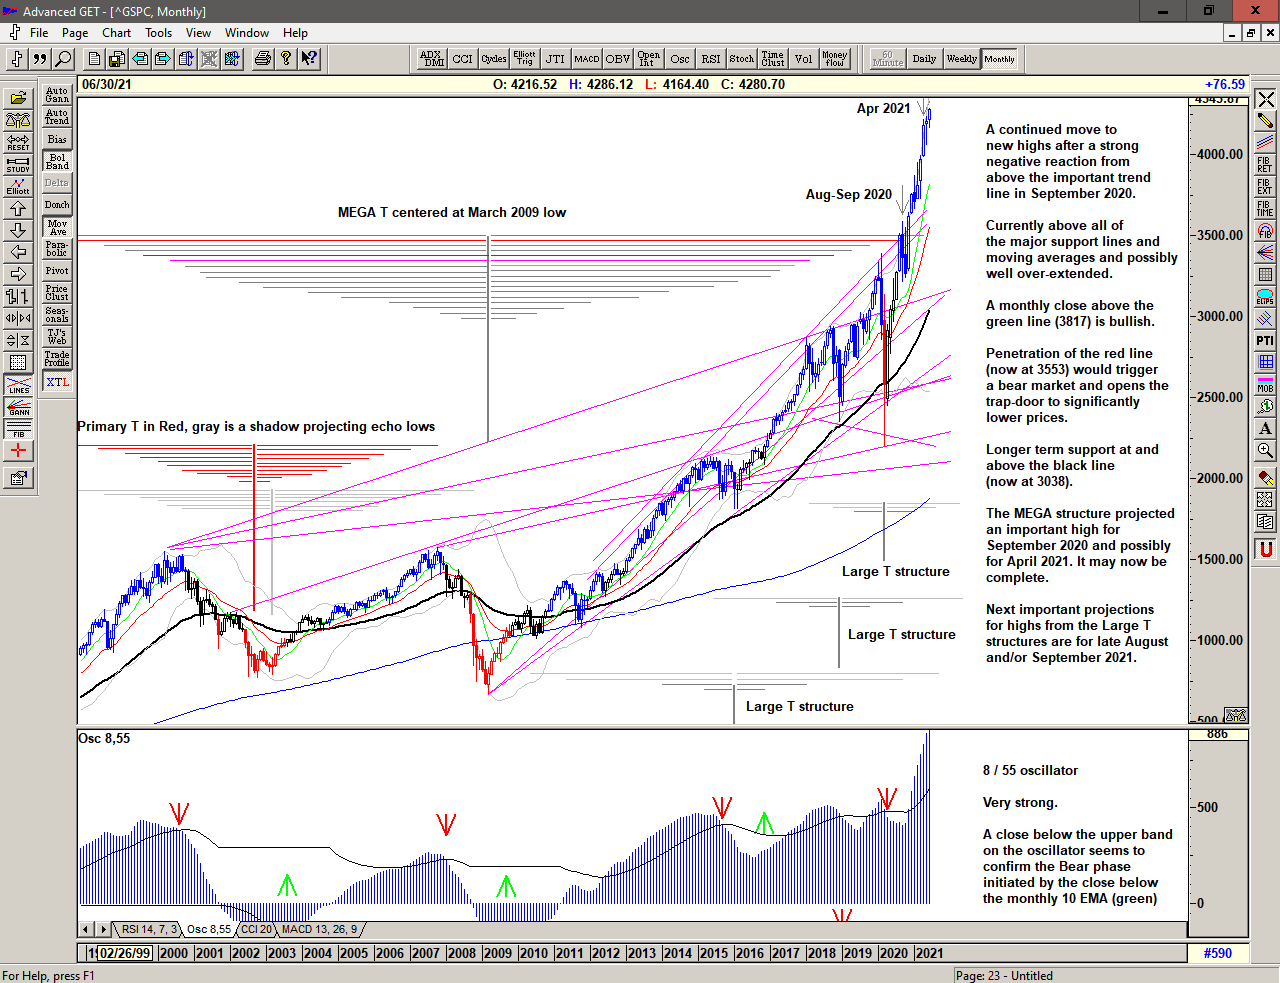
The monthly chart continues to look excessive but the market continues higher beyond the projection for a major high from the Mega T structure, which may have completed in September 2020.
The current large structures project highs for August and/or for September 2021 and possibly longer into April 2022.
…
2021 continues with a range that has become increasingly expansive since the move above 2500. With price above 4300 we can only assume that this will continue. This is a Brave New World.
–
Regardless of whether the market can continue higher or whether significant lows are ahead of us, the simplicity of the proprietary price based S/T Signalling System will continue to keep us on the correct side of the market, with price currently on a Buy Signal since moving above 4220 on 21 June 2021.
If you would like to learn more about using the S/T Signalling System please get in touch.
–
To receive detailed daily analysis, guidance and the updated daily Buy / Sell trigger levels being generated by the Trading the Line system before the market opens, and intra-day alerts when appropriate, please become a Member and Sign up for Alerts & Observations – includes access to Members Area, Explanatory Notes (pdf) for all of the concepts discussed, and Notes on Day Trading (pdf)
Disclaimer: This is the diary of a personal trading system, its methodology and the signals that it is producing. You are welcome to follow along but please understand that the information presented here is for educational purposes only. No recommendations are being made to buy, or sell stocks, options or futures contracts. Please consult your own financial advisor before making any investment decisions.