S/T SELL SIGNAL active below 4300

Market gaps down significantly, well below the SELL Signal line – making short entry difficult and risky – quickly moving lower after initial buying, until a strong bounce at 4244 into 4265. Another wave of selling into lows at 4235 and a choppy afternoon sets up a bounce into the close.

Sell Signal active

Matsuri

Market gaps higher into 4373 but is met with persistent selling, dropping through the Cover Signal line at 4352, attempting a recovery but failing and continuing to decline in afternoon action.

A Cover  Signal.

Chart of S&P 500 for 17 July 2021

To receive detailed daily analysis, guidance and the updated daily Buy / Sell trigger levels being generated by the Trading the Line system before the market opens, and intra-day alerts when appropriate, please become a Member and Sign up for Alerts & Observations – includes access to Members Area, Explanatory Notes (pdf) for all of the concepts discussed, and Notes on Day Trading (pdf)

Disclaimer: This is the diary of a personal trading system, its methodology and the signals that it is producing. You are welcome to follow along but please understand that the information presented here is for educational purposes only. No recommendations are being made to buy, or sell stocks, options or futures contracts. Please consult your own financial advisor before making any investment decisions.

Velodrome

A gap lower and choppiness with a brief look below the Cover Signal level, recovering in afternoon action and holding onto 4350.

Buy Signal continues.

Chart of S&P 500 for 16 July 2021

To receive detailed daily analysis, guidance and the updated daily Buy / Sell trigger levels being generated by the Trading the Line system before the market opens, and intra-day alerts when appropriate, please become a Member and Sign up for Alerts & Observations – includes access to Members Area, Explanatory Notes (pdf) for all of the concepts discussed, and Notes on Day Trading (pdf)

Disclaimer: This is the diary of a personal trading system, its methodology and the signals that it is producing. You are welcome to follow along but please understand that the information presented here is for educational purposes only. No recommendations are being made to buy, or sell stocks, options or futures contracts. Please consult your own financial advisor before making any investment decisions.

Dioscuri

A quick look at the all time high is followed by choppy profit-taking but holding up above 4370.

Buy Signal continues.

Chart of S&P 500 for 15 July 2021

To receive detailed daily analysis, guidance and the updated daily Buy / Sell trigger levels being generated by the Trading the Line system before the market opens, and intra-day alerts when appropriate, please become a Member and Sign up for Alerts & Observations – includes access to Members Area, Explanatory Notes (pdf) for all of the concepts discussed, and Notes on Day Trading (pdf)

Disclaimer: This is the diary of a personal trading system, its methodology and the signals that it is producing. You are welcome to follow along but please understand that the information presented here is for educational purposes only. No recommendations are being made to buy, or sell stocks, options or futures contracts. Please consult your own financial advisor before making any investment decisions.

Dream

Earth is gold, sea is green
The dream belongs to the dreamer
Starlit night, moonlight bright
The dream belongs to the dreamer…

Ian Brown, The Dream And The Dreamer, 2019

..

A push to token new highs at 4388 and 4392 before a choppy decline in afternoon action.

Buy Signal continues for now.

Chart of S&P 500 for 14 July 2021

To receive detailed daily analysis, guidance and the updated daily Buy / Sell trigger levels being generated by the Trading the Line system before the market opens, and intra-day alerts when appropriate, please become a Member and Sign up for Alerts & Observations – includes access to Members Area, Explanatory Notes (pdf) for all of the concepts discussed, and Notes on Day Trading (pdf)

Disclaimer: This is the diary of a personal trading system, its methodology and the signals that it is producing. You are welcome to follow along but please understand that the information presented here is for educational purposes only. No recommendations are being made to buy, or sell stocks, options or futures contracts. Please consult your own financial advisor before making any investment decisions.

Mystica

Market pushes and grinds higher.

Buy Signal continues.

Chart of S&P 500 for 13 July 2021

To receive detailed daily analysis, guidance and the updated daily Buy / Sell trigger levels being generated by the Trading the Line system before the market opens, and intra-day alerts when appropriate, please become a Member and Sign up for Alerts & Observations – includes access to Members Area, Explanatory Notes (pdf) for all of the concepts discussed, and Notes on Day Trading (pdf)

Disclaimer: This is the diary of a personal trading system, its methodology and the signals that it is producing. You are welcome to follow along but please understand that the information presented here is for educational purposes only. No recommendations are being made to buy, or sell stocks, options or futures contracts. Please consult your own financial advisor before making any investment decisions.


Maya

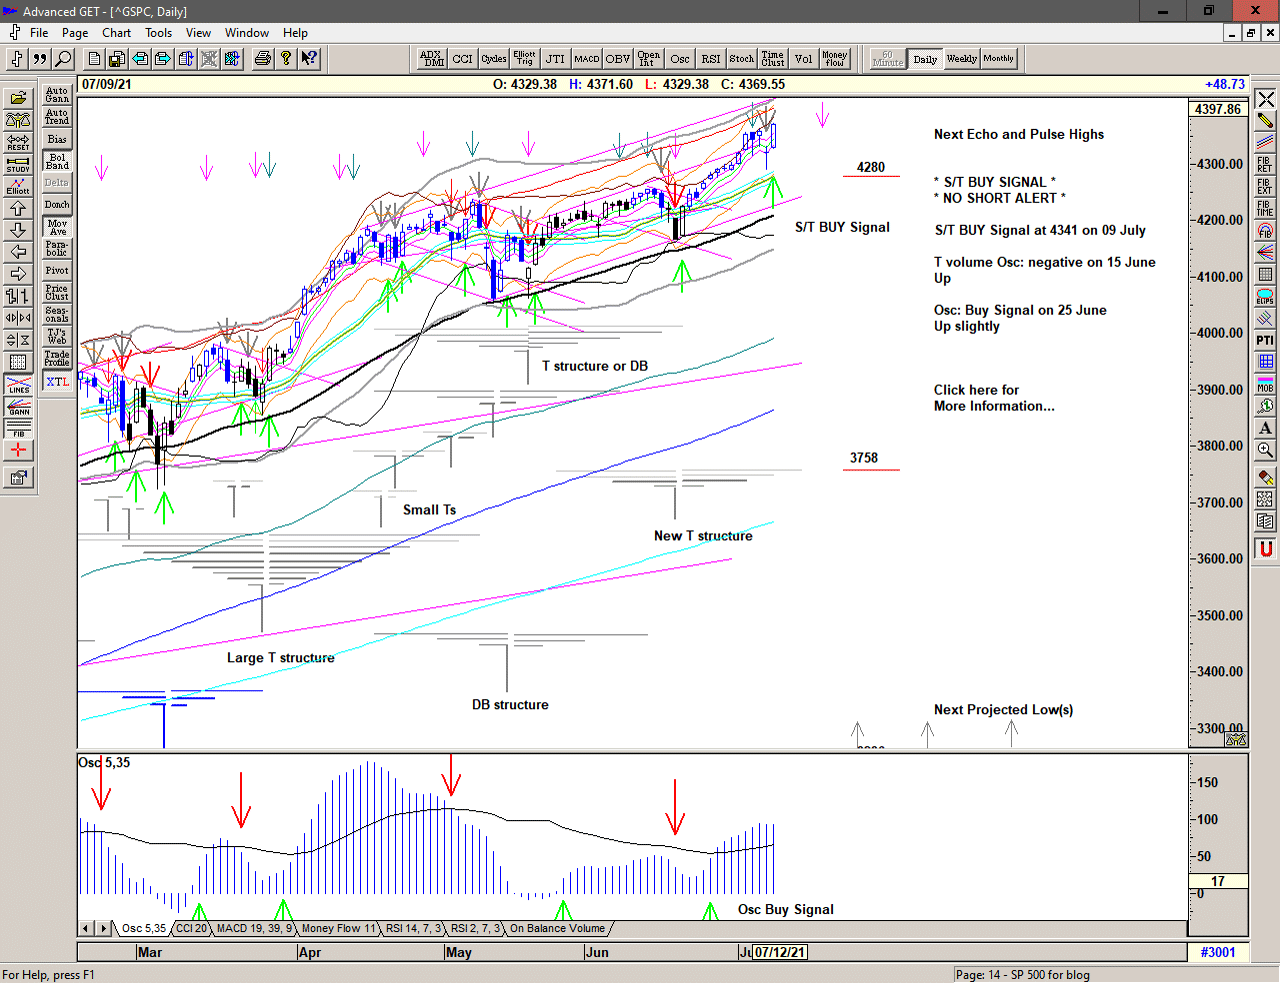
A roller-coaster week in response to the holiday push above 4300 with a drop into Thursday's low at 4290 and new S/T Buy Signal triggered on 09 June at 4341.

Daily chart of S&P 500 for 12 July 2021

Save the image to your desktop to view a larger version

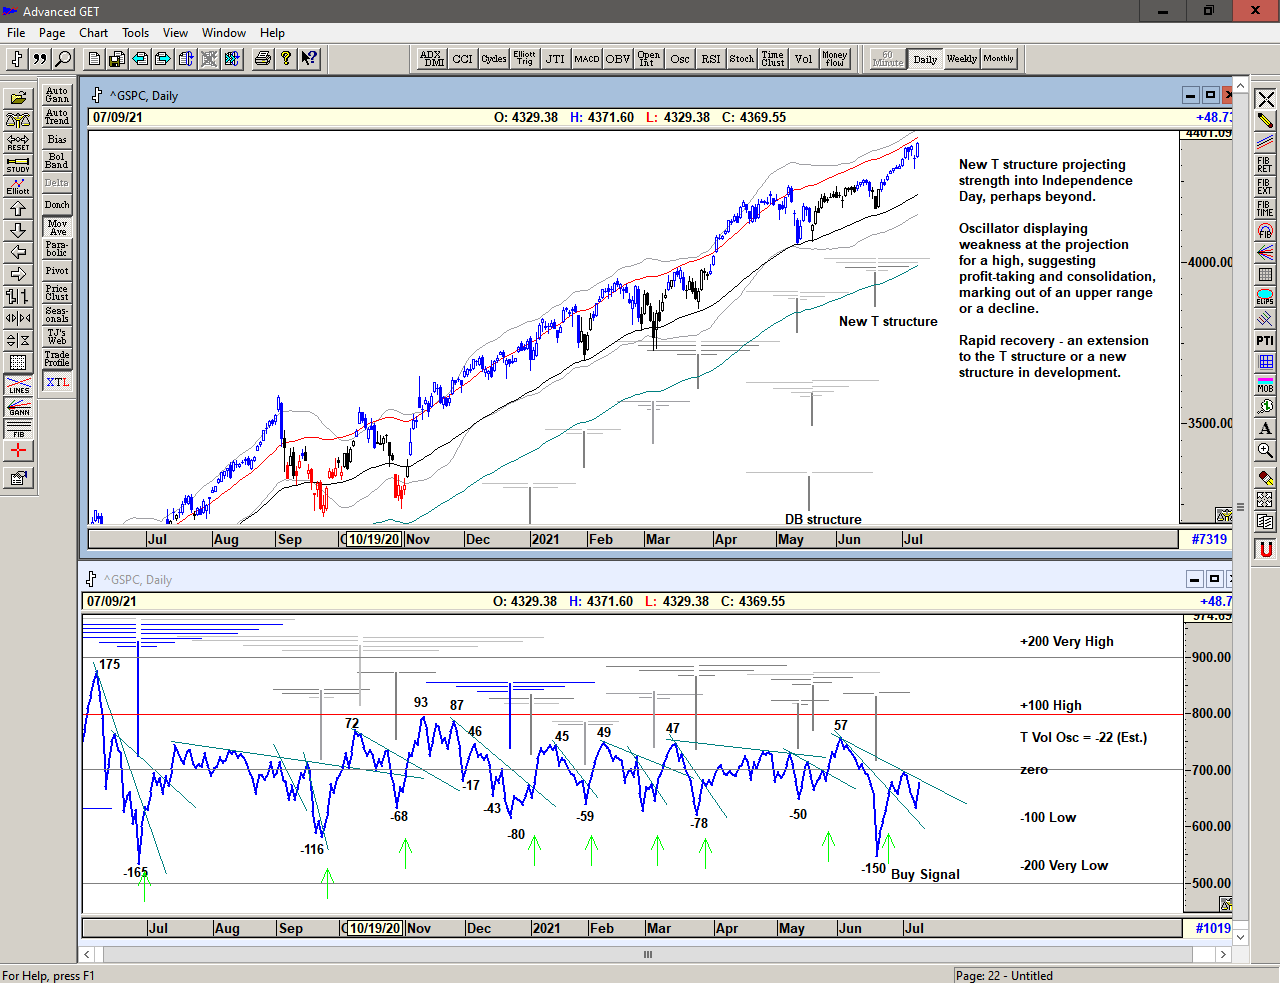
Making new all time highs with an impressive and very rapid move from low to high but still displaying (some) weakness in the oscillators and questioning the conviction for higher prices.

Chart of S&P 500 with T volume oscillator for 12 July 2021

Save the image to your desktop to view a larger version

The T volume oscillator 1 was warning of weakness at the previous high, and is still negative and this is indicating profit-taking under the hood and perhaps a lack of conviction or participation in the current advance. However further strength and a rise upwards through the shallower cash build up line would activate another oscillator Buy Signal and suggest that the current T structure is larger or that a new structure is in development.

1 The T volume oscillator is an indication of Buying Power within the market as a whole
2 The cash build-up line is a declining line drawn above a series of lower highs made in the oscillator.

Weekly chart of S&P 500 for 12 July 2021

Save the image to your desktop to view a larger version

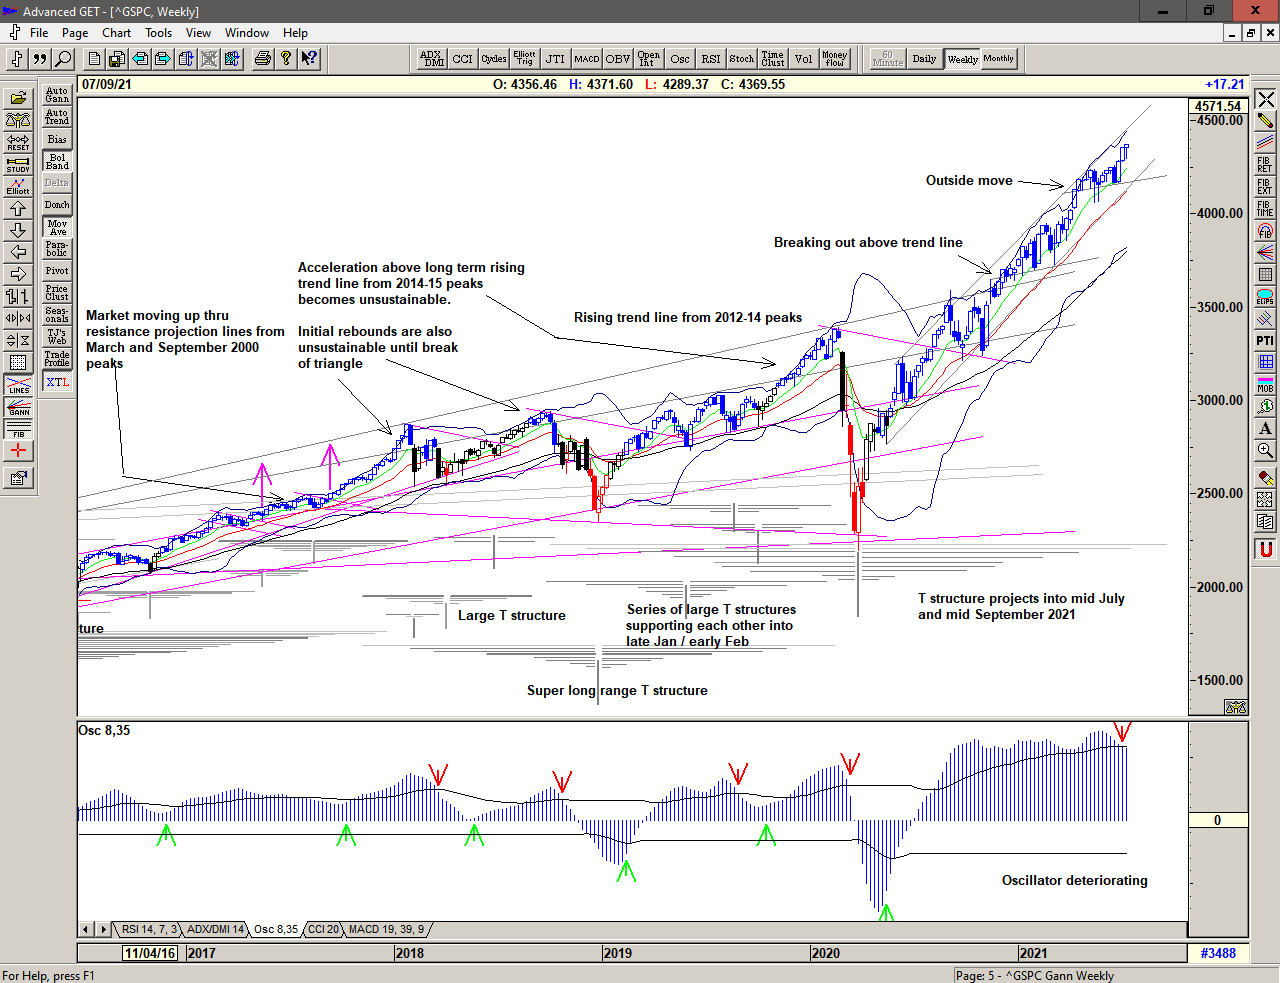
In the weekly chart above, we can see that price continues to be strong within a rising channel established over the past year, The oscillator is however, declining and this is flashing a warning that this move may not be sustainable, much longer. The large structure, centered at the March 2020 low projects strength into Mid July and possibly into Mid September.

For now, the 4170 level is important support.

Monthly chart of S&P 500 for 12 July 2021

Save the image to your desktop to view a larger version

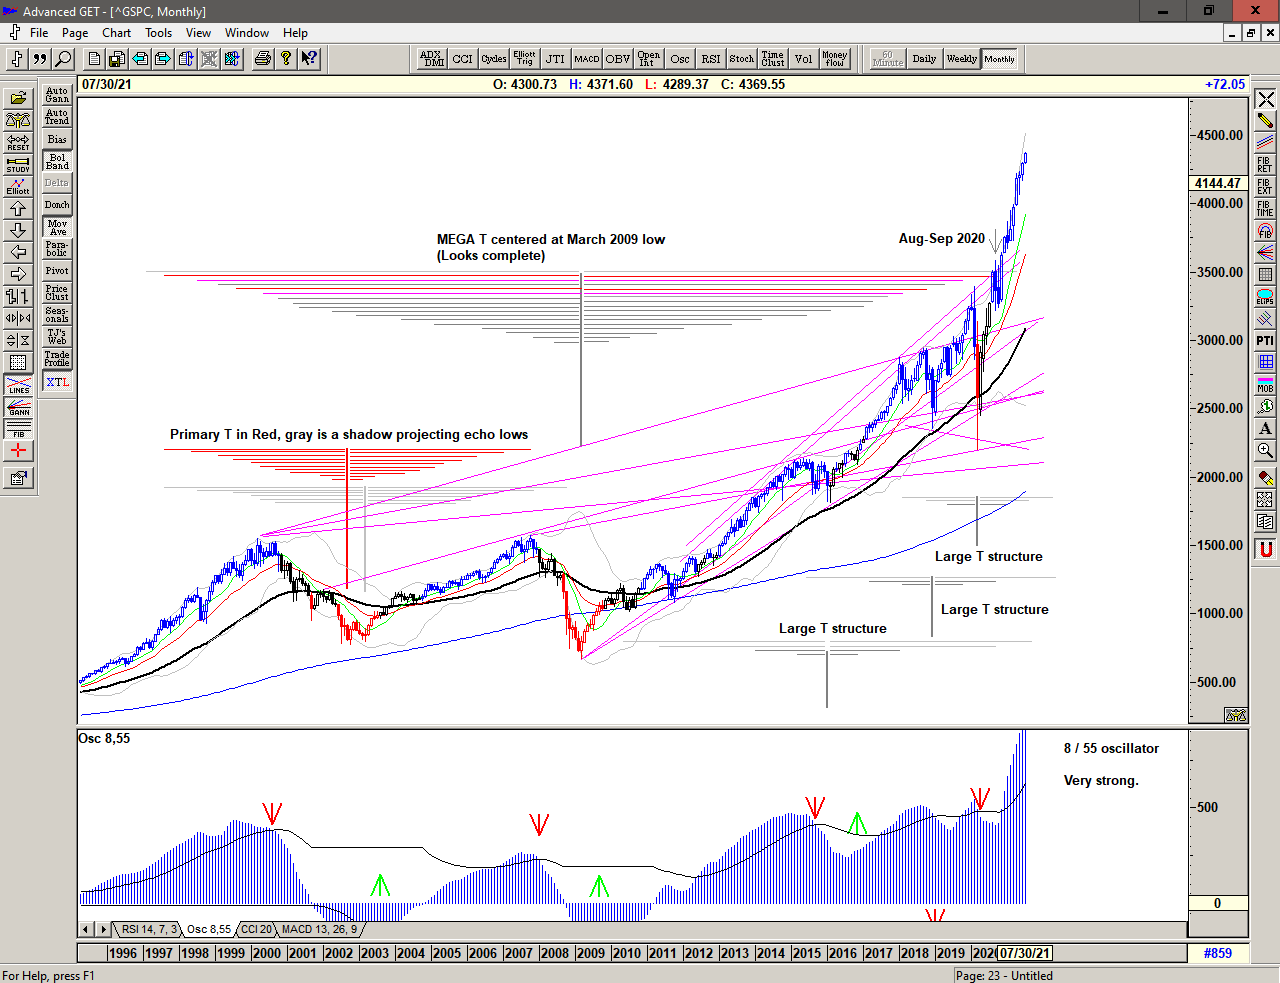
The monthly chart continues to look excessive but the market continues higher beyond the projection for a major high from the Mega T structure, which may have completed in September 2020.

The current large structures project highs for August and/or for September 2021 and possibly longer into April 2022.

2021 continues with a range that has become increasingly expansive since the move above 2500. With price above 4300 we can only assume that this will continue. This is a Brave New World.

Regardless of whether the market can continue higher or whether significant lows are ahead of us, the simplicity of the proprietary price based S/T Signalling System will continue to keep us on the correct side of the market, with price currently back on a Buy Signal since moving above 4341 on 09 July 2021.

If you would like to learn more about using the S/T Signalling System please get in touch.

To receive detailed daily analysis, guidance and the updated daily Buy / Sell trigger levels being generated by the Trading the Line system before the market opens, and intra-day alerts when appropriate, please become a Member and Sign up for Alerts & Observations – includes access to Members Area, Explanatory Notes (pdf) for all of the concepts discussed, and Notes on Day Trading (pdf)

Disclaimer: This is the diary of a personal trading system, its methodology and the signals that it is producing. You are welcome to follow along but please understand that the information presented here is for educational purposes only. No recommendations are being made to buy, or sell stocks, options or futures contracts. Please consult your own financial advisor before making any investment decisions.


S/T BUY Signal at 4341

An overnight look lower and recovery from below ES 4300 places the market up near the Buy Signal line in pre-market.

An S/T Buy Signal is active above 4341.

This could simply be a 'dead cat's bounce' – a (very) tight stop is recommended, raising the stop to breakeven as quickly as practical.