Sea is green

All numbers refer to SPX

Earth is gold, sea is green
The dream belongs to the dreamer
Starlit night, moonlight bright
The dream belongs to the dreamer

Ian Brown, The Dream And The Dreamer, 2019

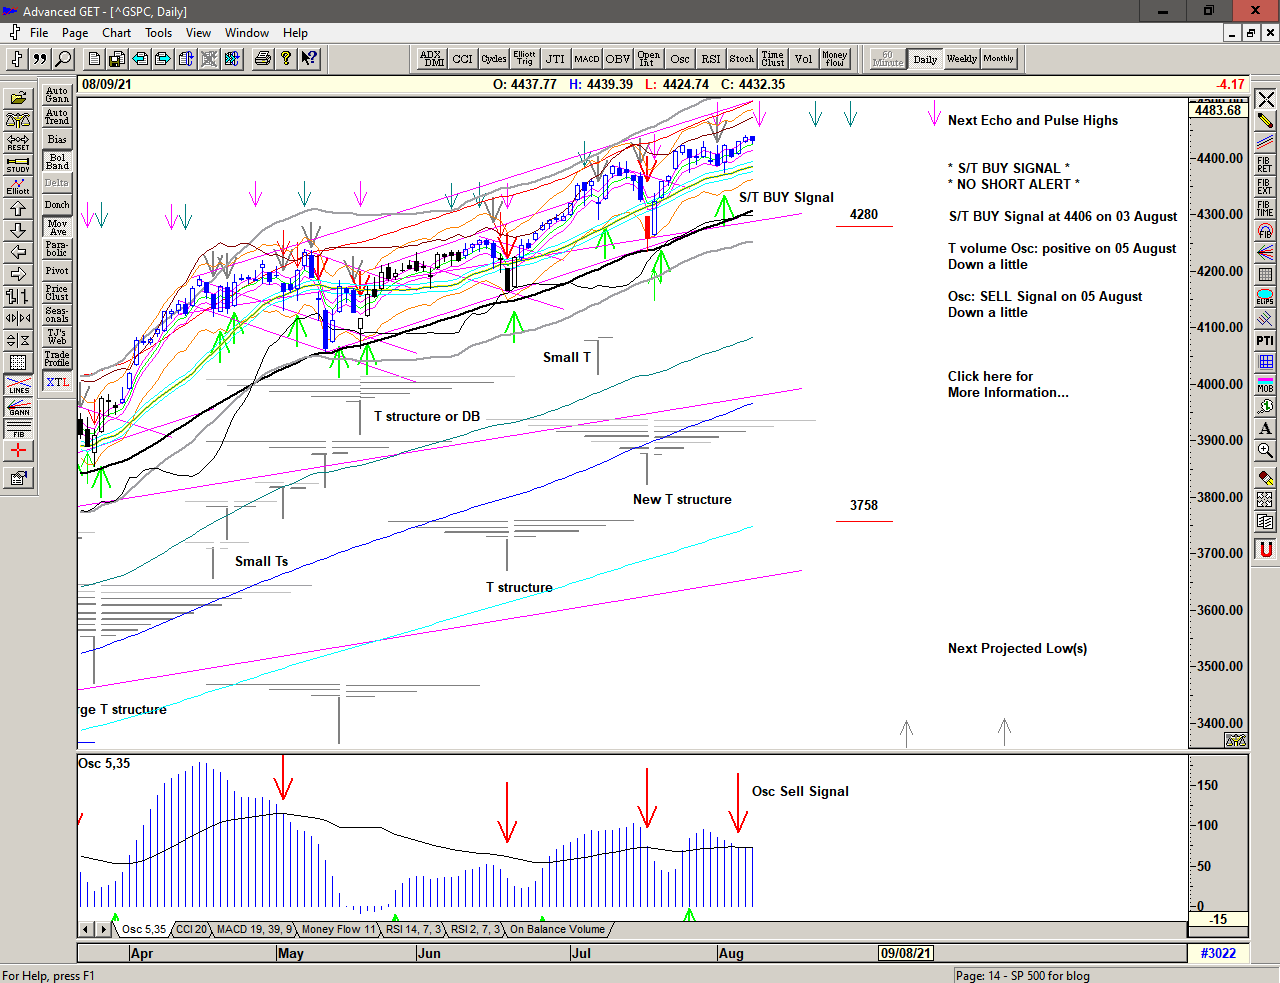
Market gradually pushing higher since breaking above 4400.

Buy Signal continues.

Daily chart of S&P 500 for 10 August 2021

Save the image to your desktop to view a larger version

A breakout above 4400 on 23 July but sideways near the high for 2 weeks.

A Cover Signal at 4389 on 02 August, but quickly reversed on 03 August with a renewed S/T Buy Signal at 4406.

Some slowing of momentum but the price action continues to be bullish with marking out of the new upper range.

Chart of S&P 500 with T volume oscillator for 10 August 2021

Save the image to your desktop to view a larger version

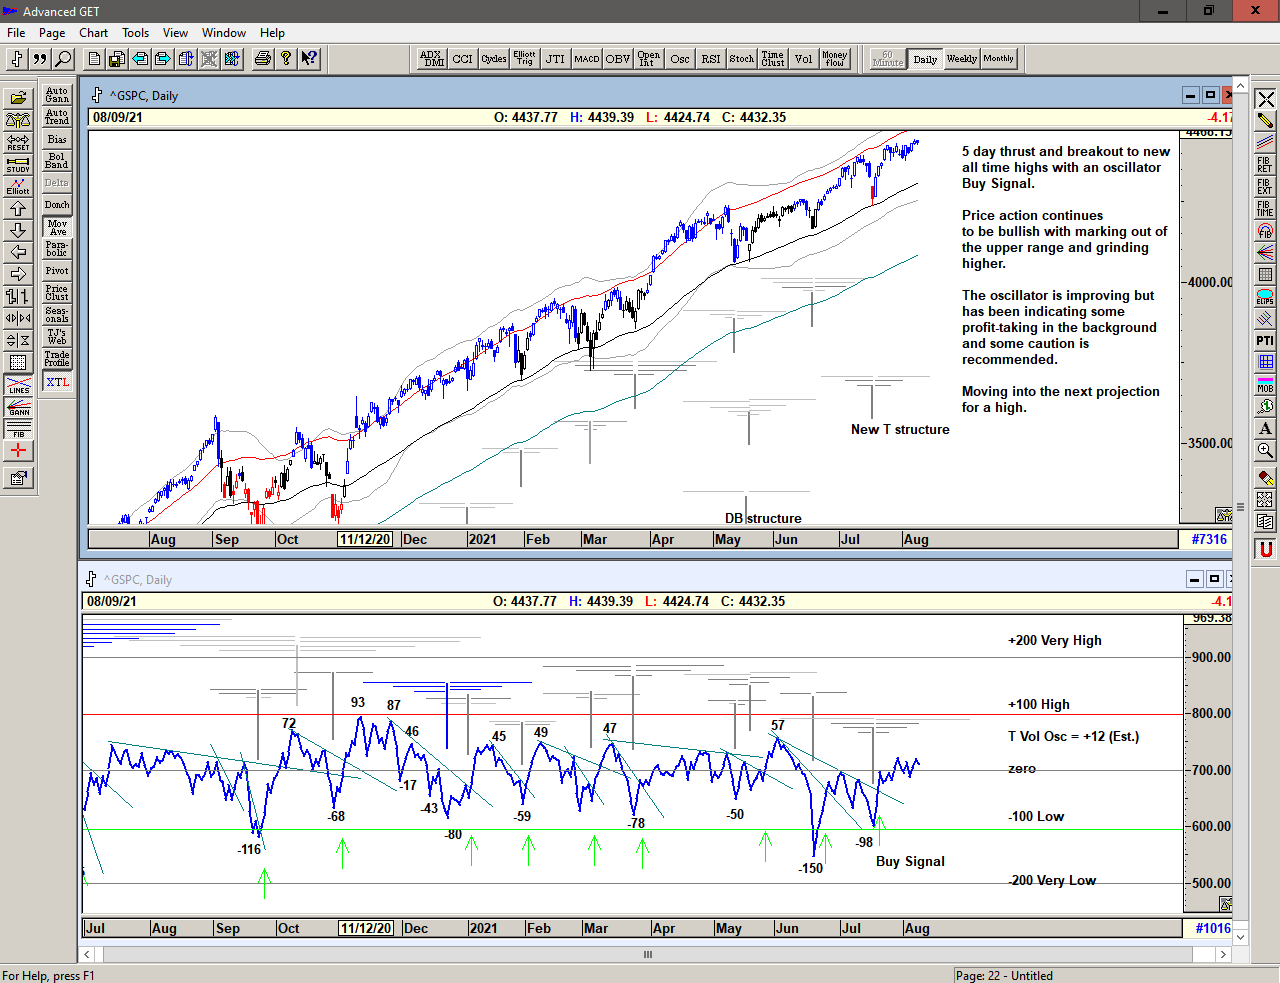
The T volume oscillator 1 made a Buy Signal on 21 July with a rise upwards through the cash build up line 2 confirming the new T structure emerging from the recent low with projections for highs from the previous oscillator and price highs for 26 July and then into 03 and 09 August, perhaps beyond with full potential into late August.

The slightly lack lustre oscillator indicates some caution with profit-taking going on in the back ground, and perhaps a lack of conviction in significantly higher prices.

1 The T volume oscillator is an indication of Buying Power within the market as a whole
2 The cash build-up line is a declining line drawn above a series of lower highs made in the oscillator.

Weekly chart of S&P 500 for 10 August 2021

Save the image to your desktop to view a larger version

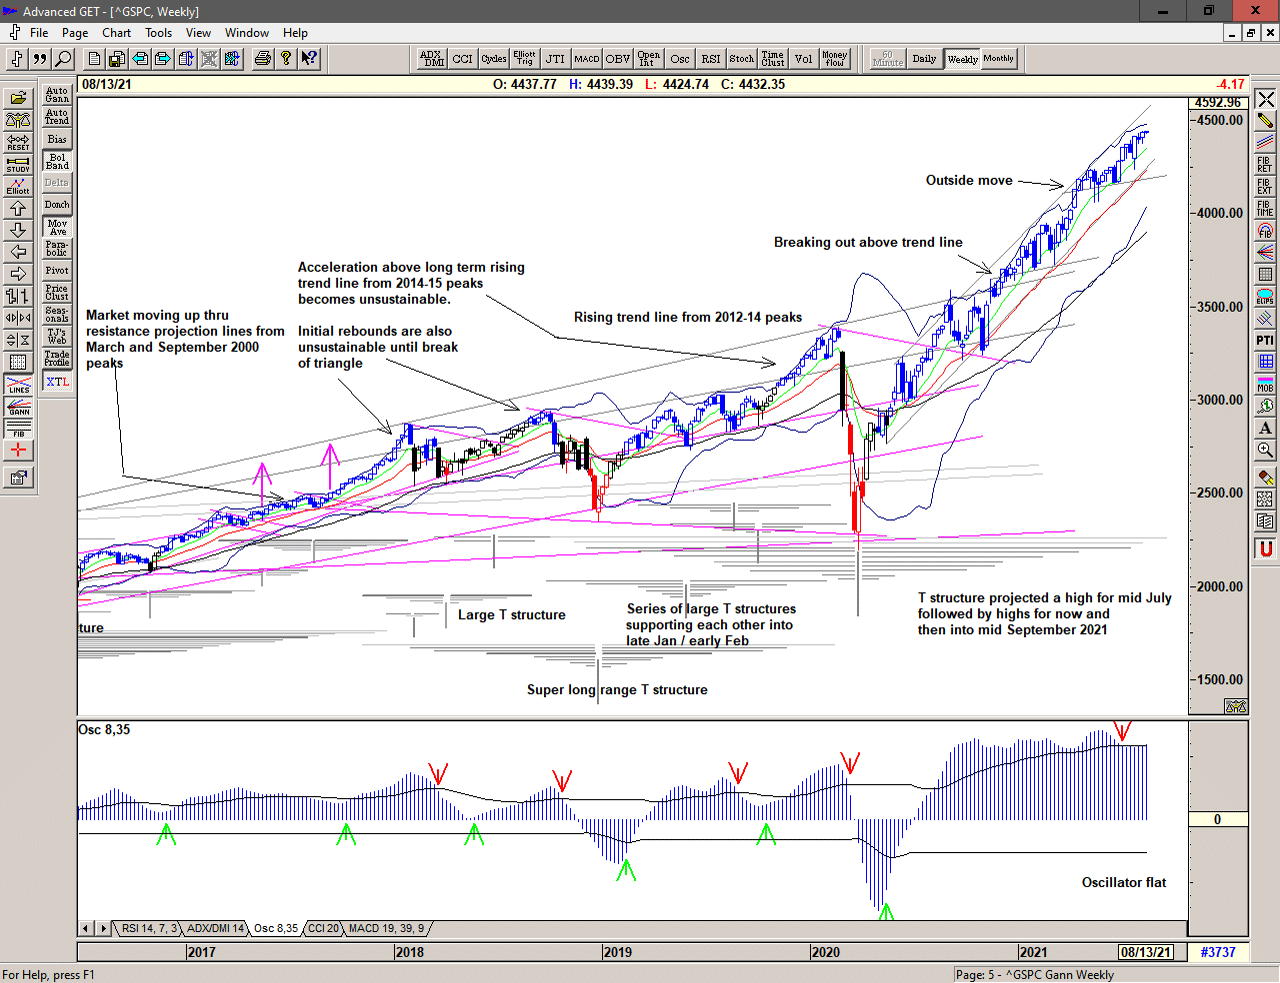
In the weekly chart above, we can see that price continues to be strong within the rising channel established over the past year, The oscillator was declining and flashing a warning of the expected weakness mid July but this appears to have been quickly resolved with the rapid reversal from 4233, which now looks like important support.

The large structure, centered at the March 2020 low projected strength into Mid July, with another projection into the first week of August and perhaps a more important high for mid September 2021.

Monthly chart of S&P 500 for 10 August 2021

Save the image to your desktop to view a larger version

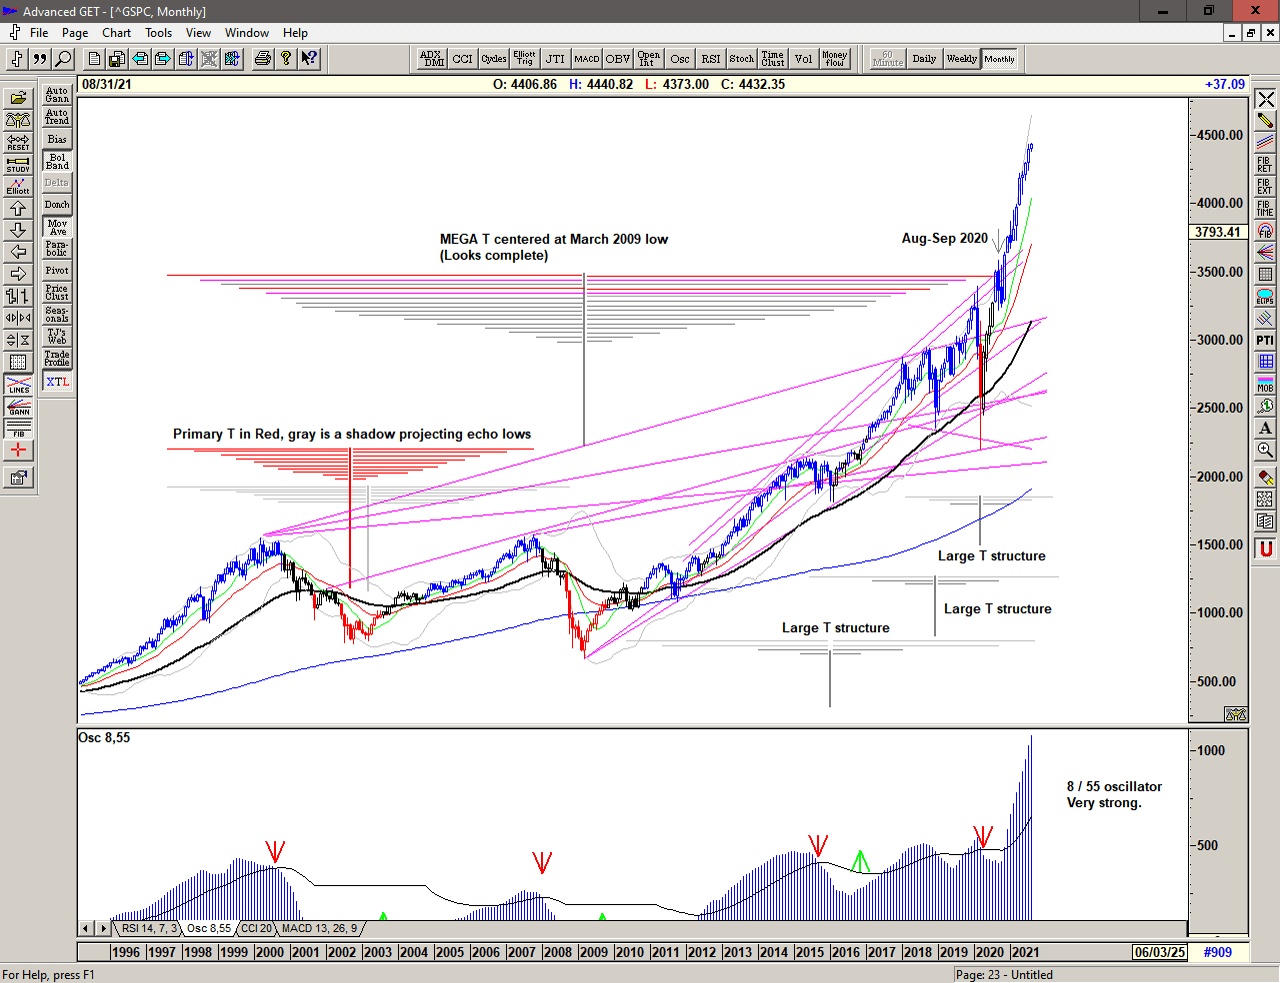
The monthly chart continues to look excessive but the market continues higher beyond the projection for a major high from the Mega T structure, which now looks like it completed with the declines in February 2020 and September 2020.

The current large structures project highs for August and/or for September 2021 and possibly longer into April 2022.

We should therefore be prepared for a change in direction to occur soon.

2021 continues with a range that has become increasingly expansive since the move above 2500. With price above 4400 we can only assume that this will continue. This is a Brave New World and we should trade accordingly.

Regardless of whether the market can continue higher or whether significant lows are ahead of us, the simplicity of the proprietary price based S/T Signalling System will continue to keep us on the correct side of the market, with price currently back on a Buy Signal since moving above 4406 on 03 August 2021.

If you would like to learn more about using the S/T Signalling System please get in touch.

To receive detailed daily analysis, guidance and the updated daily Buy / Sell trigger levels being generated by the Trading the Line system before the market opens, and intra-day alerts when appropriate, please become a Member and Sign up for Alerts & Observations – includes access to Members Area, Explanatory Notes (pdf) for all of the concepts discussed, and Notes on Day Trading (pdf)

Disclaimer: This is the diary of a personal trading system, its methodology and the signals that it is producing. You are welcome to follow along but please understand that the information presented here is for educational purposes only. No recommendations are being made to buy, or sell stocks, options or futures contracts. Please consult your own financial advisor before making any investment decisions.


Telegraph

Market gaps up into 4440 and trades sideways at the new high.

Buy Signal continues.

Chart of S&P 500 for 09 August 2021

To receive detailed daily analysis, guidance and the updated daily Buy / Sell trigger levels being generated by the Trading the Line system before the market opens, and intra-day alerts when appropriate, please become a Member and Sign up for Alerts & Observations – includes access to Members Area, Explanatory Notes (pdf) for all of the concepts discussed, and Notes on Day Trading (pdf)

Disclaimer: This is the diary of a personal trading system, its methodology and the signals that it is producing. You are welcome to follow along but please understand that the information presented here is for educational purposes only. No recommendations are being made to buy, or sell stocks, options or futures contracts. Please consult your own financial advisor before making any investment decisions.


Boy

Market gaps up and pushes higher into 4423, sideways and then up into a strong close at 4429.

Buy Signal continues

Chart of S&P 500 for 06 August 2021

To receive detailed daily analysis, guidance and the updated daily Buy / Sell trigger levels being generated by the Trading the Line system before the market opens, and intra-day alerts when appropriate, please become a Member and Sign up for Alerts & Observations – includes access to Members Area, Explanatory Notes (pdf) for all of the concepts discussed, and Notes on Day Trading (pdf)

Disclaimer: This is the diary of a personal trading system, its methodology and the signals that it is producing. You are welcome to follow along but please understand that the information presented here is for educational purposes only. No recommendations are being made to buy, or sell stocks, options or futures contracts. Please consult your own financial advisor before making any investment decisions.


Zamora

Market gaps lower and consolidates above 4400 making morning and afternoon highs at 4416 and 4414 before declining into the close.

Buy Signal continues.

Chart of S&P 500 for 05 August 2021

To receive detailed daily analysis, guidance and the updated daily Buy / Sell trigger levels being generated by the Trading the Line system before the market opens, and intra-day alerts when appropriate, please become a Member and Sign up for Alerts & Observations – includes access to Members Area, Explanatory Notes (pdf) for all of the concepts discussed, and Notes on Day Trading (pdf)

Disclaimer: This is the diary of a personal trading system, its methodology and the signals that it is producing. You are welcome to follow along but please understand that the information presented here is for educational purposes only. No recommendations are being made to buy, or sell stocks, options or futures contracts. Please consult your own financial advisor before making any investment decisions.

Sistova

A look lower at 4375 is quickly reversed and met with strong buying triggering an S/T Buy Signal at 4406.

A new Buy Signal is active.

Chart of S&P 500 for 04 August 2021

To receive detailed daily analysis, guidance and the updated daily Buy / Sell trigger levels being generated by the Trading the Line system before the market opens, and intra-day alerts when appropriate, please become a Member and Sign up for Alerts & Observations – includes access to Members Area, Explanatory Notes (pdf) for all of the concepts discussed, and Notes on Day Trading (pdf)

Disclaimer: This is the diary of a personal trading system, its methodology and the signals that it is producing. You are welcome to follow along but please understand that the information presented here is for educational purposes only. No recommendations are being made to buy, or sell stocks, options or futures contracts. Please consult your own financial advisor before making any investment decisions.


Rumble

For each a road
For everyman a religion
Face everybody and rule
For everything and rumble
Forget everything and remember
For everything a reason

Ian Brown, F.E.A.R, 2001

Market gaps higher, takes a look at 4422 and declines with profit-taking and a decline into the close triggering a Cover Signal at 4389.

Chart of S&P500 for 03 August 2021

To receive detailed daily analysis, guidance and the updated daily Buy / Sell trigger levels being generated by the Trading the Line system before the market opens, and intra-day alerts when appropriate, please become a Member and Sign up for Alerts & Observations – includes access to Members Area, Explanatory Notes (pdf) for all of the concepts discussed, and Notes on Day Trading (pdf)

Disclaimer: This is the diary of a personal trading system, its methodology and the signals that it is producing. You are welcome to follow along but please understand that the information presented here is for educational purposes only. No recommendations are being made to buy, or sell stocks, options or futures contracts. Please consult your own financial advisor before making any investment decisions.

Negrita

A gap down but holding above the important 4390 level.

Buy Signal continues.

Chart of S&P500 for 02 August 2021

To receive detailed daily analysis, guidance and the updated daily Buy / Sell trigger levels being generated by the Trading the Line system before the market opens, and intra-day alerts when appropriate, please become a Member and Sign up for Alerts & Observations – includes access to Members Area, Explanatory Notes (pdf) for all of the concepts discussed, and Notes on Day Trading (pdf)

Disclaimer: This is the diary of a personal trading system, its methodology and the signals that it is producing. You are welcome to follow along but please understand that the information presented here is for educational purposes only. No recommendations are being made to buy, or sell stocks, options or futures contracts. Please consult your own financial advisor before making any investment decisions.


Sennen

Morning strength and a new all time high, fading a little in the afternoon.

Buy Signal continues.

Chart of S&P 500 for 30 July 2021

To receive detailed daily analysis, guidance and the updated daily Buy / Sell trigger levels being generated by the Trading the Line system before the market opens, and intra-day alerts when appropriate, please become a Member and Sign up for Alerts & Observations – includes access to Members Area, Explanatory Notes (pdf) for all of the concepts discussed, and Notes on Day Trading (pdf)

Disclaimer: This is the diary of a personal trading system, its methodology and the signals that it is producing. You are welcome to follow along but please understand that the information presented here is for educational purposes only. No recommendations are being made to buy, or sell stocks, options or futures contracts. Please consult your own financial advisor before making any investment decisions.