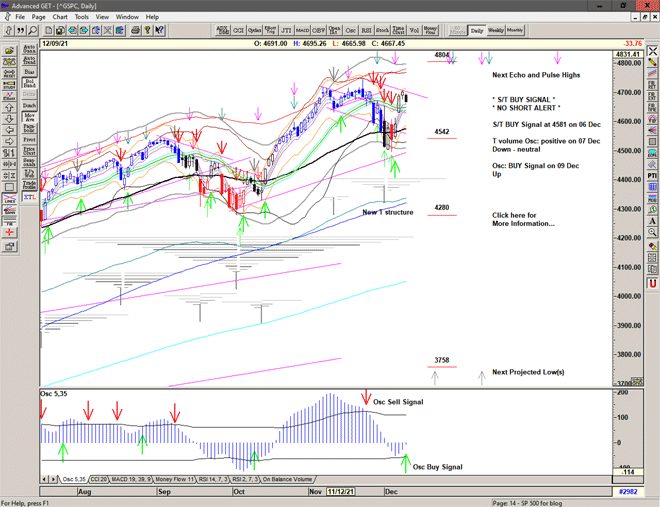
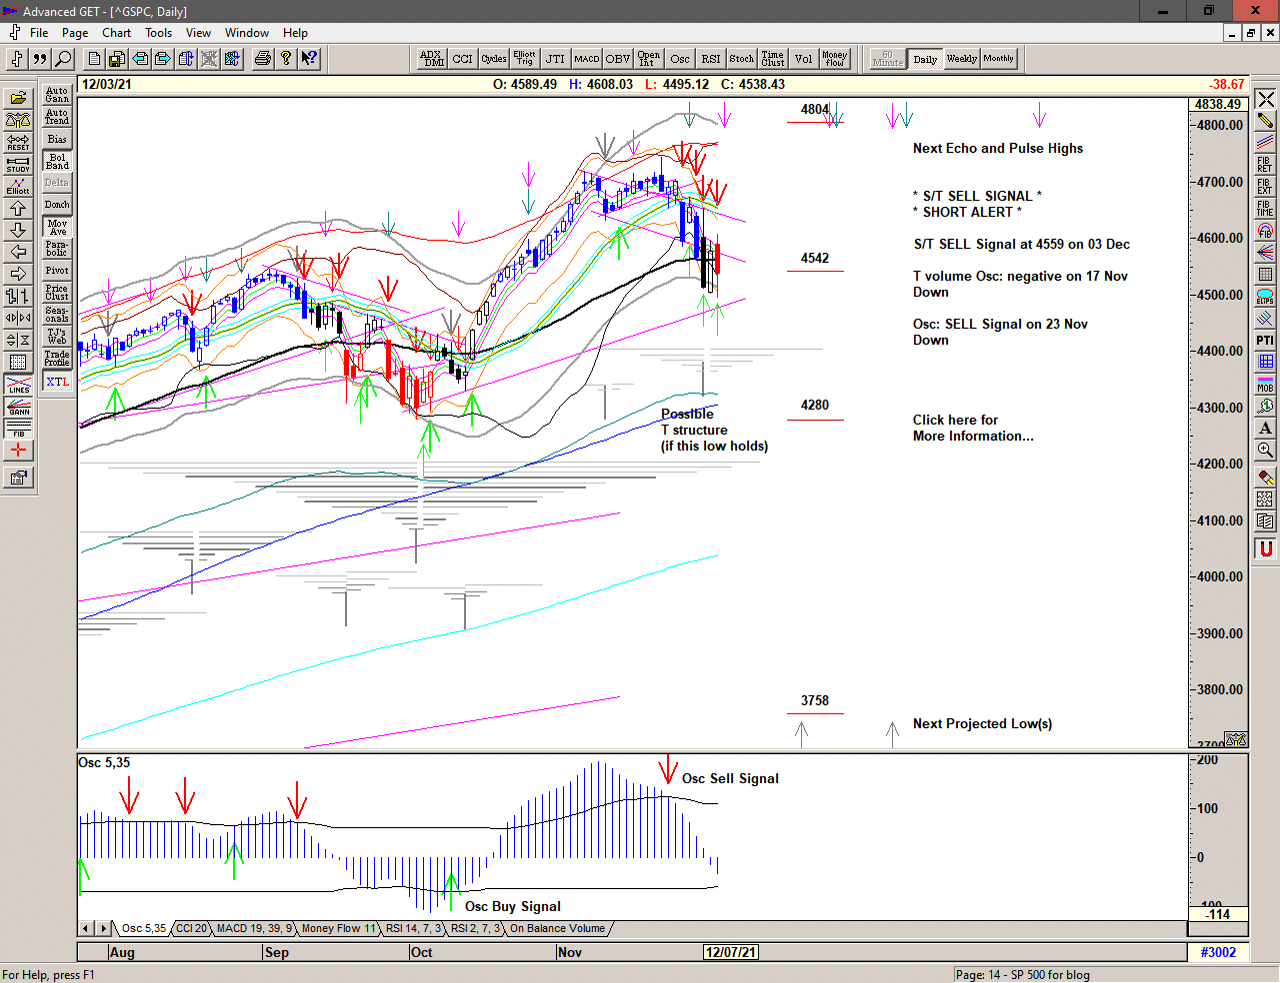
S/T SELL Signal at 4559

A gap up into a Buy Signal at 4597 and a very brief look above 4600 is quickly sold into with a rapid drop into a Sell Signal at 4559.

A last hour recovery to 4540 suggesting a successful re-test of the 01 December low.

Sell Signal active below 4558 * but suggesting to take profits on short positions or hedge against further recovery.

Very challenging market conditions.

Neon

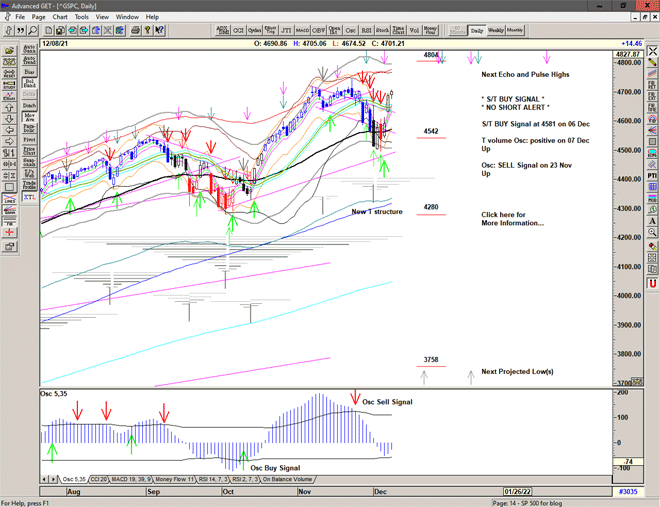
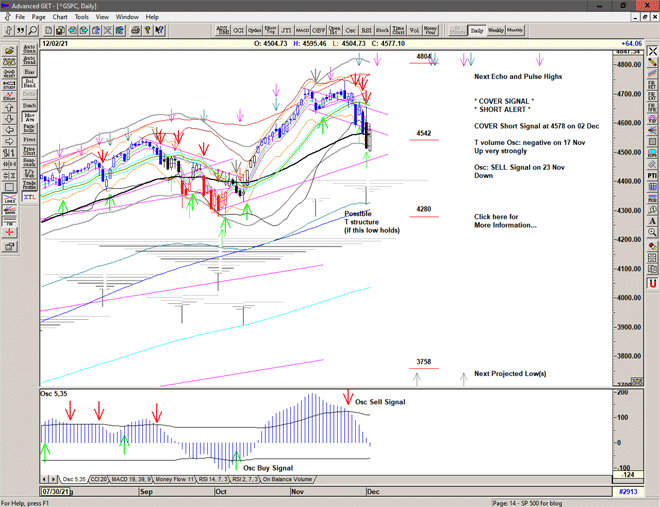
Strong buying from the open in an extremely choppy and volatile session reaching up to the area of the previous low before dropping back a bit into the close. A Cover Short Signal at 4578 and the possibility that a major low is in place, but not out of the woods yet.

Volatility continues to be extremely high and conditions are high risk.

Chart of S&P 500 for 03 December 2021

To receive detailed daily analysis, guidance and the updated daily Buy / Sell trigger levels being generated by the Trading the Line system before the market opens, and intra-day alerts when appropriate, please become a Member and Sign up for Alerts & Observations – includes access to Members Area, Explanatory Notes (pdf) for all of the concepts discussed, and Notes on Day Trading (pdf)

Disclaimer: This is the diary of a personal trading system, its methodology and the signals that it is producing. You are welcome to follow along but please understand that the information presented here is for educational purposes only. No recommendations are being made to buy, or sell stocks, options or futures contracts. Please consult your own financial advisor before making any investment decisions.


Cover Signal at 4578

Some very strong buying and a very volatile and choppy session. A push up through the Cover Short Signal line at 4578 and chopping about above 4578 and with a look at 4595 before dropping sharply into the close.

A strong recovery but closing at the Sell Signal line – either Hedge or Cover – I shall consider it to be a Cover Signal.

Very challenging market conditions.

Monroe

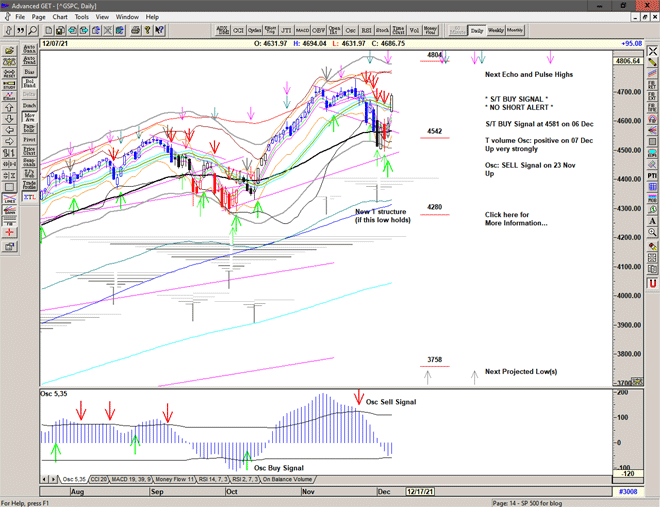
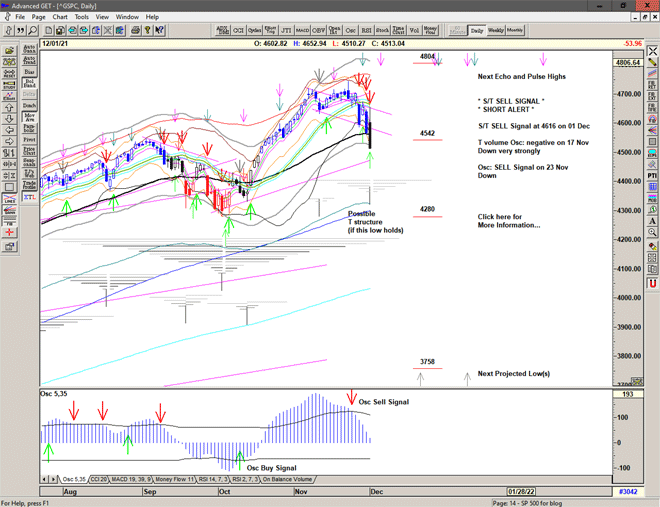
A strong overnight recovery and a push up into 4652 triggering a Cover Short Signal at 4616 and a Buy Signal at 4639 fades and collapses with heavy panic driven selling into the close triggering a new Sell Signal at 4616.

Sell Signal active.

Chart of S&P500 for 02 December 2021

To receive detailed daily analysis, guidance and the updated daily Buy / Sell trigger levels being generated by the Trading the Line system before the market opens, and intra-day alerts when appropriate, please become a Member and Sign up for Alerts & Observations – includes access to Members Area, Explanatory Notes (pdf) for all of the concepts discussed, and Notes on Day Trading (pdf)

Disclaimer: This is the diary of a personal trading system, its methodology and the signals that it is producing. You are welcome to follow along but please understand that the information presented here is for educational purposes only. No recommendations are being made to buy, or sell stocks, options or futures contracts. Please consult your own financial advisor before making any investment decisions.

S/T Sell Signal at 4616

A strong overnight move up and further strength from the open triggering a Cover Short Signal at 4616 and an S/T Buy Signal at 4639 and seeing 4652 before fading, making a second attempt to 4642 and then selling strongly.

A renewed S/T Sell Signal at 4616 and a rapid but choppy decline into 4576, an attempt to recover to 4600 but then selling with urgency into the close.

Sell Signal active

Castritian

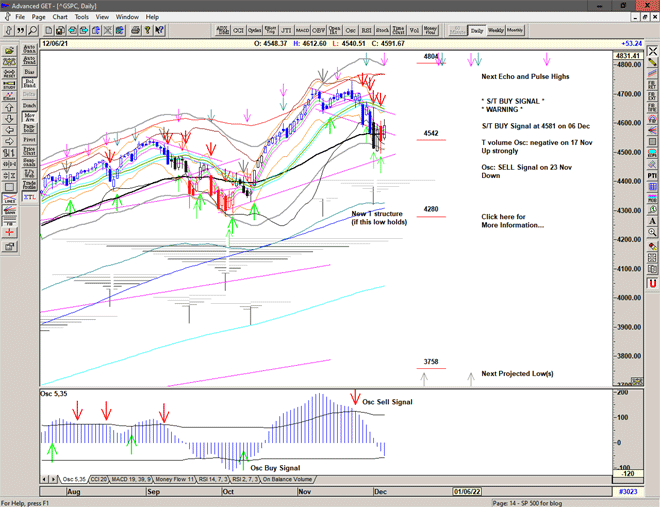
Market gaps lower into the Sell Signal line, attempts a recovery into 4646 and then collapses.

A Sell Signal at 4632 and a volatile panic driven session.

Sell Signal active.

Chart of S&P 500 for 01 December 2021

To receive detailed daily analysis, guidance and the updated daily Buy / Sell trigger levels being generated by the Trading the Line system before the market opens, and intra-day alerts when appropriate, please become a Member and Sign up for Alerts & Observations – includes access to Members Area, Explanatory Notes (pdf) for all of the concepts discussed, and Notes on Day Trading (pdf)

Disclaimer: This is the diary of a personal trading system, its methodology and the signals that it is producing. You are welcome to follow along but please understand that the information presented here is for educational purposes only. No recommendations are being made to buy, or sell stocks, options or futures contracts. Please consult your own financial advisor before making any investment decisions.

Saltire

A gap up into a volatile morning session and a strong push higher, triggering a Cover Short Signal at 4649 and making a high at 4672, just triggering an S/T Buy Signal before dropping back.

Market attempting to stabilize, but not quite a Buy Signal.

Chart of S&P 500 for 30 November 2021

To receive detailed daily analysis, guidance and the updated daily Buy / Sell trigger levels being generated by the Trading the Line system before the market opens, and intra-day alerts when appropriate, please become a Member and Sign up for Alerts & Observations – includes access to Members Area, Explanatory Notes (pdf) for all of the concepts discussed, and Notes on Day Trading (pdf)

Disclaimer: This is the diary of a personal trading system, its methodology and the signals that it is producing. You are welcome to follow along but please understand that the information presented here is for educational purposes only. No recommendations are being made to buy, or sell stocks, options or futures contracts. Please consult your own financial advisor before making any investment decisions.


Market closing at 4655

A gap up into 4650 and a very choppy decline into 4626 before strong buying and a rapid move higher to touch the Buy Signal line at 4672. No follow through and chopping sideways before dropping back into the close.

A Cover Short Signal at 4649 and an unconfirmed Buy Signal at 4672 with no follow through.

Illuminata

An overnight collapse, opening well below the Cover Signal and Sell Signal lines.

Volatile and panicky news driven action exacerbated by low participation due to the holiday.

Sell Signal active.

Chart of S&P 500 for 29 November 2021

To receive detailed daily analysis, guidance and the updated daily Buy / Sell trigger levels being generated by the Trading the Line system before the market opens, and intra-day alerts when appropriate, please become a Member and Sign up for Alerts & Observations – includes access to Members Area, Explanatory Notes (pdf) for all of the concepts discussed, and Notes on Day Trading (pdf)

Disclaimer: This is the diary of a personal trading system, its methodology and the signals that it is producing. You are welcome to follow along but please understand that the information presented here is for educational purposes only. No recommendations are being made to buy, or sell stocks, options or futures contracts. Please consult your own financial advisor before making any investment decisions.