Back On

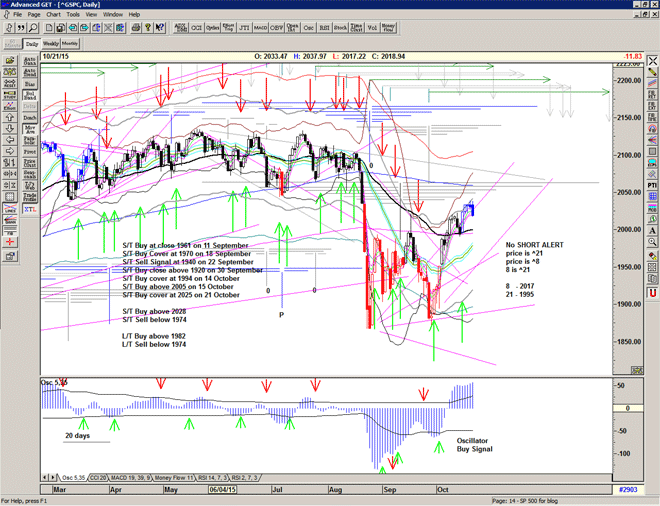
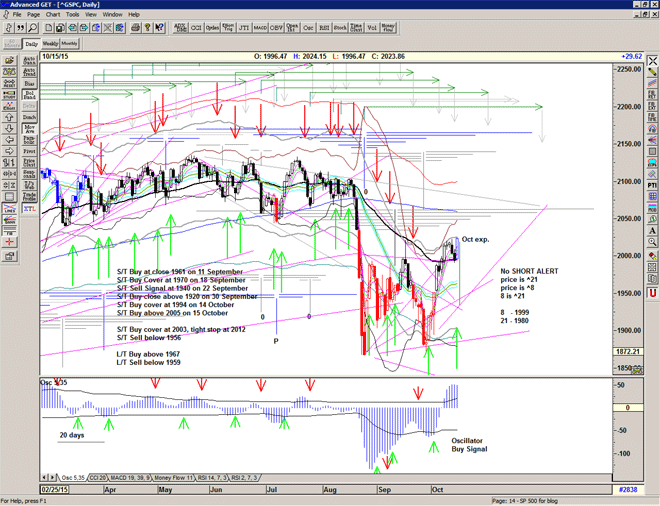
Contination Buy Signal at 2005, and a nice 'bounce' upwards off the 55 ema suggesting that previous anaysis is correct – an upward grind onwards towards the 200 ma.

Potential change of trend indicated by Blue bar (XTL).

Chart of S&P500 for 16 October 2015

Cover at 1994

A good attempt at recovery from the drop below 2000 but the afternoon failure confirms the cover at 1994.

It looks like the 2 T structures are now combined making a split centred structure, as to be expected with 2 lows.
I still expect a choppy grind upwards into Thanksgiving, followed by a Santa claus rally into new year.

Chart of S&P500 for 15 October 2015