Cyriac

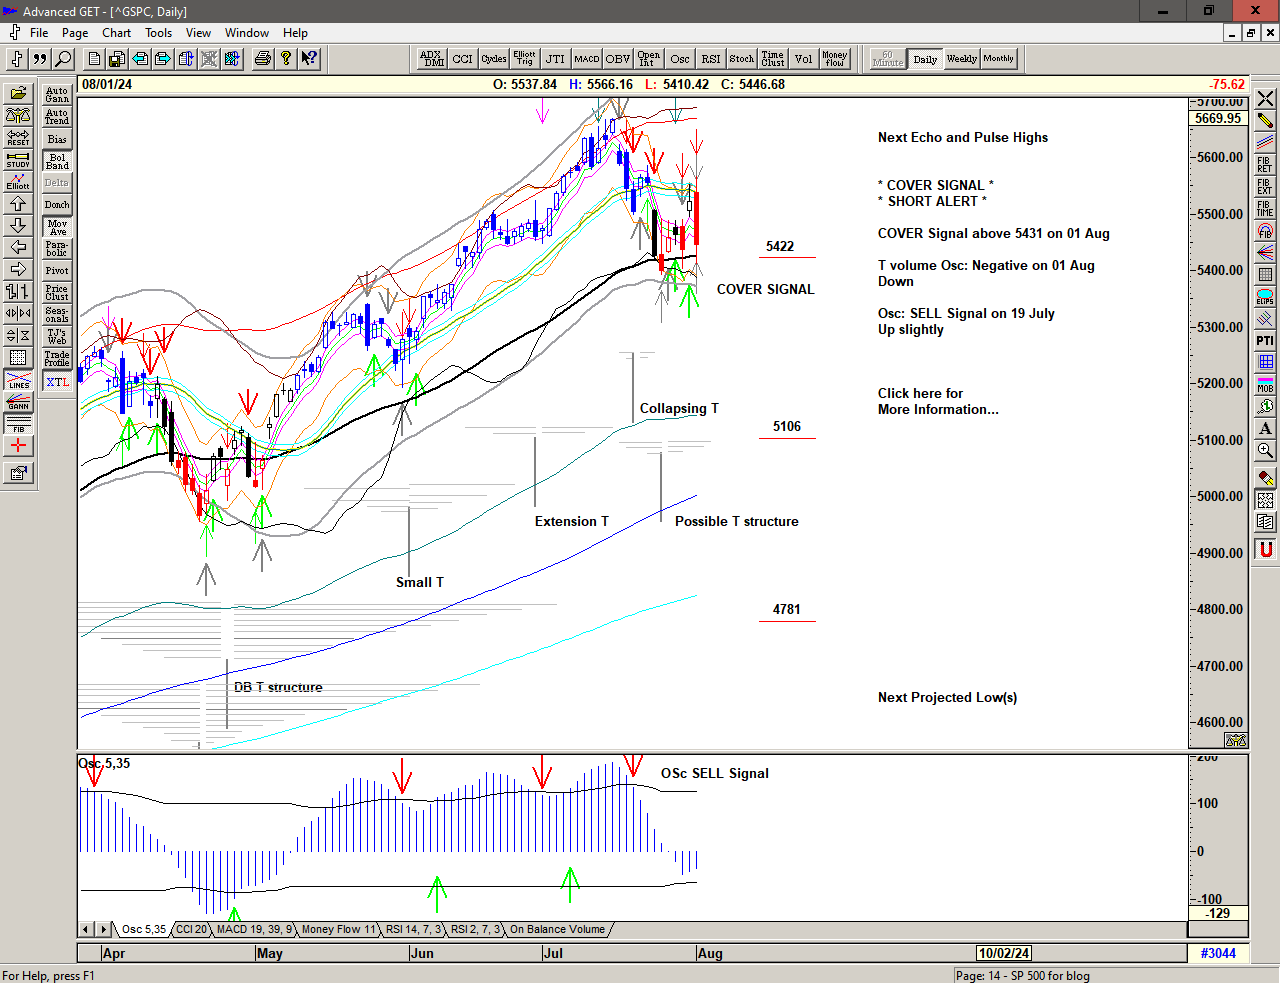
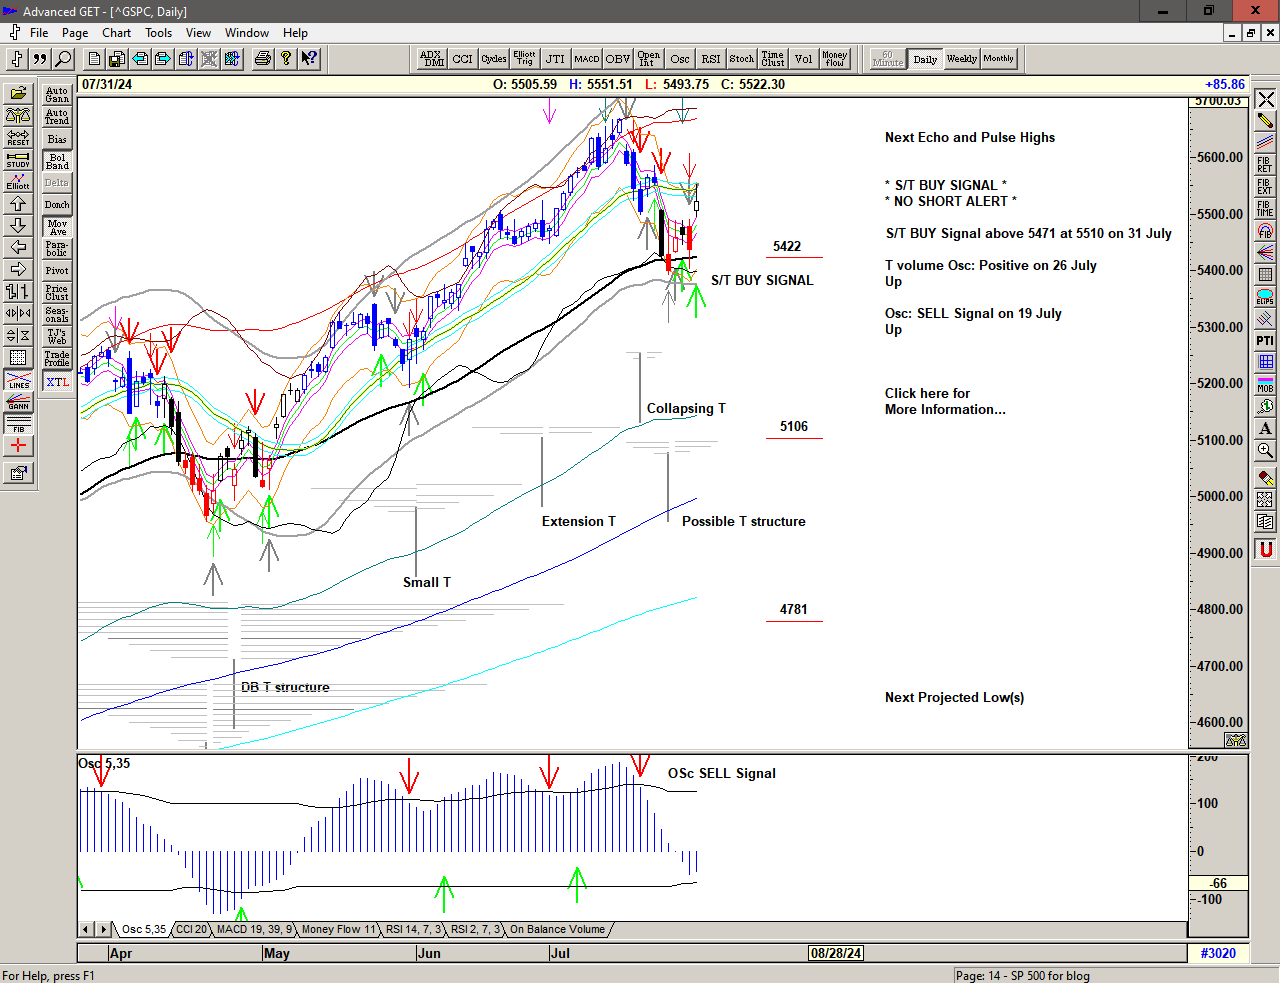
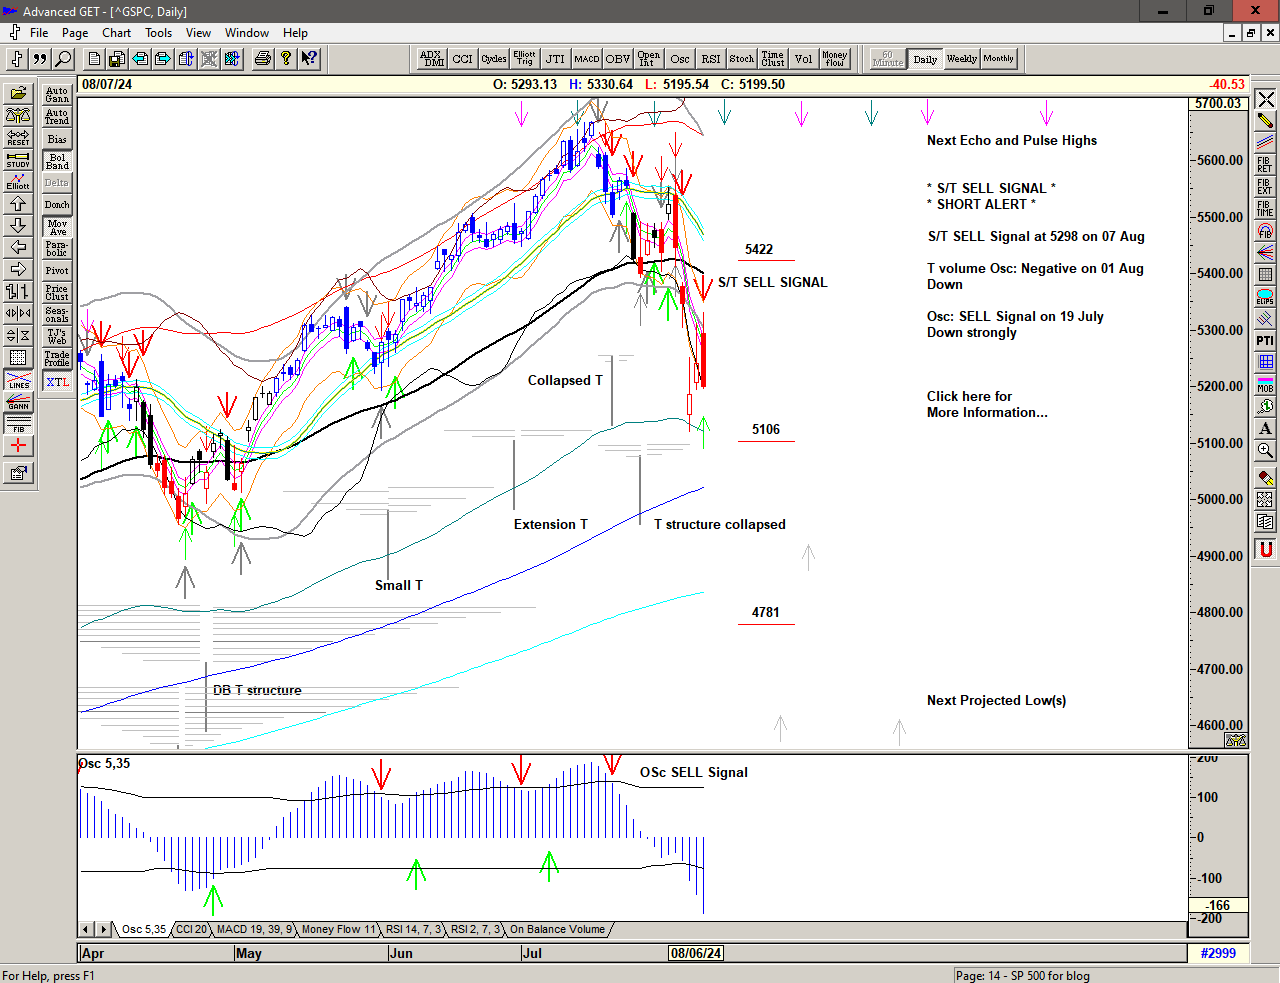
A gap higher into 5300 triggers a Cover Signal above 5298 and then an S/T Buy Signal at 5324 before dropping back, cancelling the Buy Signal below 5298 and re-activating the S/T Sell Signal at 5298.

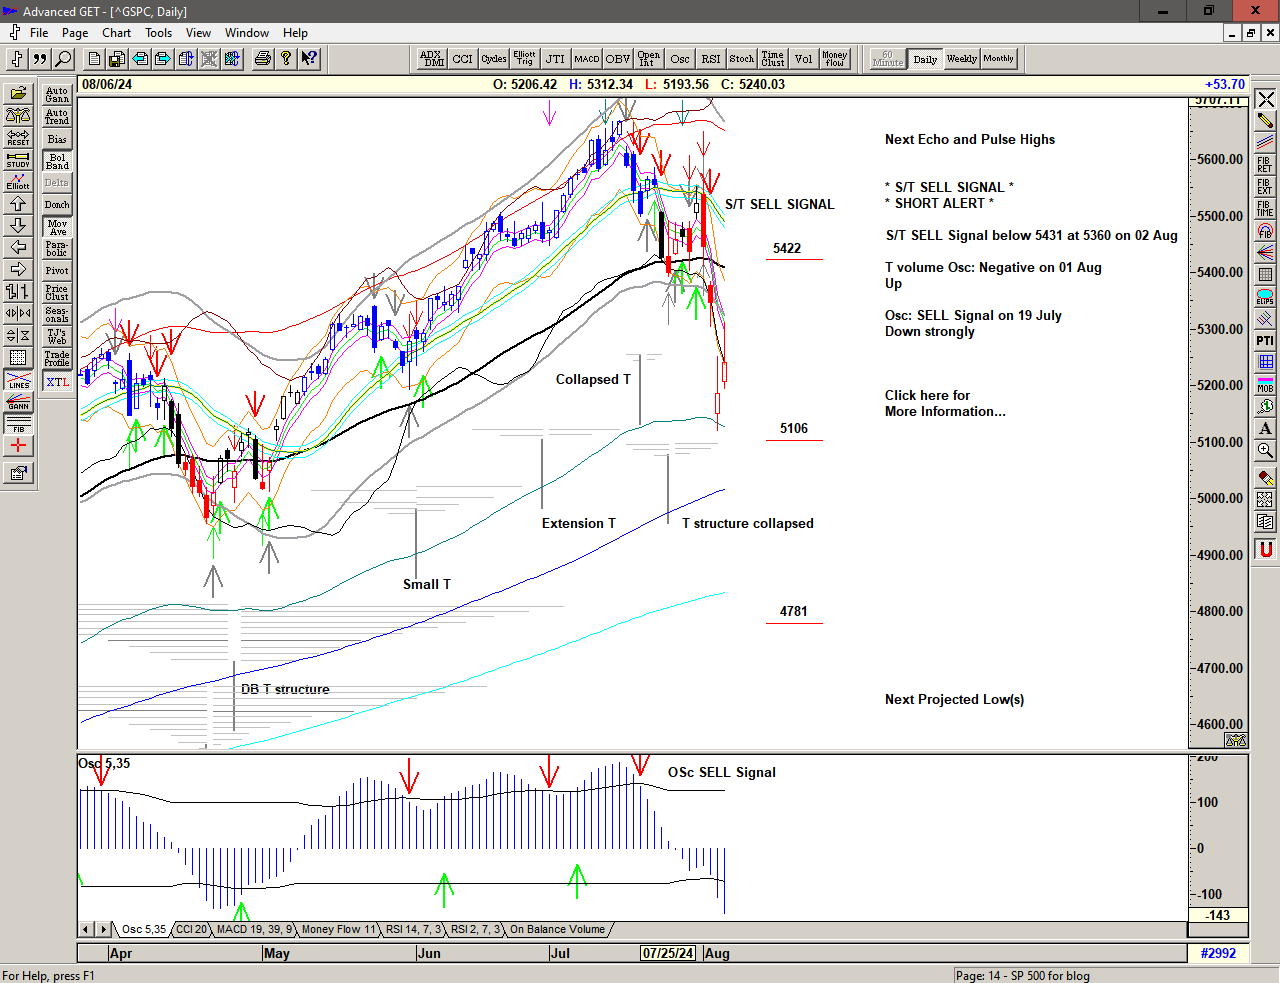
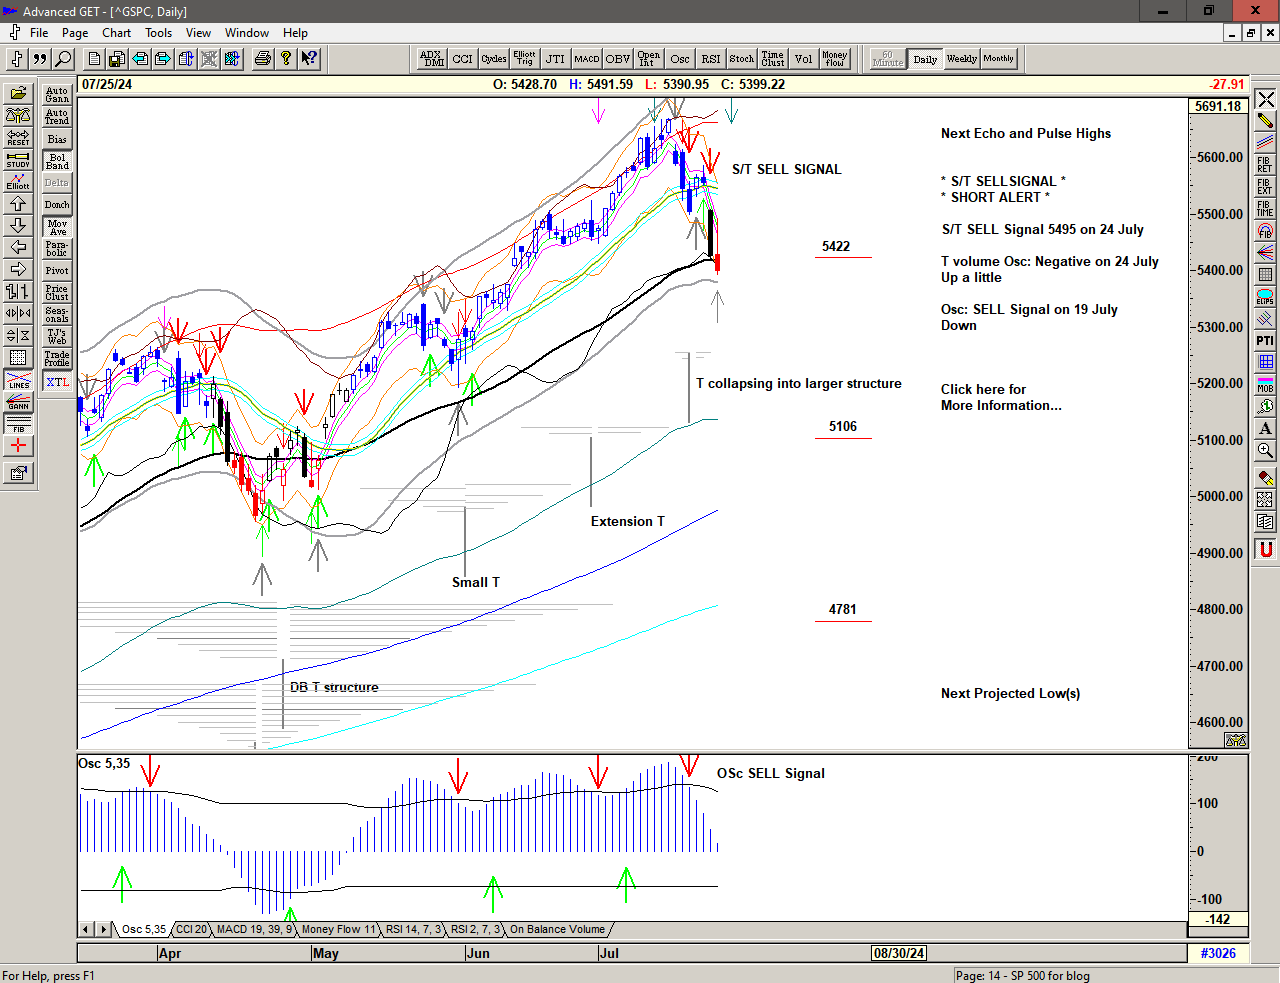
S/T SELL Signal at 5298.

Chart of S&P 500 for 08 August 2024

Sign up here for daily analysis with the updated Buy / Sell trigger levels being generated by the Trading the Line S/T System before the market opens. Trading the Line Membership – includes Explanatory Notes (pdf), and Notes on Day Trading (pdf).

Disclaimer: This is the diary of a personal trading system, its methodology and the signals that it is producing. You are welcome to follow along but please understand that the information presented here is for educational purposes only. No recommendations are being made to buy, or sell stocks, options or futures contracts. Please consult your own financial advisor before making any investment decisions


Domitius

A huge push higher closes the gap below 5300 before dropping back.

SELL Signal continues.

Chart of S&P 500 for 07 August 2024

Sign up here for daily analysis with the updated Buy / Sell trigger levels being generated by the Trading the Line S/T System before the market opens. Trading the Line Membership – includes Explanatory Notes (pdf), and Notes on Day Trading (pdf).

Disclaimer: This is the diary of a personal trading system, its methodology and the signals that it is producing. You are welcome to follow along but please understand that the information presented here is for educational purposes only. No recommendations are being made to buy, or sell stocks, options or futures contracts. Please consult your own financial advisor before making any investment decisions


Transfiguration

A huge drop is met with short-covering and opportunistic buying from below 5150 into 5250 before dropping back.

SELL Signal continues.

Chart of S&P 500 for 06 August 2024

Sign up here for daily analysis with the updated Buy / Sell trigger levels being generated by the Trading the Line S/T System before the market opens. Trading the Line Membership – includes Explanatory Notes (pdf), and Notes on Day Trading (pdf).

Disclaimer: This is the diary of a personal trading system, its methodology and the signals that it is producing. You are welcome to follow along but please understand that the information presented here is for educational purposes only. No recommendations are being made to buy, or sell stocks, options or futures contracts. Please consult your own financial advisor before making any investment decisions


Mayflower

A huge gap lower and well below the Sell Signal line (5427) triggering a very high risk Sell Signal continuing lower with heavy selling until finding buying interest at 5300.

S/T SELL Signal below 5427 at 5360.

Chart of S&P 500 for 05 August 2024

Sign up here for daily analysis with the updated Buy / Sell trigger levels being generated by the Trading the Line S/T System before the market opens. Trading the Line Membership – includes Explanatory Notes (pdf), and Notes on Day Trading (pdf).

Disclaimer: This is the diary of a personal trading system, its methodology and the signals that it is producing. You are welcome to follow along but please understand that the information presented here is for educational purposes only. No recommendations are being made to buy, or sell stocks, options or futures contracts. Please consult your own financial advisor before making any investment decisions


La Negrita

A push up into 5566 is met with strong selling dropping rapidly below 5510 and continuing lower triggering a Cover Signal below 5465 and an S/T Sell Signal below 5431 before bouncing at 5410 and recovering into the close, cancelling the Sell Signal above 5431.

COVER Signal above 5431.

Chart of S&P 500 for 02 August 2024

Sign up here for daily analysis with the updated Buy / Sell trigger levels being generated by the Trading the Line S/T System before the market opens. Trading the Line Membership – includes Explanatory Notes (pdf), and Notes on Day Trading (pdf).

Disclaimer: This is the diary of a personal trading system, its methodology and the signals that it is producing. You are welcome to follow along but please understand that the information presented here is for educational purposes only. No recommendations are being made to buy, or sell stocks, options or futures contracts. Please consult your own financial advisor before making any investment decisions


Lunasa

A huge gap higher – well above the S/T Buy Signal line at 5471 – and continuing up into the Mid Channel and top of the 24 July gap at 5550 before taking profit and dropping back a little.

A high risk S/T Buy Signal above 5471 at 5510.

Chart of S&P 500 for 01 August 2024

Sign up here for daily analysis with the updated Buy / Sell trigger levels being generated by the Trading the Line S/T System before the market opens. Trading the Line Membership – includes Explanatory Notes (pdf), and Notes on Day Trading (pdf).

Disclaimer: This is the diary of a personal trading system, its methodology and the signals that it is producing. You are welcome to follow along but please understand that the information presented here is for educational purposes only. No recommendations are being made to buy, or sell stocks, options or futures contracts. Please consult your own financial advisor before making any investment decisions


Cravant

Another look up at 5489 is met with strong selling, triggering a COVER Signal at 5454 and an S/T SELL Signal at 5432 continuing lower until bouncing at 5401 and cancelling the Sell Signal above 5432 (at least for now).

COVER Signal at 5432

Chart of S&P 500 for 31 July 2024

Sign up here for daily analysis with the updated Buy / Sell trigger levels being generated by the Trading the Line S/T System before the market opens. Trading the Line Membership – includes Explanatory Notes (pdf), and Notes on Day Trading (pdf).

Disclaimer: This is the diary of a personal trading system, its methodology and the signals that it is producing. You are welcome to follow along but please understand that the information presented here is for educational purposes only. No recommendations are being made to buy, or sell stocks, options or futures contracts. Please consult your own financial advisor before making any investment decisions


Vanuatu

Early strength triggers an S/T Buy Signal at 5484, dropping back below the Cover Signal line at 5457 before a second attempt re-activates the Buy Signal above 5484 in uncertain and volatile action.

S/T BUY Signal at 5484.

Chart of S&P 500 for 30 July 2024

Sign up here for daily analysis with the updated Buy / Sell trigger levels being generated by the Trading the Line S/T System before the market opens. Trading the Line Membership – includes Explanatory Notes (pdf), and Notes on Day Trading (pdf).

Disclaimer: This is the diary of a personal trading system, its methodology and the signals that it is producing. You are welcome to follow along but please understand that the information presented here is for educational purposes only. No recommendations are being made to buy, or sell stocks, options or futures contracts. Please consult your own financial advisor before making any investment decisions


Damascus

A gap up into a Cover Short Signal above 5441 and a push higher into 5488 before backing off.

COVER Signal at 5441

Chart of S&P 500 for 29 July 2024

Sign up here for daily analysis with the updated Buy / Sell trigger levels being generated by the Trading the Line S/T System before the market opens. Trading the Line Membership – includes Explanatory Notes (pdf), and Notes on Day Trading (pdf).

Disclaimer: This is the diary of a personal trading system, its methodology and the signals that it is producing. You are welcome to follow along but please understand that the information presented here is for educational purposes only. No recommendations are being made to buy, or sell stocks, options or futures contracts. Please consult your own financial advisor before making any investment decisions


Venera

A strong push higher in early action, briefly triggering a Cover Signal above 5480 but then dropping rapidly back to the low of the day into the close.

SELL Signal continues.

Chart of S&P 500 for 26 July 2024

Sign up here for daily analysis with the updated Buy / Sell trigger levels being generated by the Trading the Line S/T System before the market opens. Trading the Line Membership – includes Explanatory Notes (pdf), and Notes on Day Trading (pdf).

Disclaimer: This is the diary of a personal trading system, its methodology and the signals that it is producing. You are welcome to follow along but please understand that the information presented here is for educational purposes only. No recommendations are being made to buy, or sell stocks, options or futures contracts. Please consult your own financial advisor before making any investment decisions