After black friday

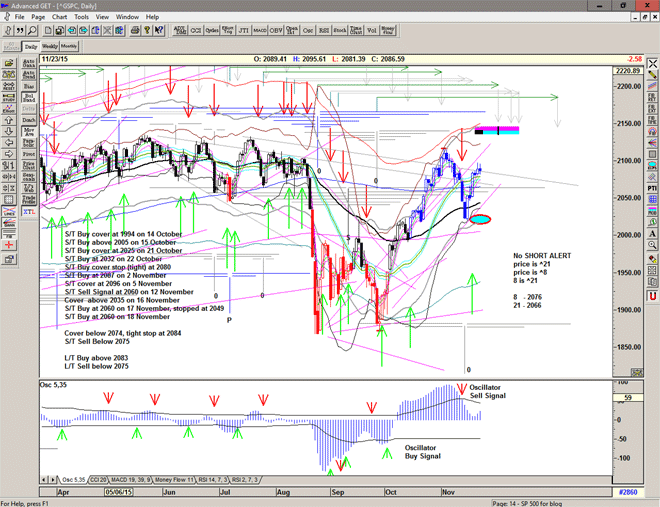
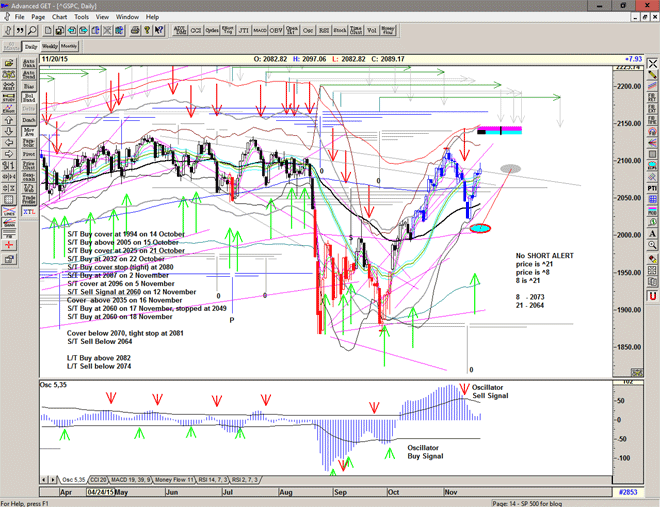
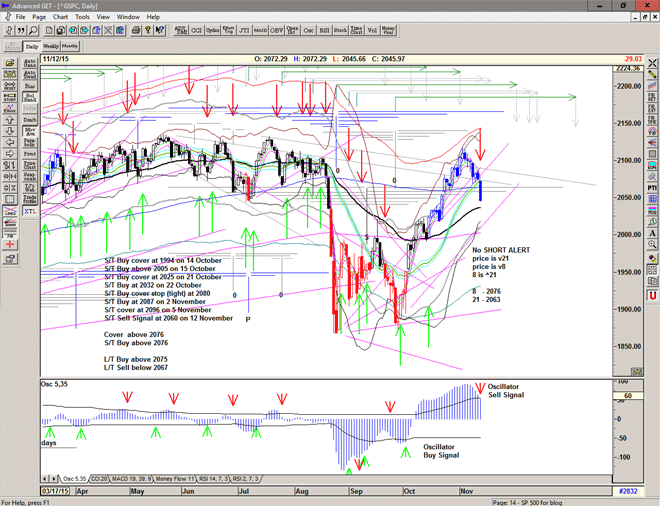
Close to the bottom bollinger band, and bottom of grey channel, but failed at the 55 ema.
If this is just a pullback we should find support in the next few days, watch the ellipse.

We mourn the Paris dead and are concerned about the future. Permanent war seems likely.

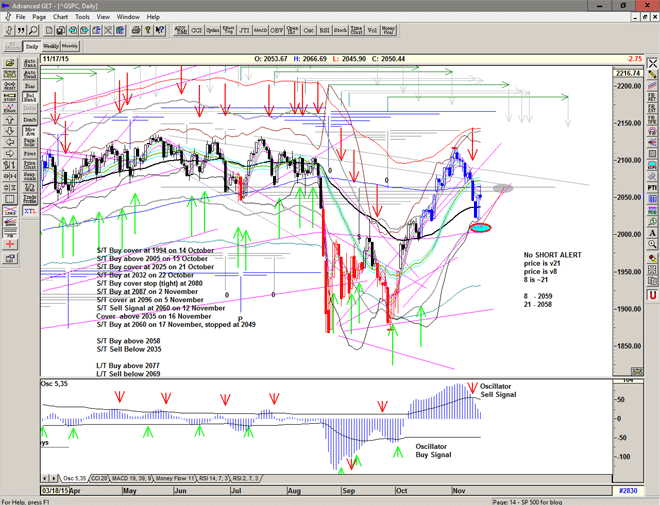
Chart of S&P500 for 16 November 2015


Wobble

Break below the zero line on the T volume oscillator confirms the weakness.
Found support on the rising Gann line from the previous low.
May need to stabilise before moving higher, maybe a re-test of the 55ema.

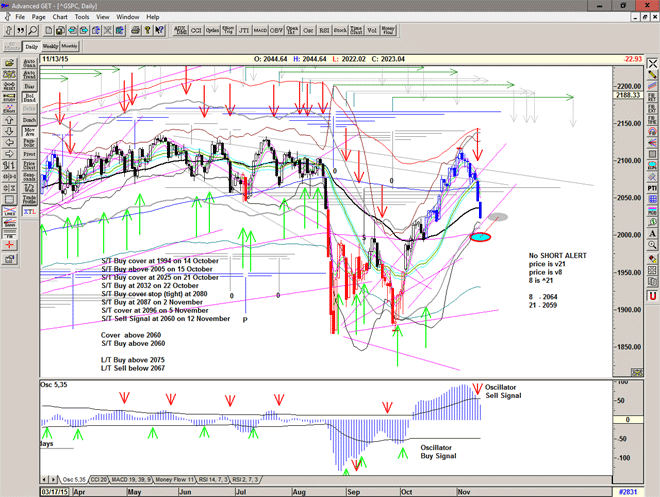
Chart of S&P500 for 10 November 2015

Crack-le

Market spent some under the cover level again, only to recover into the close.
T volume oscillator back at zero so a pullback here, perhaps 2060 – 2030, would make sense.
A positive monday might push for the all time high.
Back in the 'range'.

Chart of S&P500 for 7 November 2015