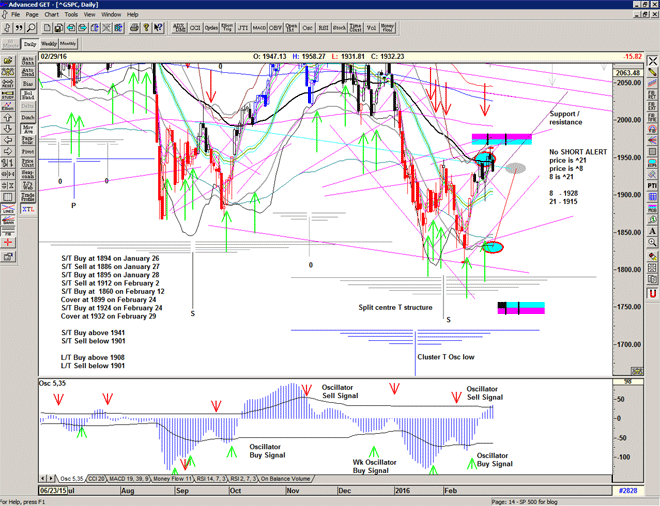
Peaking ?

A small reversal in line with time and price, and a touch of the top grey channel.

Maybe, just maybe, we initiate another pullback to the 1840s. Or we do pause and grind towards 2000.

Chart of S&P500 for 27 February 2016

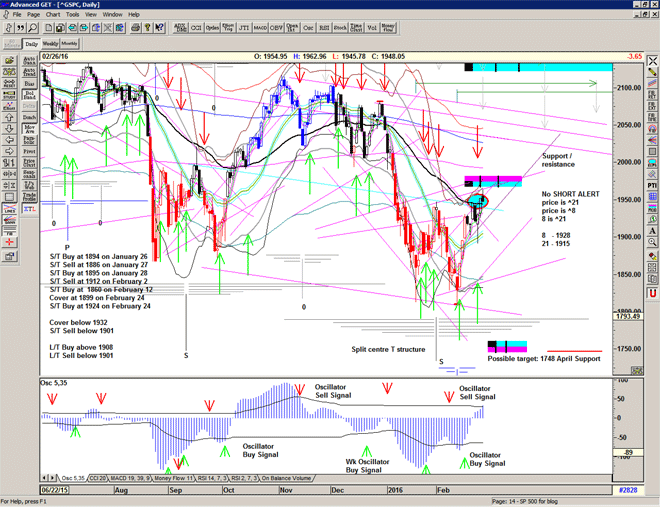
Target acheived ?

Price still very bullish, but looking like short term resistance about to be tackled at 1950.

The Mob, ellipse and 70 day pulse are all looking for a top in the next few days suggesting that 'if' this is just a bear market rally then this is where the turn will come.

Chart of S&P500 for 23 February 2016

February expiration

Expect usual shenanigans around option expiration. A pull back to 1900 or even a pop to 1950 make sense.

I'm expecting to see some major resistance around the 1940 area, if we get there. (pale blue descending diagonal).
If we can get through there then maybe we can rally up to 2000.

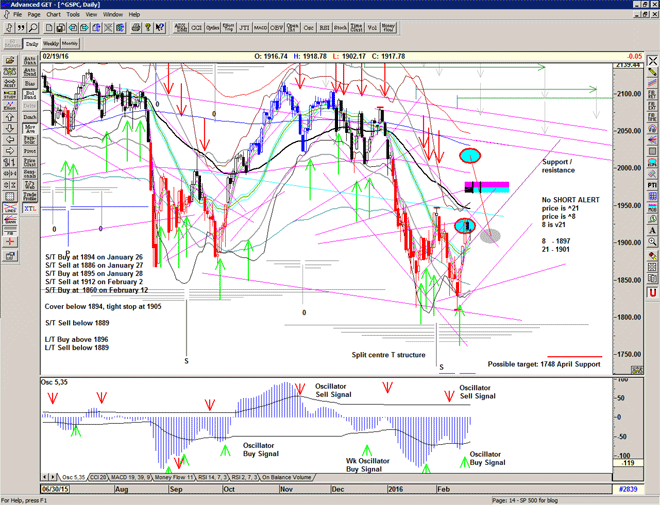
Chart of S&P500 for 19 February 2016

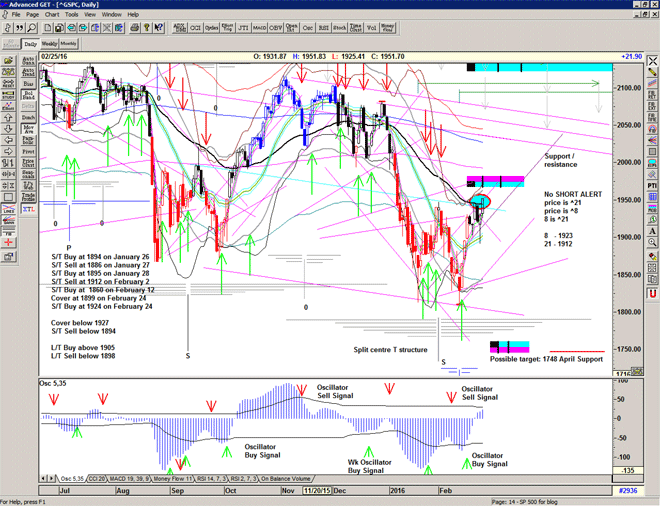
Are we there yet

Bounce target acheived yesterday, so we could certainly start to see some profit taking.
But secondary target now looking like 1925-1955.

Strength above the support/resistance line is suggestive of further strength. Watch to see if we crack here or next few days (as many seem to expect) or if we can stabilise above the mid channel and power higher.

OSC now on a Buy signal.

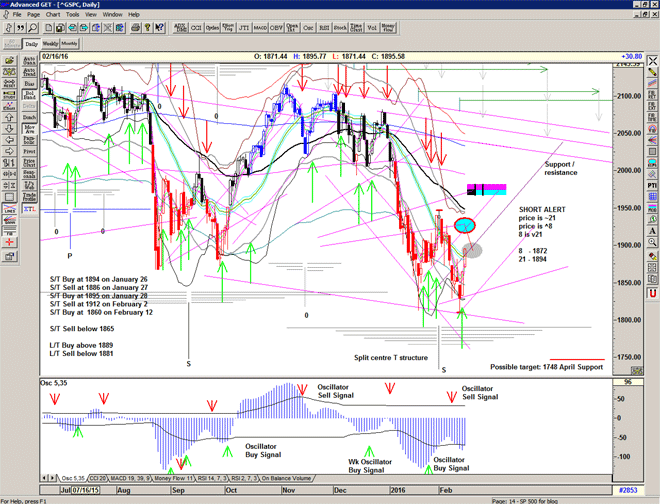
Chart of S&P500 for 18 February 2016

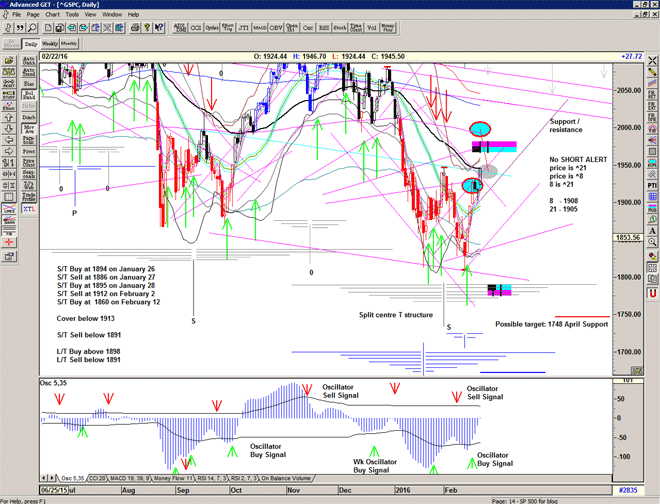
Bounce into expiration

Short term target for this bounce is between 1880 – 1920.
However we did close above the support/resistance line.
First arm of split T structure, and first T structure is Friday.

Do we get a drive upwards into expiration and then a reversal or a sell off?
Magnets at 1950, 1900, 1850, 1800

Chart of S&P500 for 17 February 2016