Hanging on

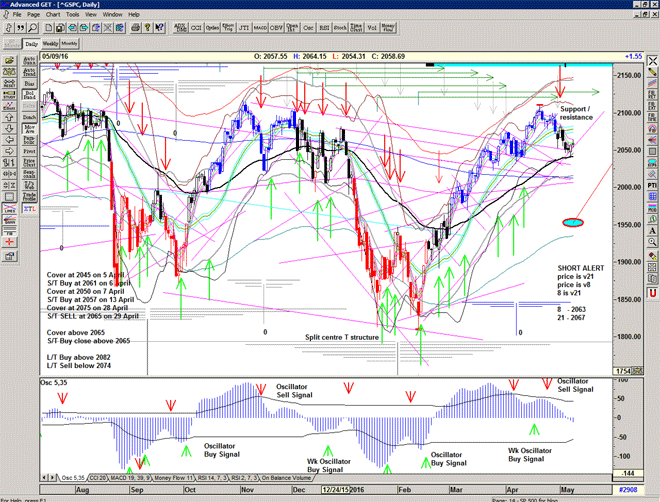
Still hanging onto the support line.

Looks tired but without a catalyst will continue choppy grind higher, especially with the central banks accommodating behaviour and too many bears.

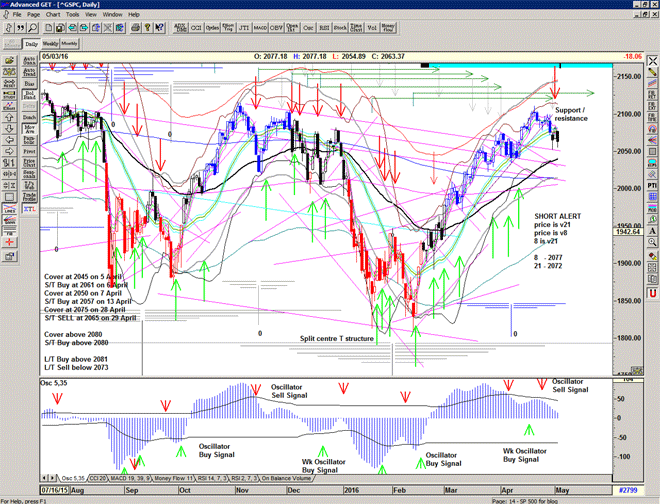
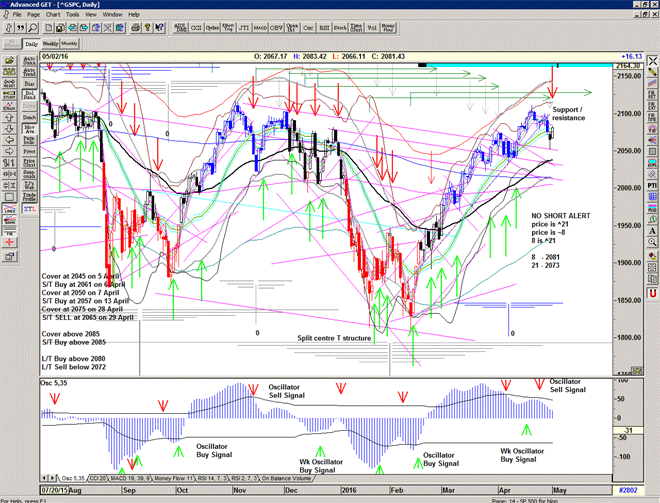
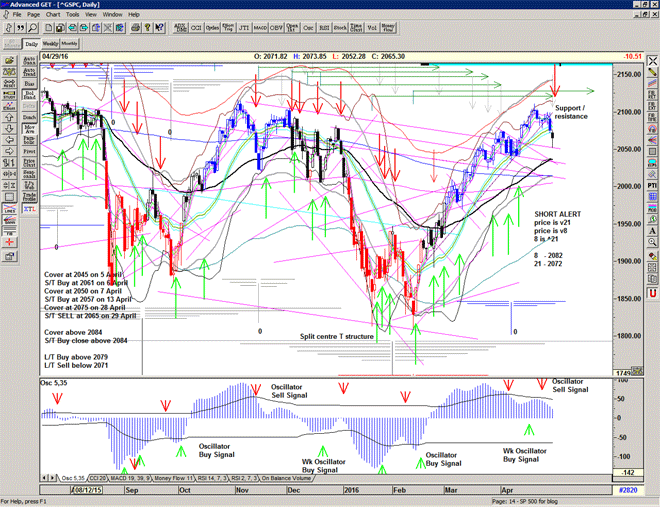
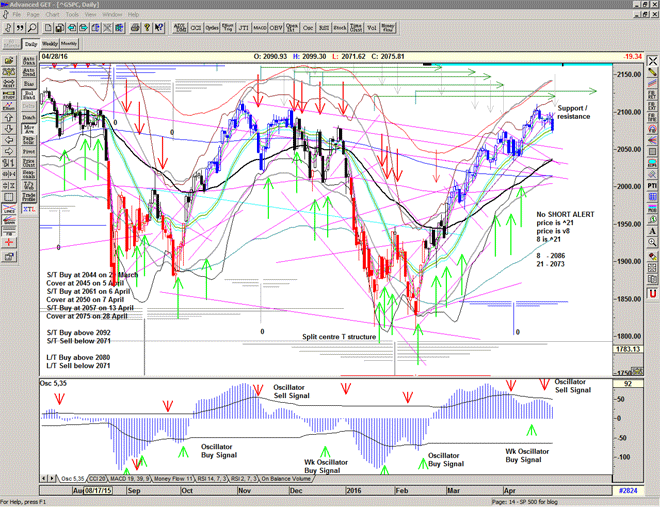
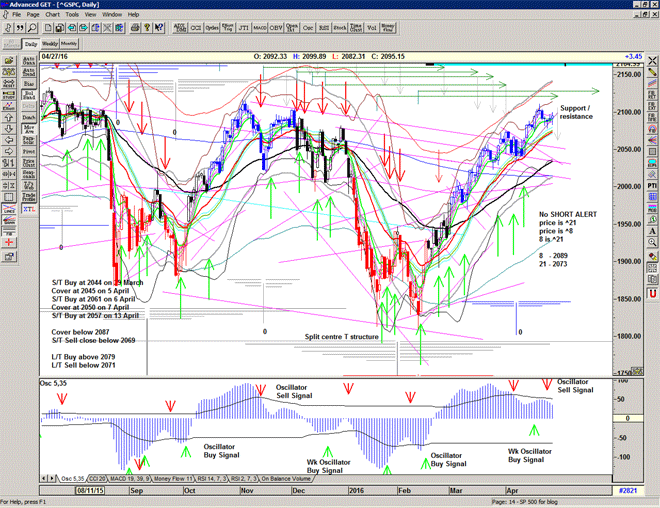
Chart of S&P500 for 28 April 2016

Critical juncture

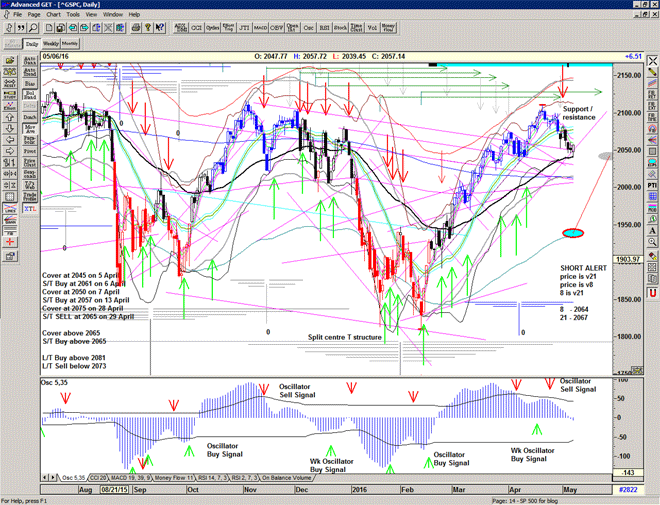
S&Ps at a critical juncture now and looking like it 'should' roll over now.
But I wonder if too many folks are thinking this and will spoil the party?

OSC looking weak again and T volume dropped below zero. Potential early warning sell signals.

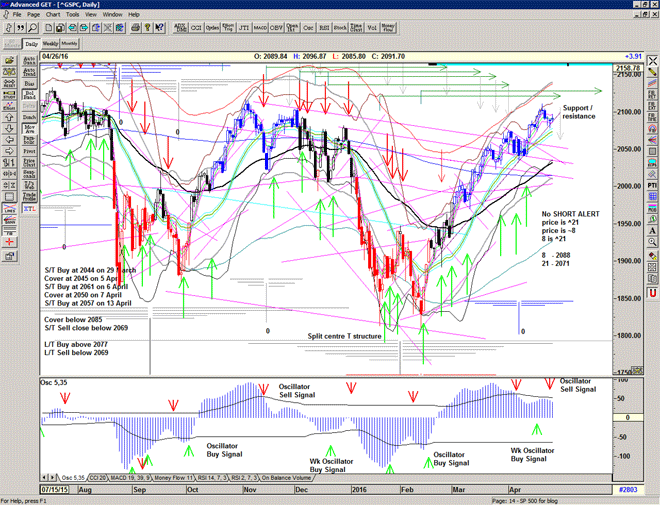
Chart of S&P500 for 26 April 2016

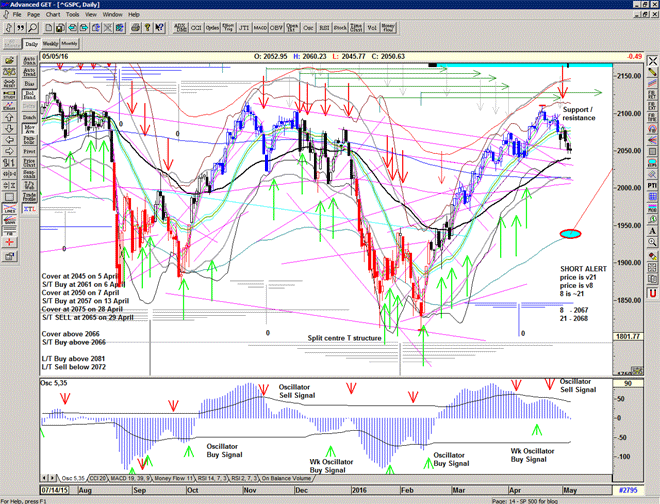
Running on vapors

It does seem that the market is running on vapors, and with the expiration of the major arm of the split centred T structure over the next few days, we may see the pullback that everyone seems to expect. OSC still hinting at lower prices too.

Chart of S&P500 for 25 April 2016


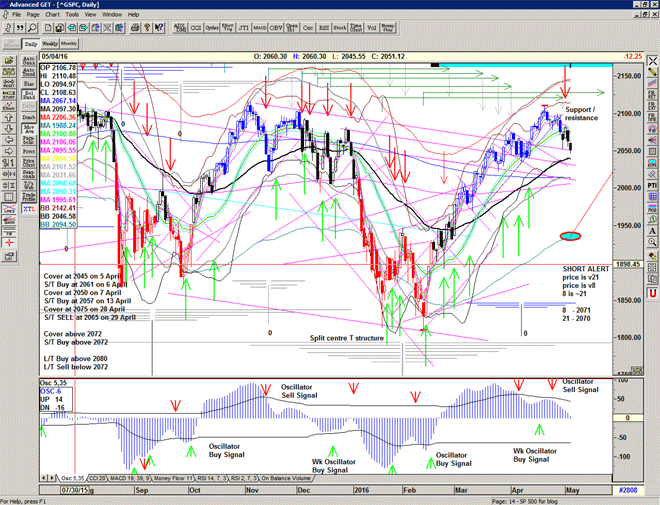
Choppy ahead

I suspect it will be  choppy ahead, as the low-high pulse corresponds to the mid January volatile drop into the low, and we should have a peak around the end of the month.
Hints at a sell in May, and buy it back for a summer rally.

Chart of S&P500 for 21 April 2016