Welcome to the Trading the Line Free Report.
Party girl's got her shiny dress on
Look at those party moves
She's lookin' for a good time
She loves to dance and she loves the action
Wherever the party goes
She's lookin' for a good time
You're never gonna see a tear in her eye
Never see her break a frown
She's lookin' for a good time
The way she dances makes my world stand still
And she's spinning in the sky
Every move is like a psychedelic pill
From a doctor I can't buy.
– Neil Young & Crazy Horse, Psychedelic Pill, 2012
–
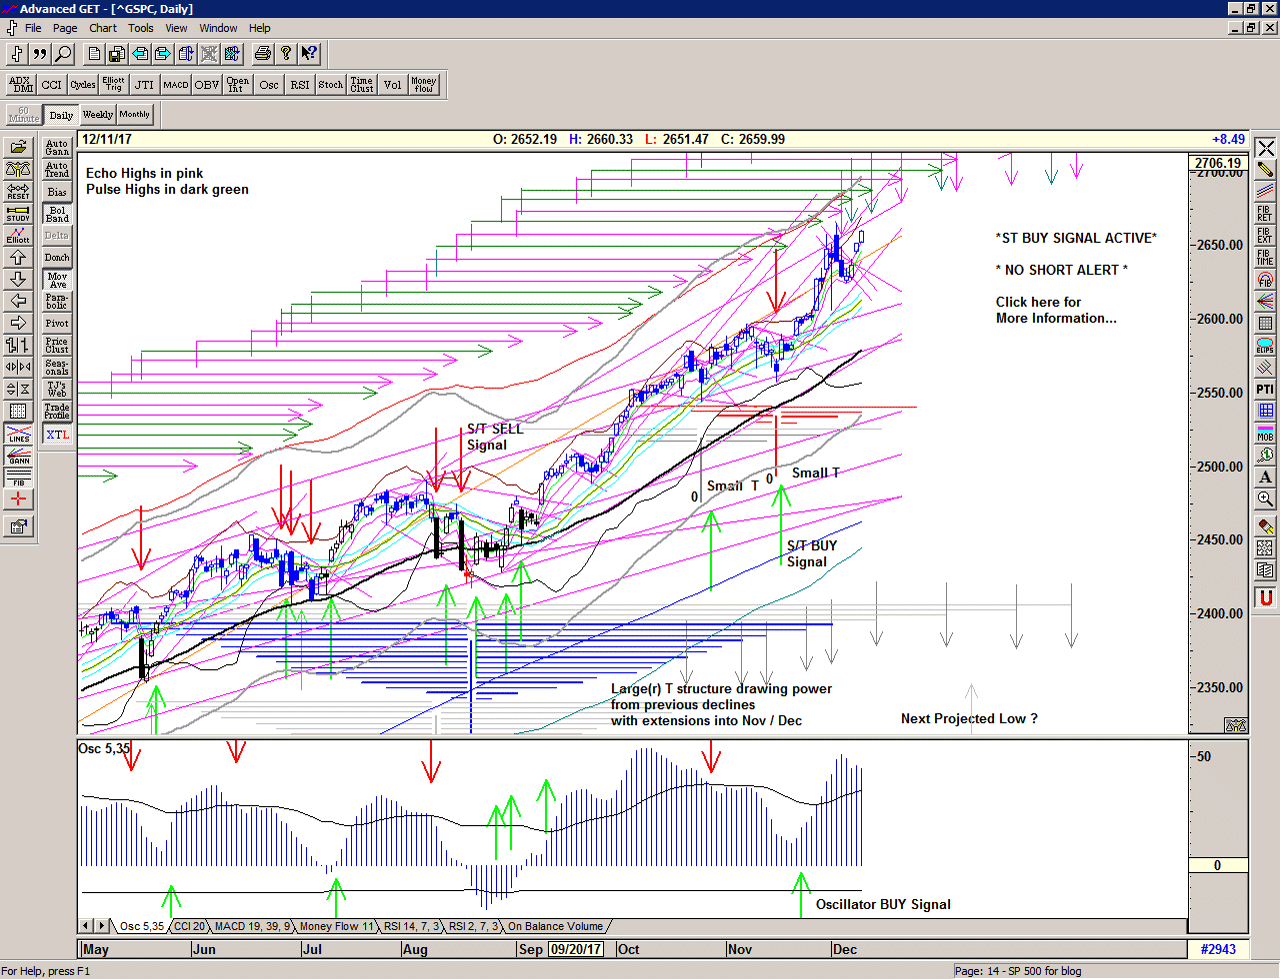
No looking back as the market grinds higher with another strong close at another new all time closing high. Strength in the T volume oscillator supports the continued advance.
Yesterday was in-line with a projection for a high from the red T structure, we have a pulse high scheduled for Wednesday and another peak projected by the large(r) blue T structure for Thursday.
Seasonal strength continues, and its difficult to see anything upsetting the strong upside momentum at least into the holiday period and the New Year. That of course maybe a pyschological target for many investors.
Keep one eye on the Osc oscillator which is gently declining, and allow the T volume oscillator to keep us informed of the under-current behind the market.
–
Apologies for the lack of special reports this Fall. I have been relocating, never easy but now complete.
So, shortly after the last report, we had a shallow pullback – a one day sell signal characteristic of this year – and the market rocked higher with its standard gap and go / catch me if you can type move – again characteristic of this year, paused briefly at 2600 and then shot up into the recent explosive peak which we are currently re-testing.
Save the image to your desktop to view a larger version
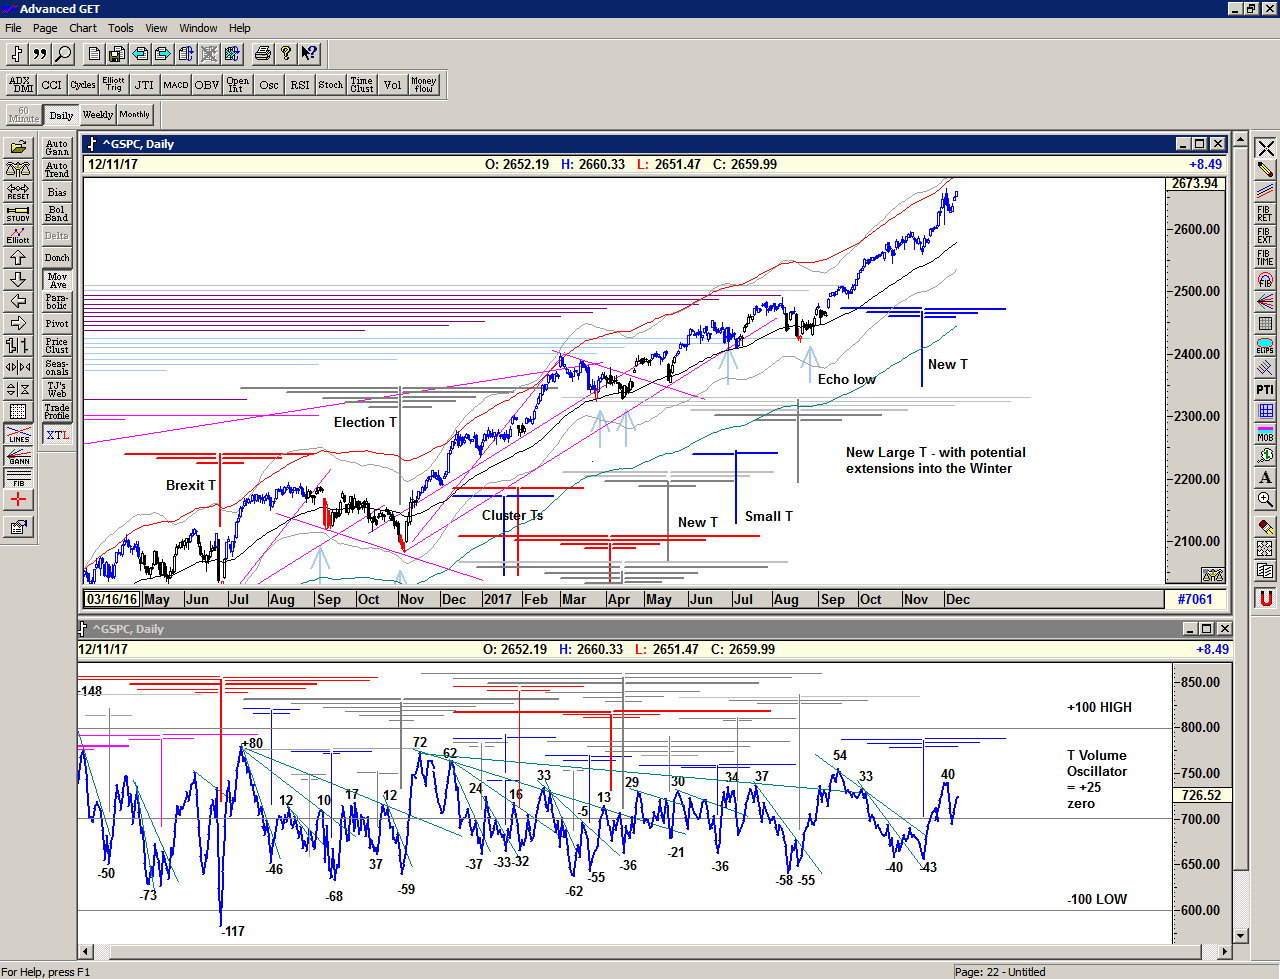
As you can see in the chart below, the T volume oscillator was in decline throughout the majority of the advance in October from 2500 to 2600. In T Theory terms this is called a cash-build up and is graphically defined by the line of lower highs in the oscillator marked in pale green. This is in effect profit-taking whilst the market continues to climb higher. You can see that the oscillator moves upwards through the cash-build up line just after the 15 November low. This defines that low as an important turning point and the market starts to use the cash-build up that goes back to the previous oscillator high – a new T structure has been formed.
Save the image to your desktop to view a larger version
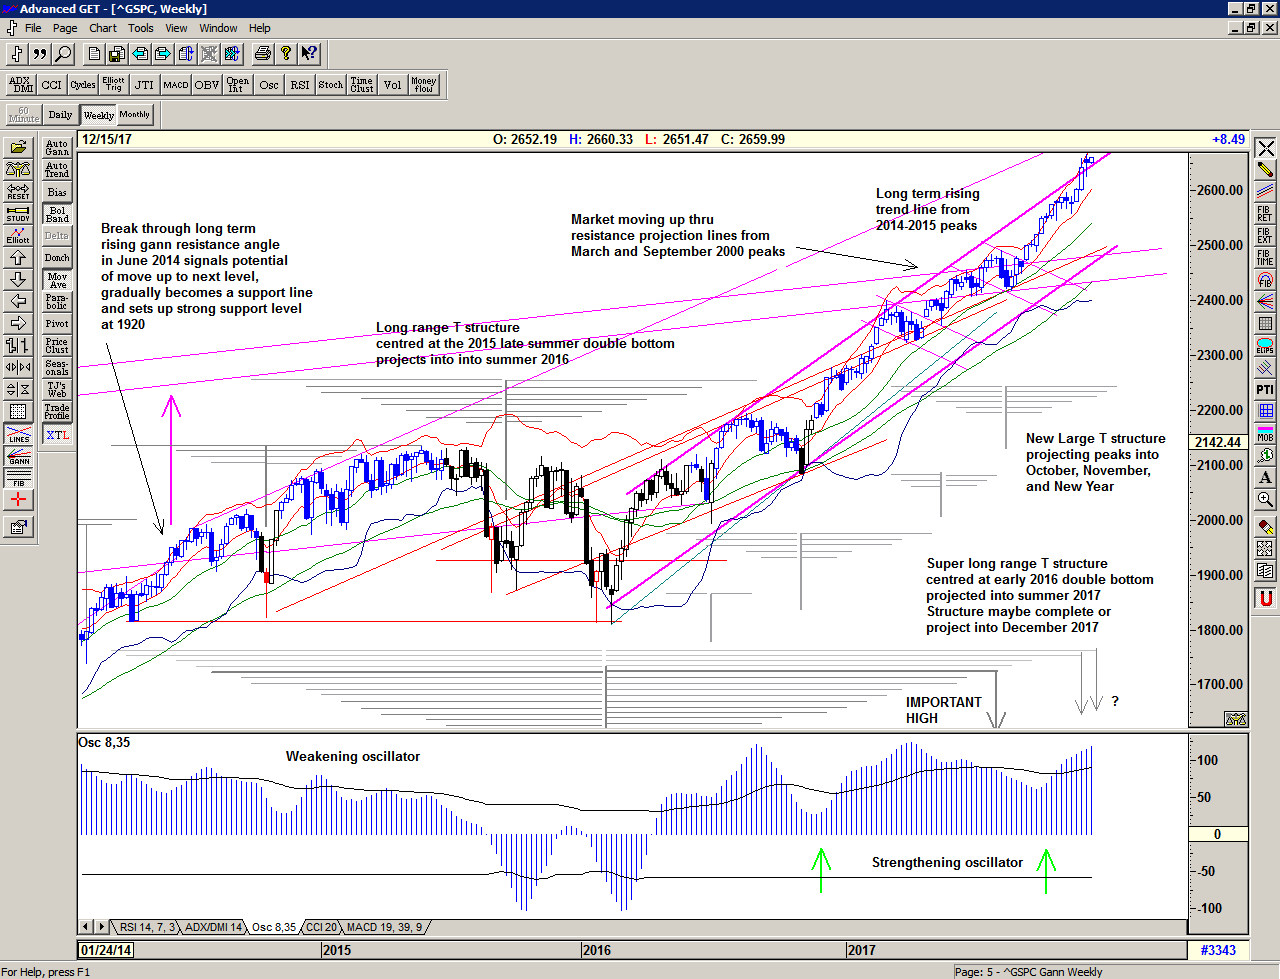
Zooming out to the bigger picture on a weekly chart. As you can see the market has been playing catch up and accelerating higher towards the upper reaches of a defined channel since the 2016 lows. I believe that the current target may well be the previous trajectory – the long term rising trend line from the 2014 and 2015 peaks.
Interestingly, the quick sell off after the 01 December explosive high is in-line with the possible peak projection drawn from the super long range double bottom T structure. The bigger structures can have significant effect at their end points, like a tsunami cruising through the ocean almost unoticeably until it reaches its destination shore. Another projection should occur just before the Christmas break and this is easily accommodated by the short term structures which are also pointing to peaks at this time.
Save the image to your desktop to view a larger version
–
I wish all of my subscribers and my readers a very special and warmest Winter Greeting as we celebrate the shortest day at the Solstice and the festival of Christmas, and the turning of the Old Year into the New Year.
—
Be prepared for whatever is coming next, and trade with confidence:
To receive detailed daily analysis, guidance and the updated daily Buy / Sell trigger levels being generated by the Trading the Line system before the market opens, and intraday alerts when appropriate, please become a Member and Sign up for Alerts & Observations – includes access to Members Area and the Explanatory Notes for all of the concepts discussed.
Disclaimer: This is the diary of a personal trading system, its methodology and the signals that it is producing. You are welcome to follow along but please understand that the information presented here is for educational purposes only. No recommendations are being made to buy, or sell stocks, options or futures contracts. Please consult your own financial advisor before making any investment decisions.


